

 This tutorial demonstrates how to create simple graphs in ROOT.
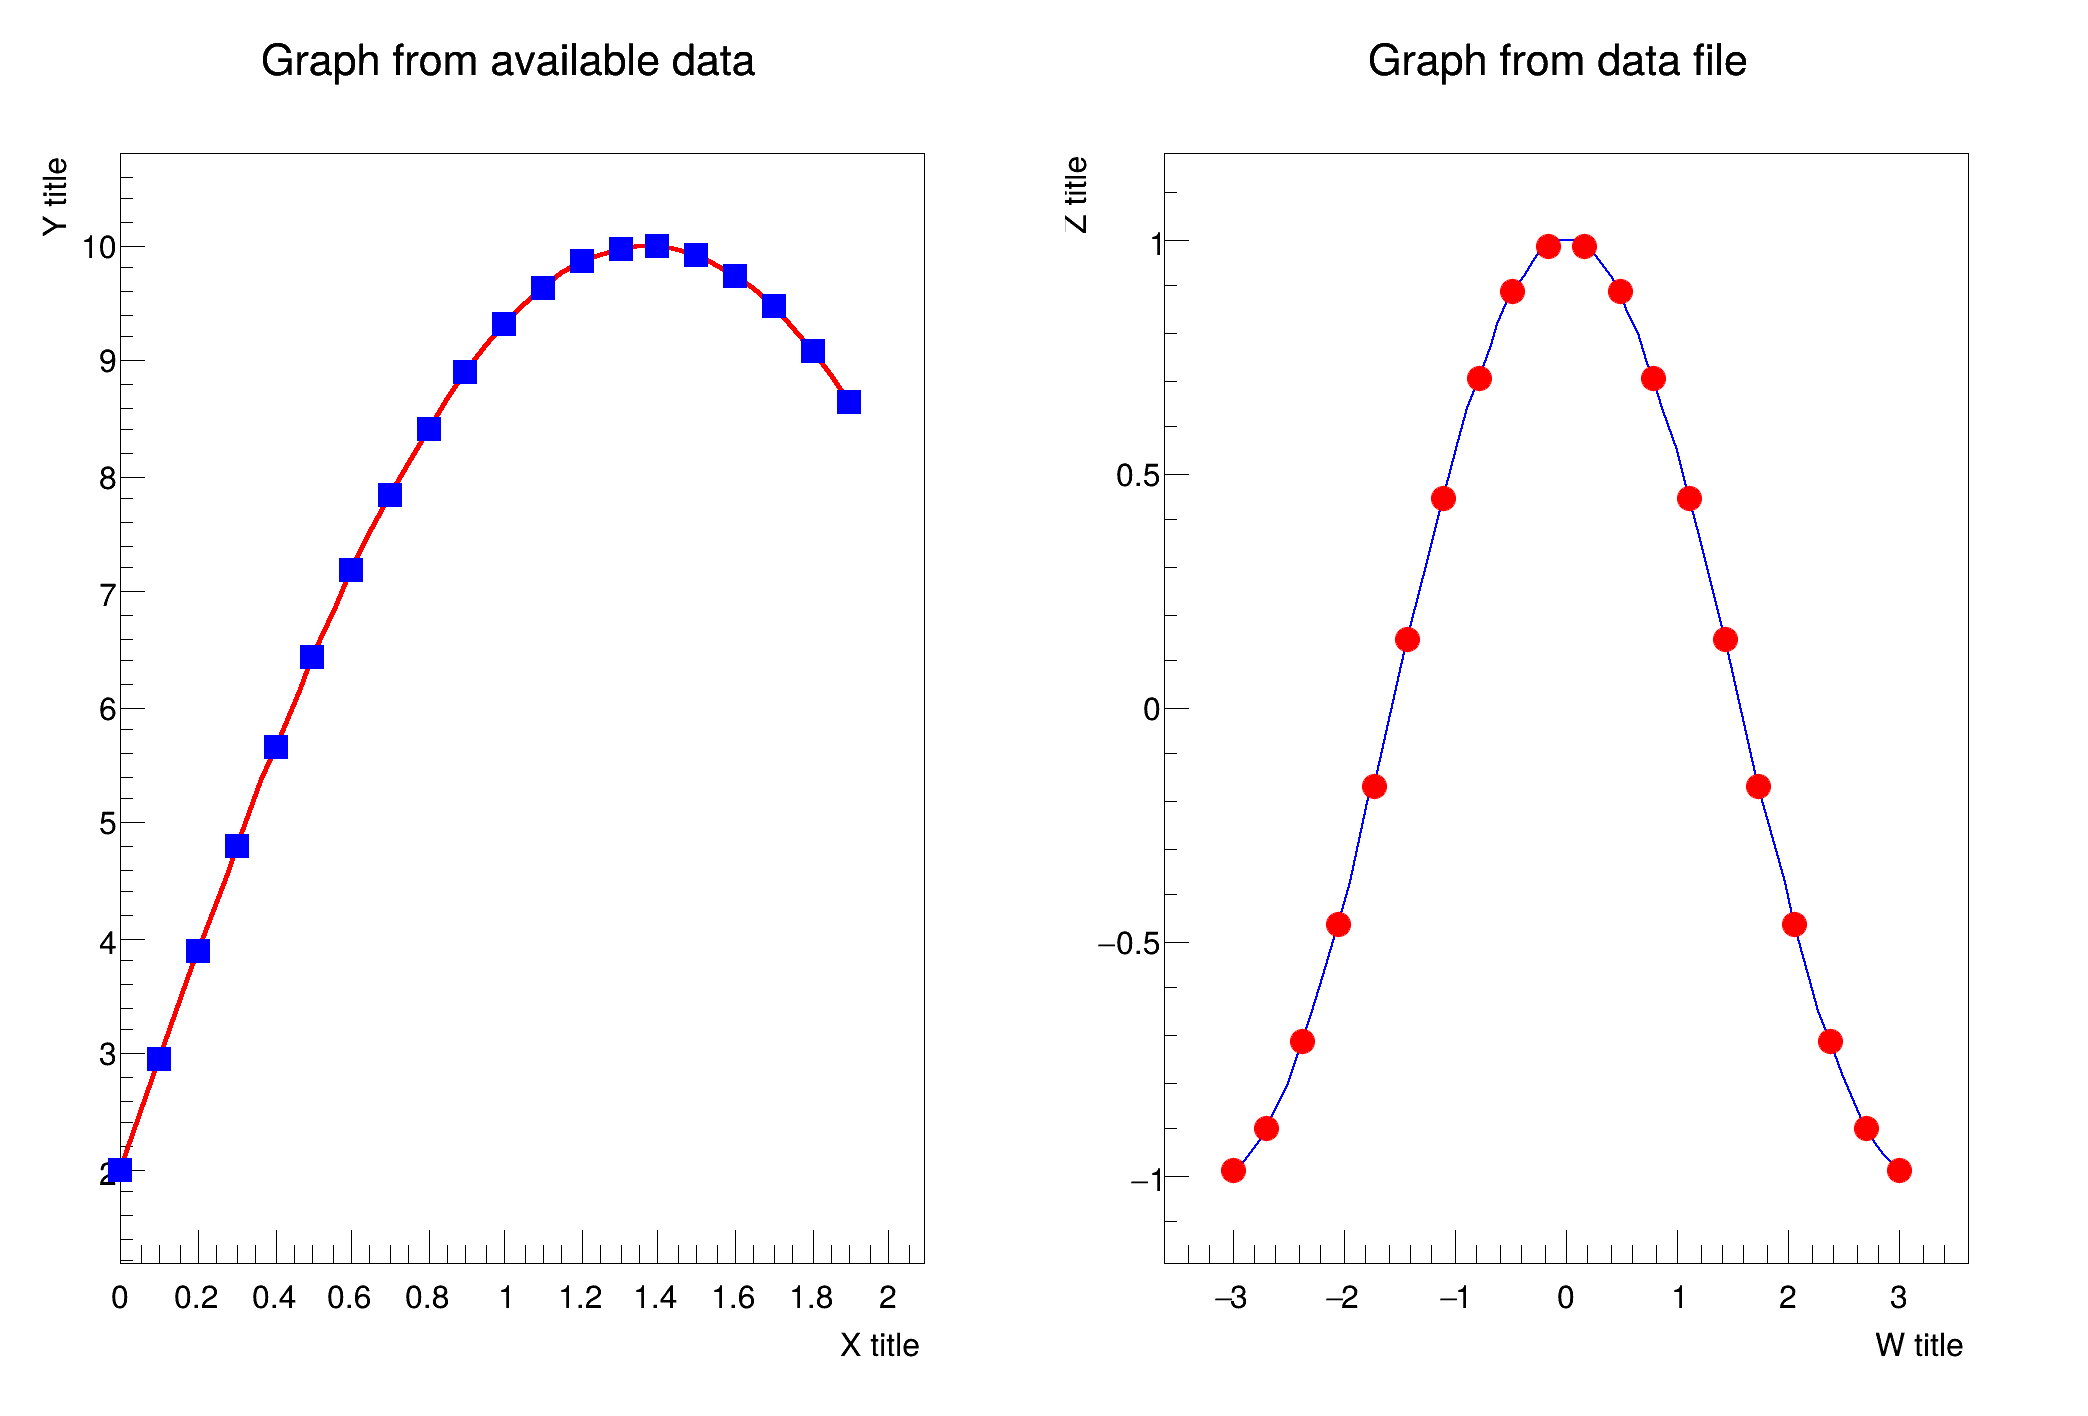
The example is divided into two sections:
- The first section plots data generated from arrays.
- The second section plots data read from a text file.
#include<fstream>
void gr001_simple() {
}
gr1->SetTitle(
"Graph from available data");
gr1->GetXaxis()->SetTitle(
"X title");
gr1->GetYaxis()->SetTitle(
"Y title");
std::ifstream file(
gROOT->GetTutorialDir() +
"/visualisation/graphs/data_basic.txt");
for (
Int_t i = 0; i <
m; i++) {
printf(
" i %i %f %f \n",i,
w[i],z[i]);
}
file.close();
gr2->SetTitle(
"Graph from data file");
gr2->GetXaxis()->SetTitle(
"W title");
gr2->GetYaxis()->SetTitle(
"Z title");
}
ROOT::Detail::TRangeCast< T, true > TRangeDynCast
TRangeDynCast is an adapter class that allows the typed iteration through a TCollection.
A TGraph is an object made of two arrays X and Y with npoints each.
- Author
- Rene Brun
Definition in file gr001_simple.C.