

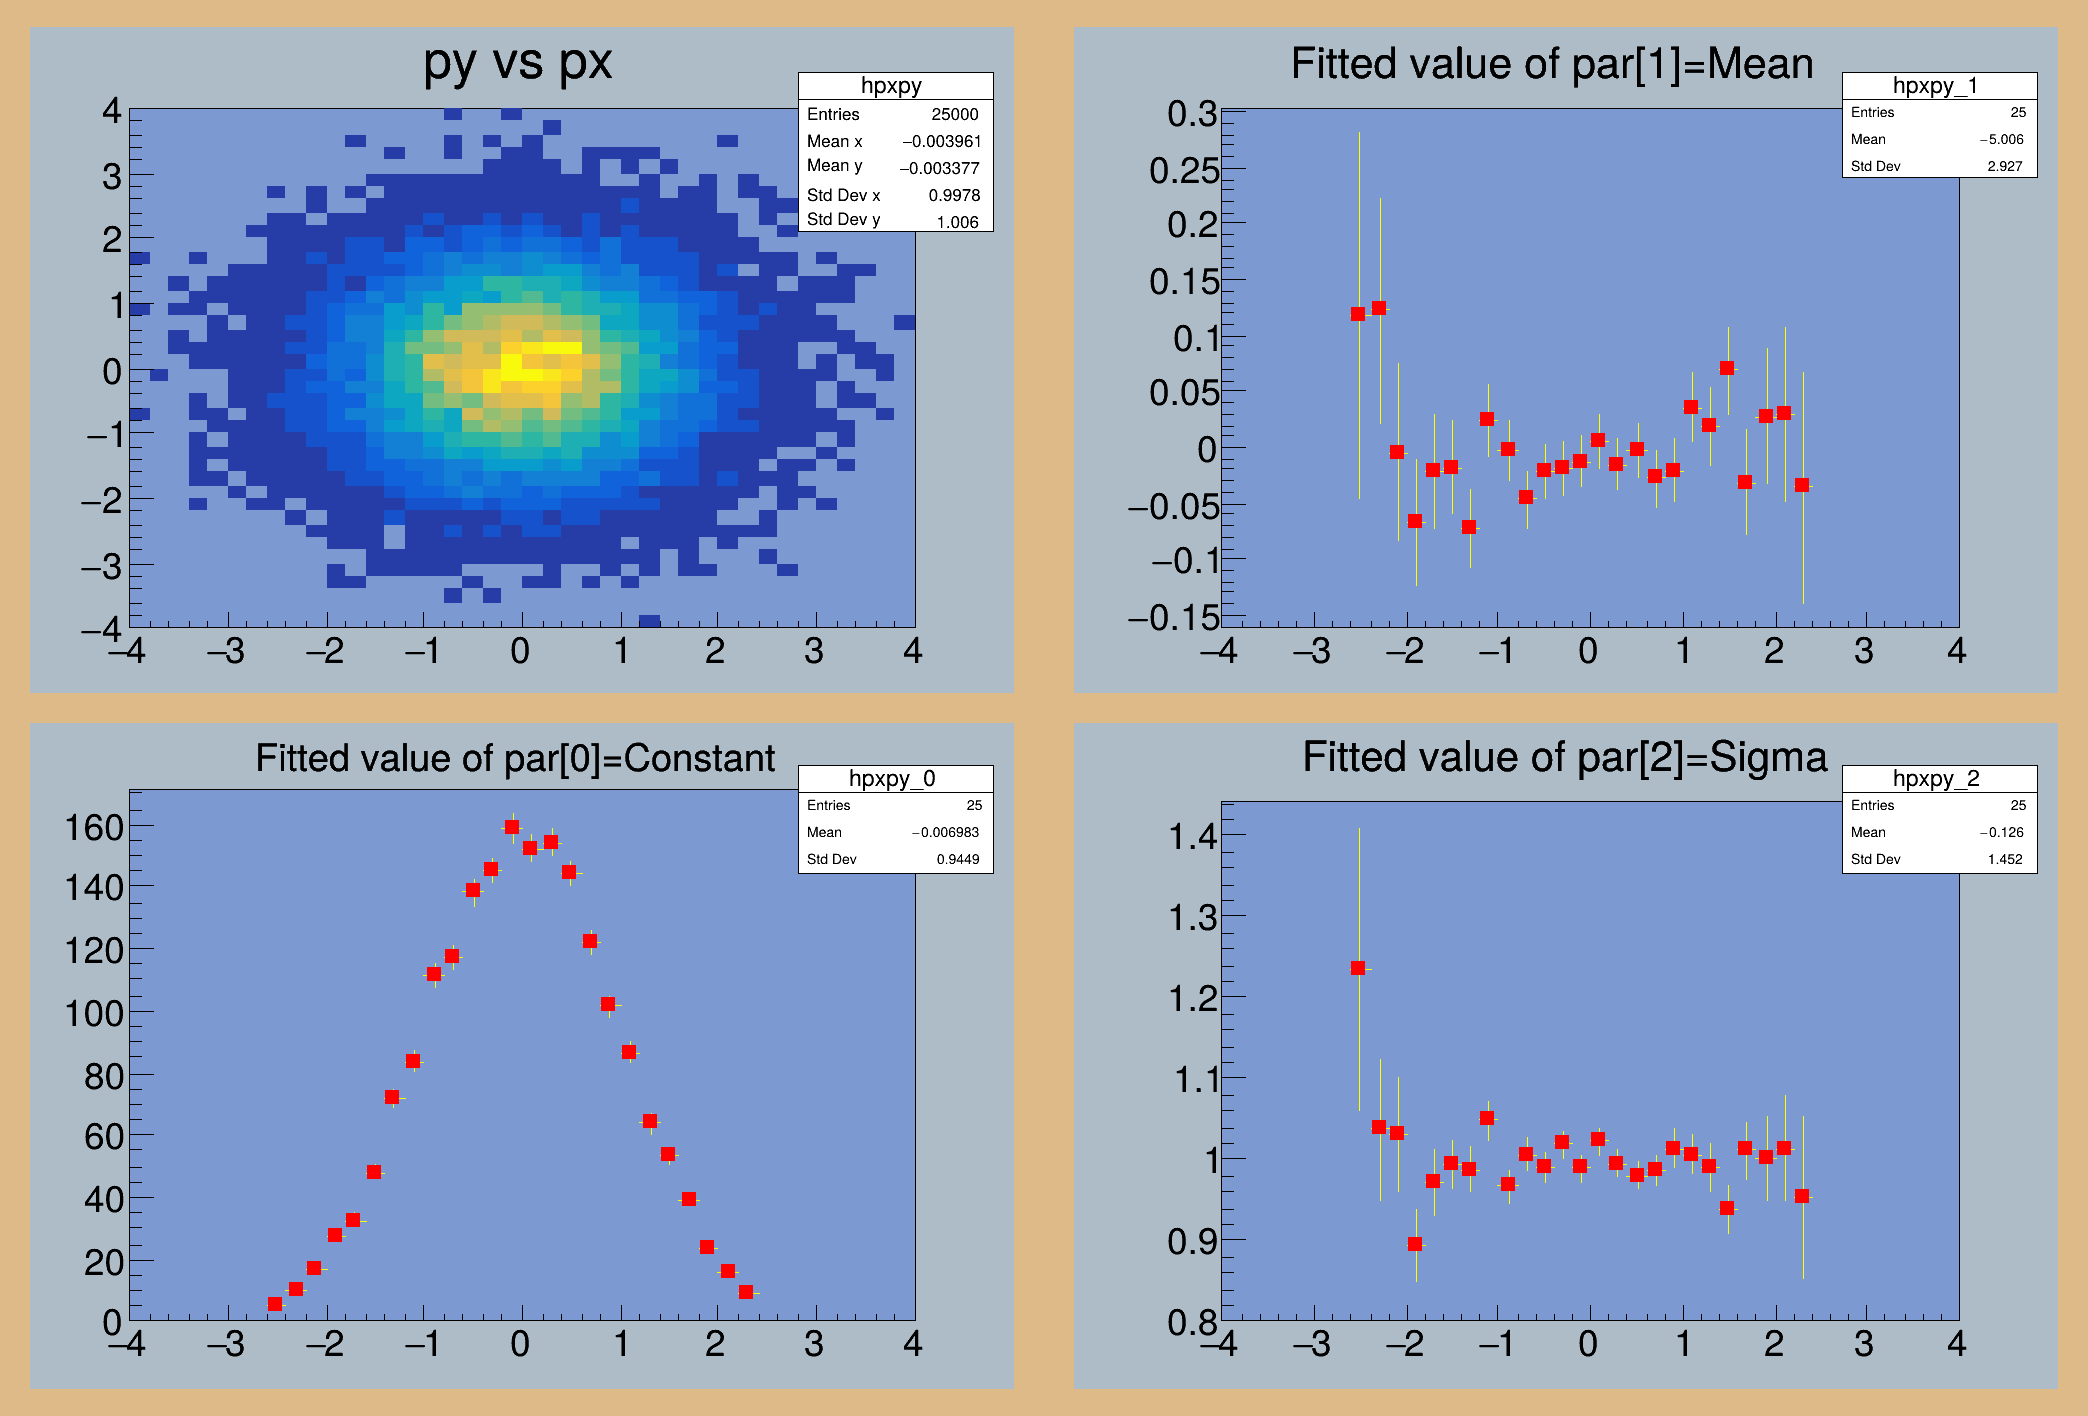
Illustrates how to use the TH1::FitSlicesY function It uses the TH2F histogram generated in macro hsimple.C It invokes FitSlicesY and draw the fitted "mean" and "sigma" in 2 sepate pads.
This macro shows also how to annotate a picture, change some pad parameters.
void fitslicesy() {
gStyle->SetLabelSize(0.06,
"x");
gStyle->SetLabelSize(0.06,
"y");
gStyle->SetFrameFillColor(38);
if (!hsimpleFile) return;
gPad->SetTopMargin(0.12);
gPad->SetTopMargin(0.12);
gPad->SetLeftMargin(0.15);
gPad->SetTopMargin(0.12);
gPad->SetLeftMargin(0.15);
}
R__EXTERN TStyle * gStyle
virtual void SetLabelSize(Float_t size=0.04)
Set size of axis labels.
virtual void SetLineColor(Color_t lcolor)
Set the line color.
virtual void SetMarkerColor(Color_t mcolor=1)
Set the marker color.
virtual void SetMarkerStyle(Style_t mstyle=1)
Set the marker style.
virtual void SetMarkerSize(Size_t msize=1)
Set the marker size.
TObject * Get(const char *namecycle) override
Return pointer to object identified by namecycle.
A file, usually with extension .root, that stores data and code in the form of serialized objects in ...
void Draw(Option_t *option="") override
Draw this histogram with options.
virtual void SetMinimum(Double_t minimum=-1111)
2-D histogram with a float per channel (see TH1 documentation)
virtual void FitSlicesY(TF1 *f1=nullptr, Int_t firstxbin=0, Int_t lastxbin=-1, Int_t cut=0, Option_t *option="QNR", TObjArray *arr=nullptr)
Project slices along Y in case of a 2-D histogram, then fit each slice with function f1 and make a hi...
The most important graphics class in the ROOT system.
void Divide(Int_t nx=1, Int_t ny=1, Float_t xmargin=0.01, Float_t ymargin=0.01, Int_t color=0) override
Automatic pad generation by division.
TVirtualPad * cd(Int_t subpadnumber=0) override
Set Current pad.
const char * Data() const
TString & ReplaceAll(const TString &s1, const TString &s2)
TString & Append(const char *cs)
- Author
- Rene Brun
Definition in file fitslicesy.C.


