ROOT
v6-32
Reference Guide
Loading...
Searching...
No Matches
exclusiongraph2.C File Reference
Tutorials
»
Graphs tutorials
Detailed Description
Draw several graphs with an exclusion zones.
void
exclusiongraph2
()
{
TCanvas
*
c
=
new
TCanvas
(
"c"
,
"Charged Higgs L300 Contour"
,0,0,700,700);
c
->SetTickx();
c
->SetTicky();
c
->SetGridx();
c
->SetGridy();
TH1
*frame =
new
TH1F
(
"frame"
,
""
,1000,50,500);
frame->
SetMinimum
(1);
frame->
SetMaximum
(50);
frame->
SetDirectory
(0);
frame->
SetStats
(0);
frame->
GetXaxis
()->
SetTitle
(
"m_{A} (GeV)"
);
frame->
GetXaxis
()->
SetTickLength
(0.02);
frame->
GetXaxis
()->
SetLabelSize
(0.03);
frame->
GetYaxis
()->
SetTitle
(
"tan#beta"
);
frame->
GetYaxis
()->
SetMoreLogLabels
();
frame->
GetYaxis
()->
SetLabelSize
(0.03);
frame->
Draw
(
" "
);
c
->SetLogy();
TGraph
*
gr1
=
new
TGraph
(10);
gr1
->SetFillColor(6);
gr1
->SetFillStyle(3005);
gr1
->SetLineColor(6);
gr1
->SetLineWidth(603);
gr1
->SetPoint(0,140,0.5);
gr1
->SetPoint(1,130,2.9);
gr1
->SetPoint(2,124.677,3.83726);
gr1
->SetPoint(3,113.362,6.06903);
gr1
->SetPoint(4,108.513,8.00221);
gr1
->SetPoint(5,111.746,10.0272);
gr1
->SetPoint(6,119.828,12.8419);
gr1
->SetPoint(7,135.991,30.0872);
gr1
->SetPoint(8,140,40);
gr1
->SetPoint(9,135,60);
gr1
->Draw(
"C"
);
TLatex
*
tex
=
new
TLatex
(140.841,37.9762,
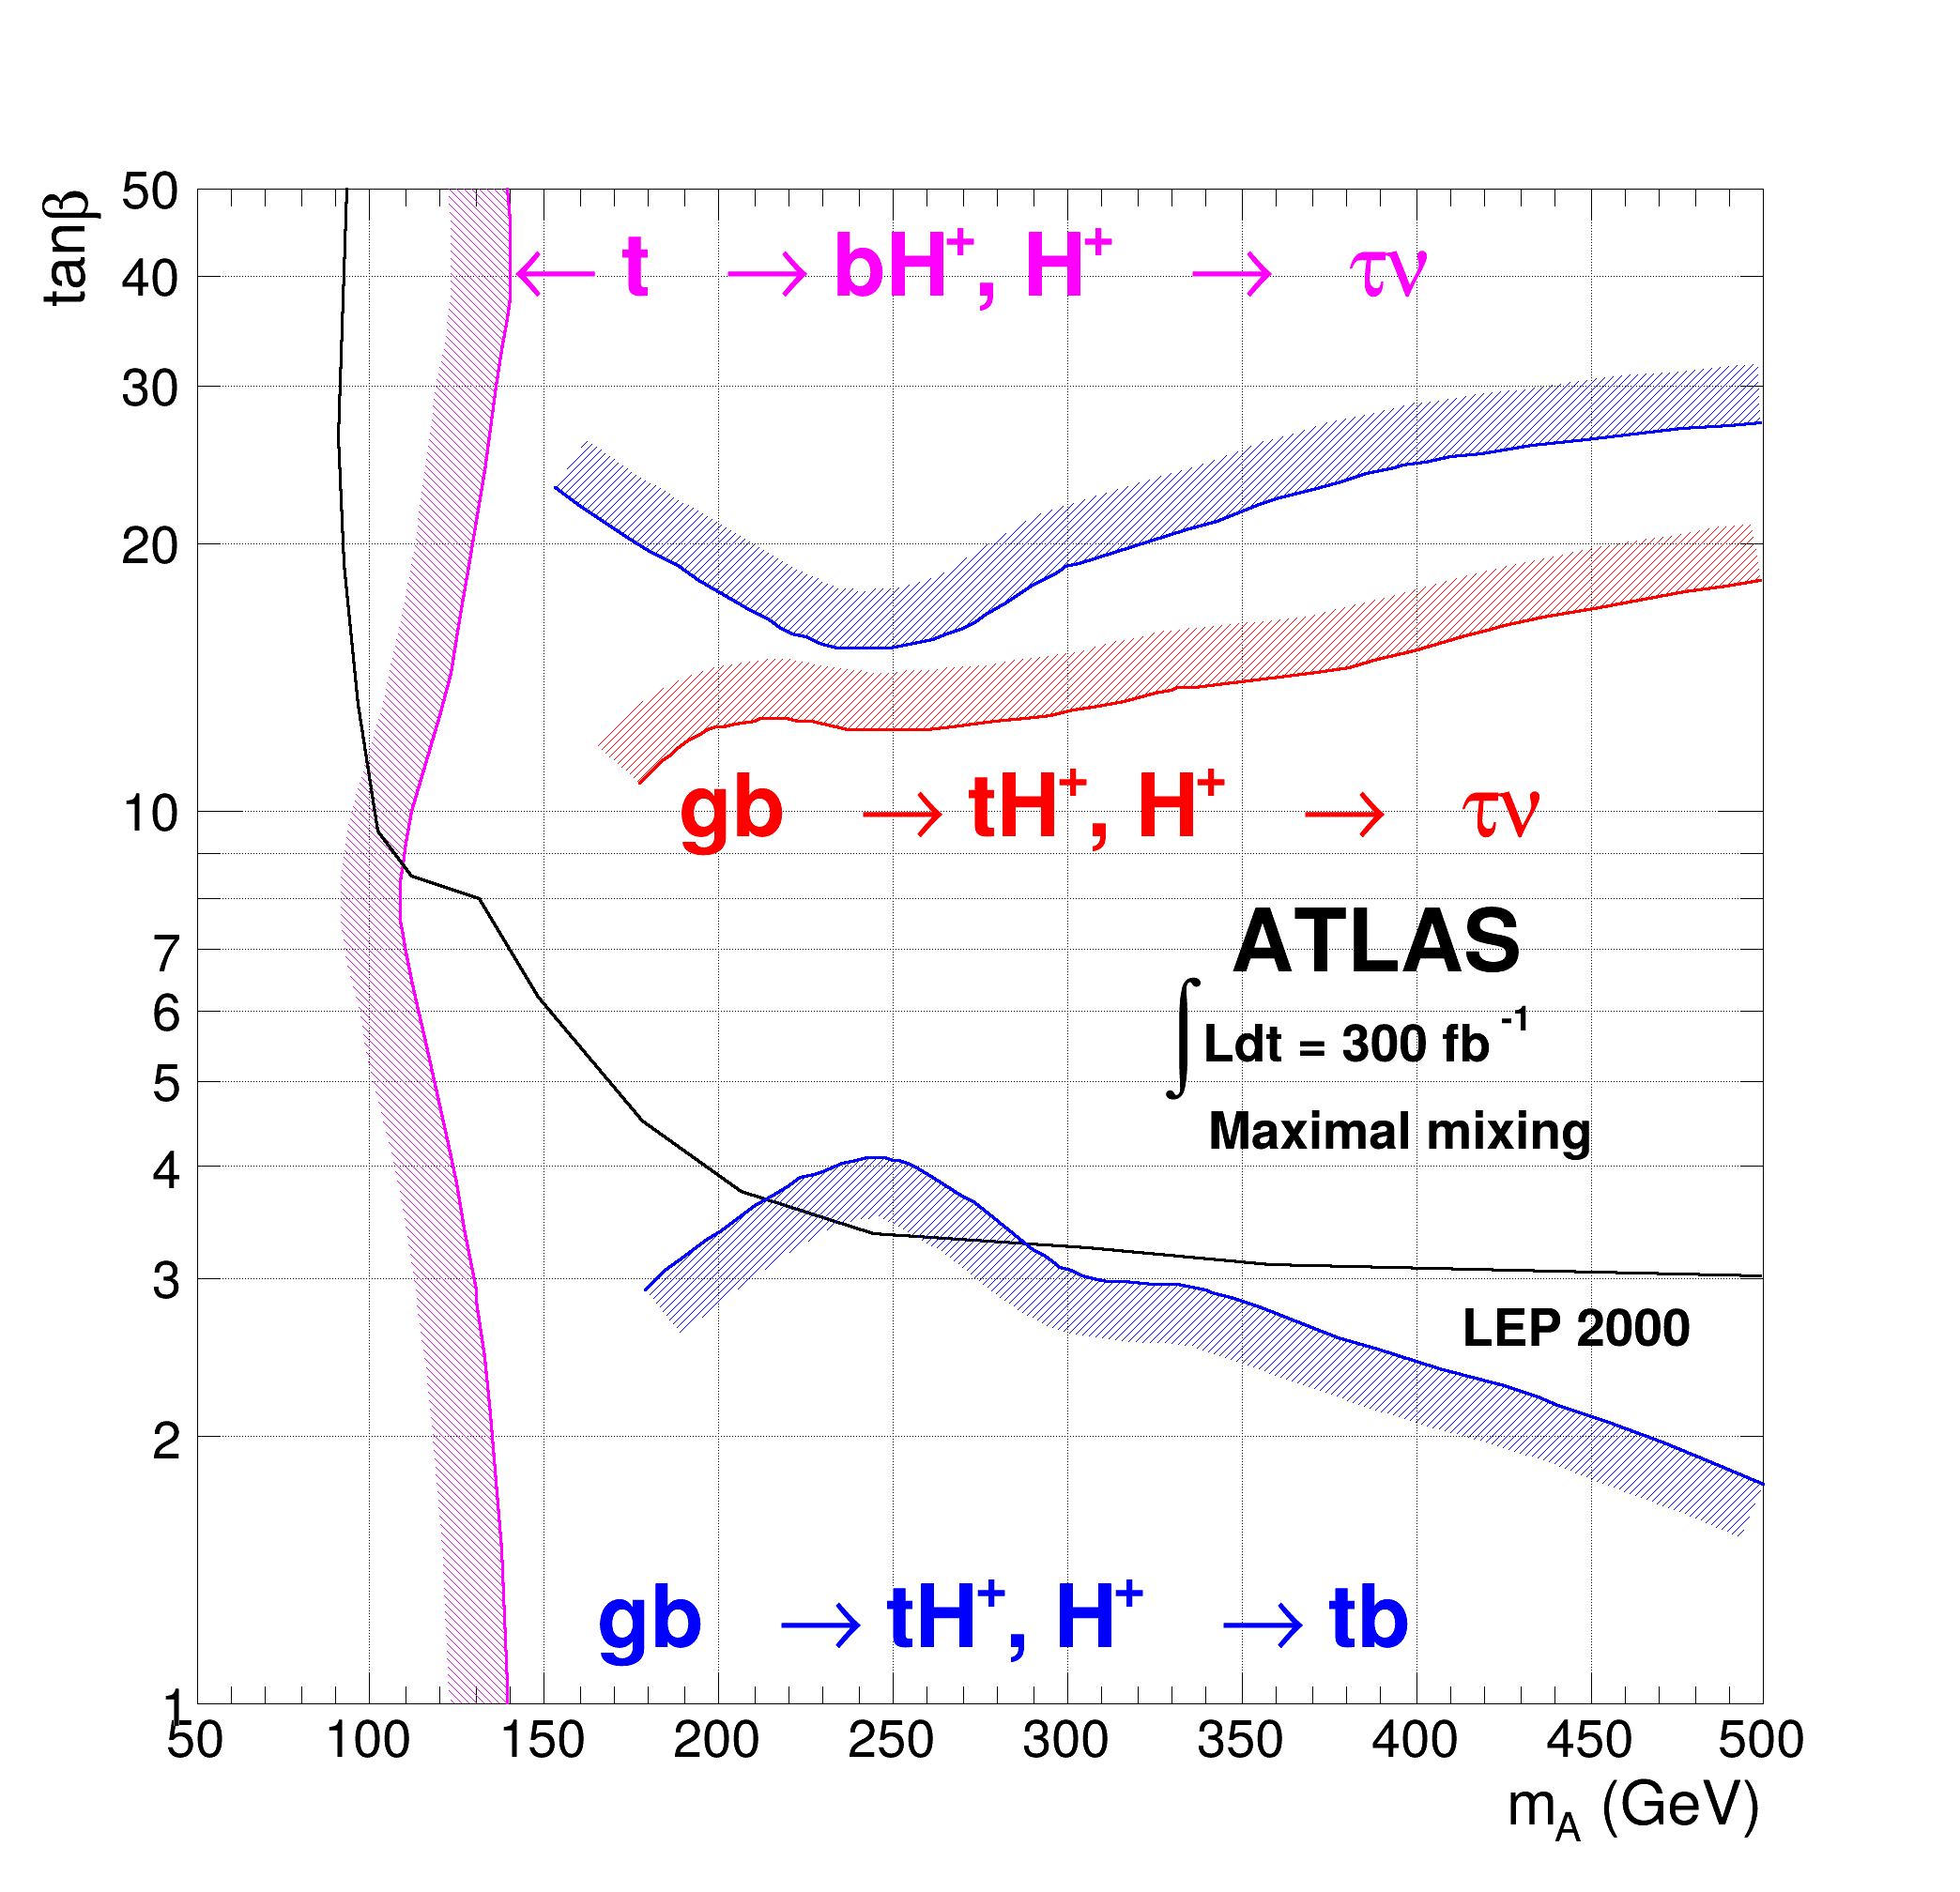
"#leftarrow t #rightarrow bH^{+}, H^{+} #rightarrow #tau#nu"
);
tex
->SetTextColor(6);
tex
->Draw();
TGraph
*
gr2
=
new
TGraph
(15);
gr2
->SetName(
"Graph"
);
gr2
->SetTitle(
"Graph"
);
gr2
->SetFillColor(1);
gr2
->SetFillStyle(3005);
gr2
->SetLineWidth(3);
gr2
->SetPoint(0,499.192,3.02622);
gr2
->SetPoint(1,427.748,3.06233);
gr2
->SetPoint(2,358.244,3.10722);
gr2
->SetPoint(3,305.711,3.24589);
gr2
->SetPoint(4,244.289,3.36617);
gr2
->SetPoint(5,206.304,3.7544);
gr2
->SetPoint(6,178.017,4.50347);
gr2
->SetPoint(7,148.114,6.20297);
gr2
->SetPoint(8,131.142,8.00221);
gr2
->SetPoint(9,111.746,8.48188);
gr2
->SetPoint(10,102.047,9.52921);
gr2
->SetPoint(11,96.3901,13.2212);
gr2
->SetPoint(12,92.3491,19.0232);
gr2
->SetPoint(13,90.7328,26.3935);
gr2
->SetPoint(14,93.1573,50.4385);
gr2
->Draw(
"L"
);
tex
=
new
TLatex
(346.929,6.62281,
"ATLAS"
);
tex
->SetLineWidth(2);
tex
->Draw();
tex
=
new
TLatex
(328.341,5.24703,
"#intLdt = 300 fb^{-1}"
);
tex
->SetTextSize(0.0297619);
tex
->SetLineWidth(2);
tex
->Draw();
tex
=
new
TLatex
(340.463,4.1874,
"Maximal mixing"
);
tex
->SetTextSize(0.0297619);
tex
->SetLineWidth(2);
tex
->Draw();
tex
=
new
TLatex
(413.2,2.51608,
"LEP 2000"
);
tex
->SetTextSize(0.0297619);
tex
->SetLineWidth(2);
tex
->Draw();
TGraph
*
gr3
=
new
TGraph
(10);
gr3
->SetName(
"Graph"
);
gr3
->SetTitle(
"Graph"
);
gr3
->SetFillColor(2);
gr3
->SetFillStyle(3004);
gr3
->SetLineColor(2);
gr3
->SetLineWidth(603);
gr3
->SetPoint(0,176.84,10.7499);
gr3
->SetPoint(1,190.575,11.9912);
gr3
->SetPoint(2,211.58,12.7108);
gr3
->SetPoint(3,243.088,12.3457);
gr3
->SetPoint(4,279.443,12.6185);
gr3
->SetPoint(5,302.065,12.9916);
gr3
->SetPoint(6,331.957,13.7713);
gr3
->SetPoint(7,369.928,14.2821);
gr3
->SetPoint(8,425.673,16.1651);
gr3
->SetPoint(9,499.192,18.1635);
gr3
->Draw(
"C"
);
tex
=
new
TLatex
(188.151,9.36035,
"gb #rightarrow tH^{+}, H^{+} #rightarrow #tau#nu"
);
tex
->SetTextColor(2);
tex
->Draw();
TGraph
*
gr4
=
new
TGraph
(10);
gr4
->SetName(
"Graph"
);
gr4
->SetTitle(
"Graph"
);
gr4
->SetFillColor(4);
gr4
->SetFillStyle(3004);
gr4
->SetLineColor(4);
gr4
->SetLineWidth(-603);
gr4
->SetPoint(0,178.456,2.91797);
gr4
->SetPoint(1,200.269,3.40033);
gr4
->SetPoint(2,229.354,3.96243);
gr4
->SetPoint(3,249.551,4.07959);
gr4
->SetPoint(4,269.749,3.71097);
gr4
->SetPoint(5,298.025,3.09308);
gr4
->SetPoint(6,341.652,2.89679);
gr4
->SetPoint(7,378.007,2.57808);
gr4
->SetPoint(8,441.023,2.16454);
gr4
->SetPoint(9,499.677,1.76145);
gr4
->Draw(
"C"
);
tex
=
new
TLatex
(165.,1.15498,
"gb #rightarrow tH^{+}, H^{+} #rightarrow tb"
);
tex
->SetTextColor(4);
tex
->Draw();
TGraph
*
gr5
=
new
TGraph
(10);
gr5
->SetName(
"Graph"
);
gr5
->SetTitle(
"Graph"
);
gr5
->SetFillColor(4);
gr5
->SetFillStyle(3004);
gr5
->SetLineColor(4);
gr5
->SetLineWidth(603);
gr5
->SetPoint(0,152.603,23.0996);
gr5
->SetPoint(1,188.151,18.8373);
gr5
->SetPoint(2,239.048,15.2499);
gr5
->SetPoint(3,264.901,15.8156);
gr5
->SetPoint(4,299.641,18.8373);
gr5
->SetPoint(5,334.381,20.7085);
gr5
->SetPoint(6,360.233,22.4362);
gr5
->SetPoint(7,396.589,24.4859);
gr5
->SetPoint(8,433.752,25.7669);
gr5
->SetPoint(9,499.192,27.3132);
gr5
->Draw(
"C"
);
}
c
#define c(i)
Definition
RSha256.hxx:101
TRangeDynCast
ROOT::Detail::TRangeCast< T, true > TRangeDynCast
TRangeDynCast is an adapter class that allows the typed iteration through a TCollection.
Definition
TCollection.h:358
ROOT::Detail::TRangeCast
Definition
TCollection.h:311
TAttAxis::SetLabelSize
virtual void SetLabelSize(Float_t size=0.04)
Set size of axis labels.
Definition
TAttAxis.cxx:203
TAttAxis::SetTickLength
virtual void SetTickLength(Float_t length=0.03)
Set tick mark length.
Definition
TAttAxis.cxx:284
TAxis::SetMoreLogLabels
void SetMoreLogLabels(Bool_t more=kTRUE)
Set the kMoreLogLabels bit flag When this option is selected more labels are drawn when in log scale ...
Definition
TAxis.h:223
TCanvas
The Canvas class.
Definition
TCanvas.h:23
TGraph
A TGraph is an object made of two arrays X and Y with npoints each.
Definition
TGraph.h:41
TH1F
1-D histogram with a float per channel (see TH1 documentation)
Definition
TH1.h:621
TH1
TH1 is the base class of all histogram classes in ROOT.
Definition
TH1.h:59
TH1::SetDirectory
virtual void SetDirectory(TDirectory *dir)
By default, when a histogram is created, it is added to the list of histogram objects in the current ...
Definition
TH1.cxx:8905
TH1::GetXaxis
TAxis * GetXaxis()
Definition
TH1.h:324
TH1::SetMaximum
virtual void SetMaximum(Double_t maximum=-1111)
Definition
TH1.h:403
TH1::GetYaxis
TAxis * GetYaxis()
Definition
TH1.h:325
TH1::Draw
void Draw(Option_t *option="") override
Draw this histogram with options.
Definition
TH1.cxx:3066
TH1::SetMinimum
virtual void SetMinimum(Double_t minimum=-1111)
Definition
TH1.h:404
TH1::SetStats
virtual void SetStats(Bool_t stats=kTRUE)
Set statistics option on/off.
Definition
TH1.cxx:8958
TLatex
To draw Mathematical Formula.
Definition
TLatex.h:18
TNamed::SetTitle
virtual void SetTitle(const char *title="")
Set the title of the TNamed.
Definition
TNamed.cxx:164
Author
Olivier Couet
Definition in file
exclusiongraph2.C
.
tutorials
graphs
exclusiongraph2.C
ROOT v6-32 - Reference Guide Generated on Mon Mar 10 2025 03:58:45 (GVA Time) using Doxygen 1.10.0