import ROOT
x = ROOT.RooRealVar("x", "x", -20, 20)
mean = ROOT.RooRealVar("mean", "mean of g1 and g2", 0, -1, 1)
sigma_g1 = ROOT.RooRealVar("sigma_g1", "width of g1", 2)
g1 = ROOT.RooGaussian("g1", "g1", x, mean, sigma_g1)
sigma_g2 = ROOT.RooRealVar("sigma_g2", "width of g2", 4, 3.0, 5.0)
g2 = ROOT.RooGaussian("g2", "g2", x, mean, sigma_g2)
frac = ROOT.RooRealVar("frac", "frac", 0.5, 0.0, 1.0)
model = ROOT.RooAddPdf("model", "model", [g1, g2], [frac])
data = model.generate({x}, 1000)
r = model.fitTo(data, Save=True, PrintLevel=-1)
parabPdf = r.createHessePdf({frac, mean, sigma_g2})
d = parabPdf.generate({mean, sigma_g2, frac}, 100000)
hh_3d = parabPdf.createHistogram("mean,sigma_g2,frac", 25, 25, 25)
hh_3d.SetFillColor(ROOT.kBlue)
pdf_sigmag2_frac = parabPdf.createProjection({mean})
pdf_mean_frac = parabPdf.createProjection({sigma_g2})
pdf_mean_sigmag2 = parabPdf.createProjection({frac})
hh_sigmag2_frac = pdf_sigmag2_frac.createHistogram("sigma_g2,frac", 50, 50)
hh_mean_frac = pdf_mean_frac.createHistogram("mean,frac", 50, 50)
hh_mean_sigmag2 = pdf_mean_sigmag2.createHistogram("mean,sigma_g2", 50, 50)
hh_mean_frac.SetLineColor(ROOT.kBlue)
hh_sigmag2_frac.SetLineColor(ROOT.kBlue)
hh_mean_sigmag2.SetLineColor(ROOT.kBlue)
ROOT.gStyle.SetCanvasPreferGL(True)
ROOT.gStyle.SetPalette(1)
c1 = ROOT.TCanvas("rf608_fitresultaspdf_1", "rf608_fitresultaspdf_1", 600, 600)
hh_3d.Draw("gliso")
c1.SaveAs("rf608_fitresultaspdf_1.png")
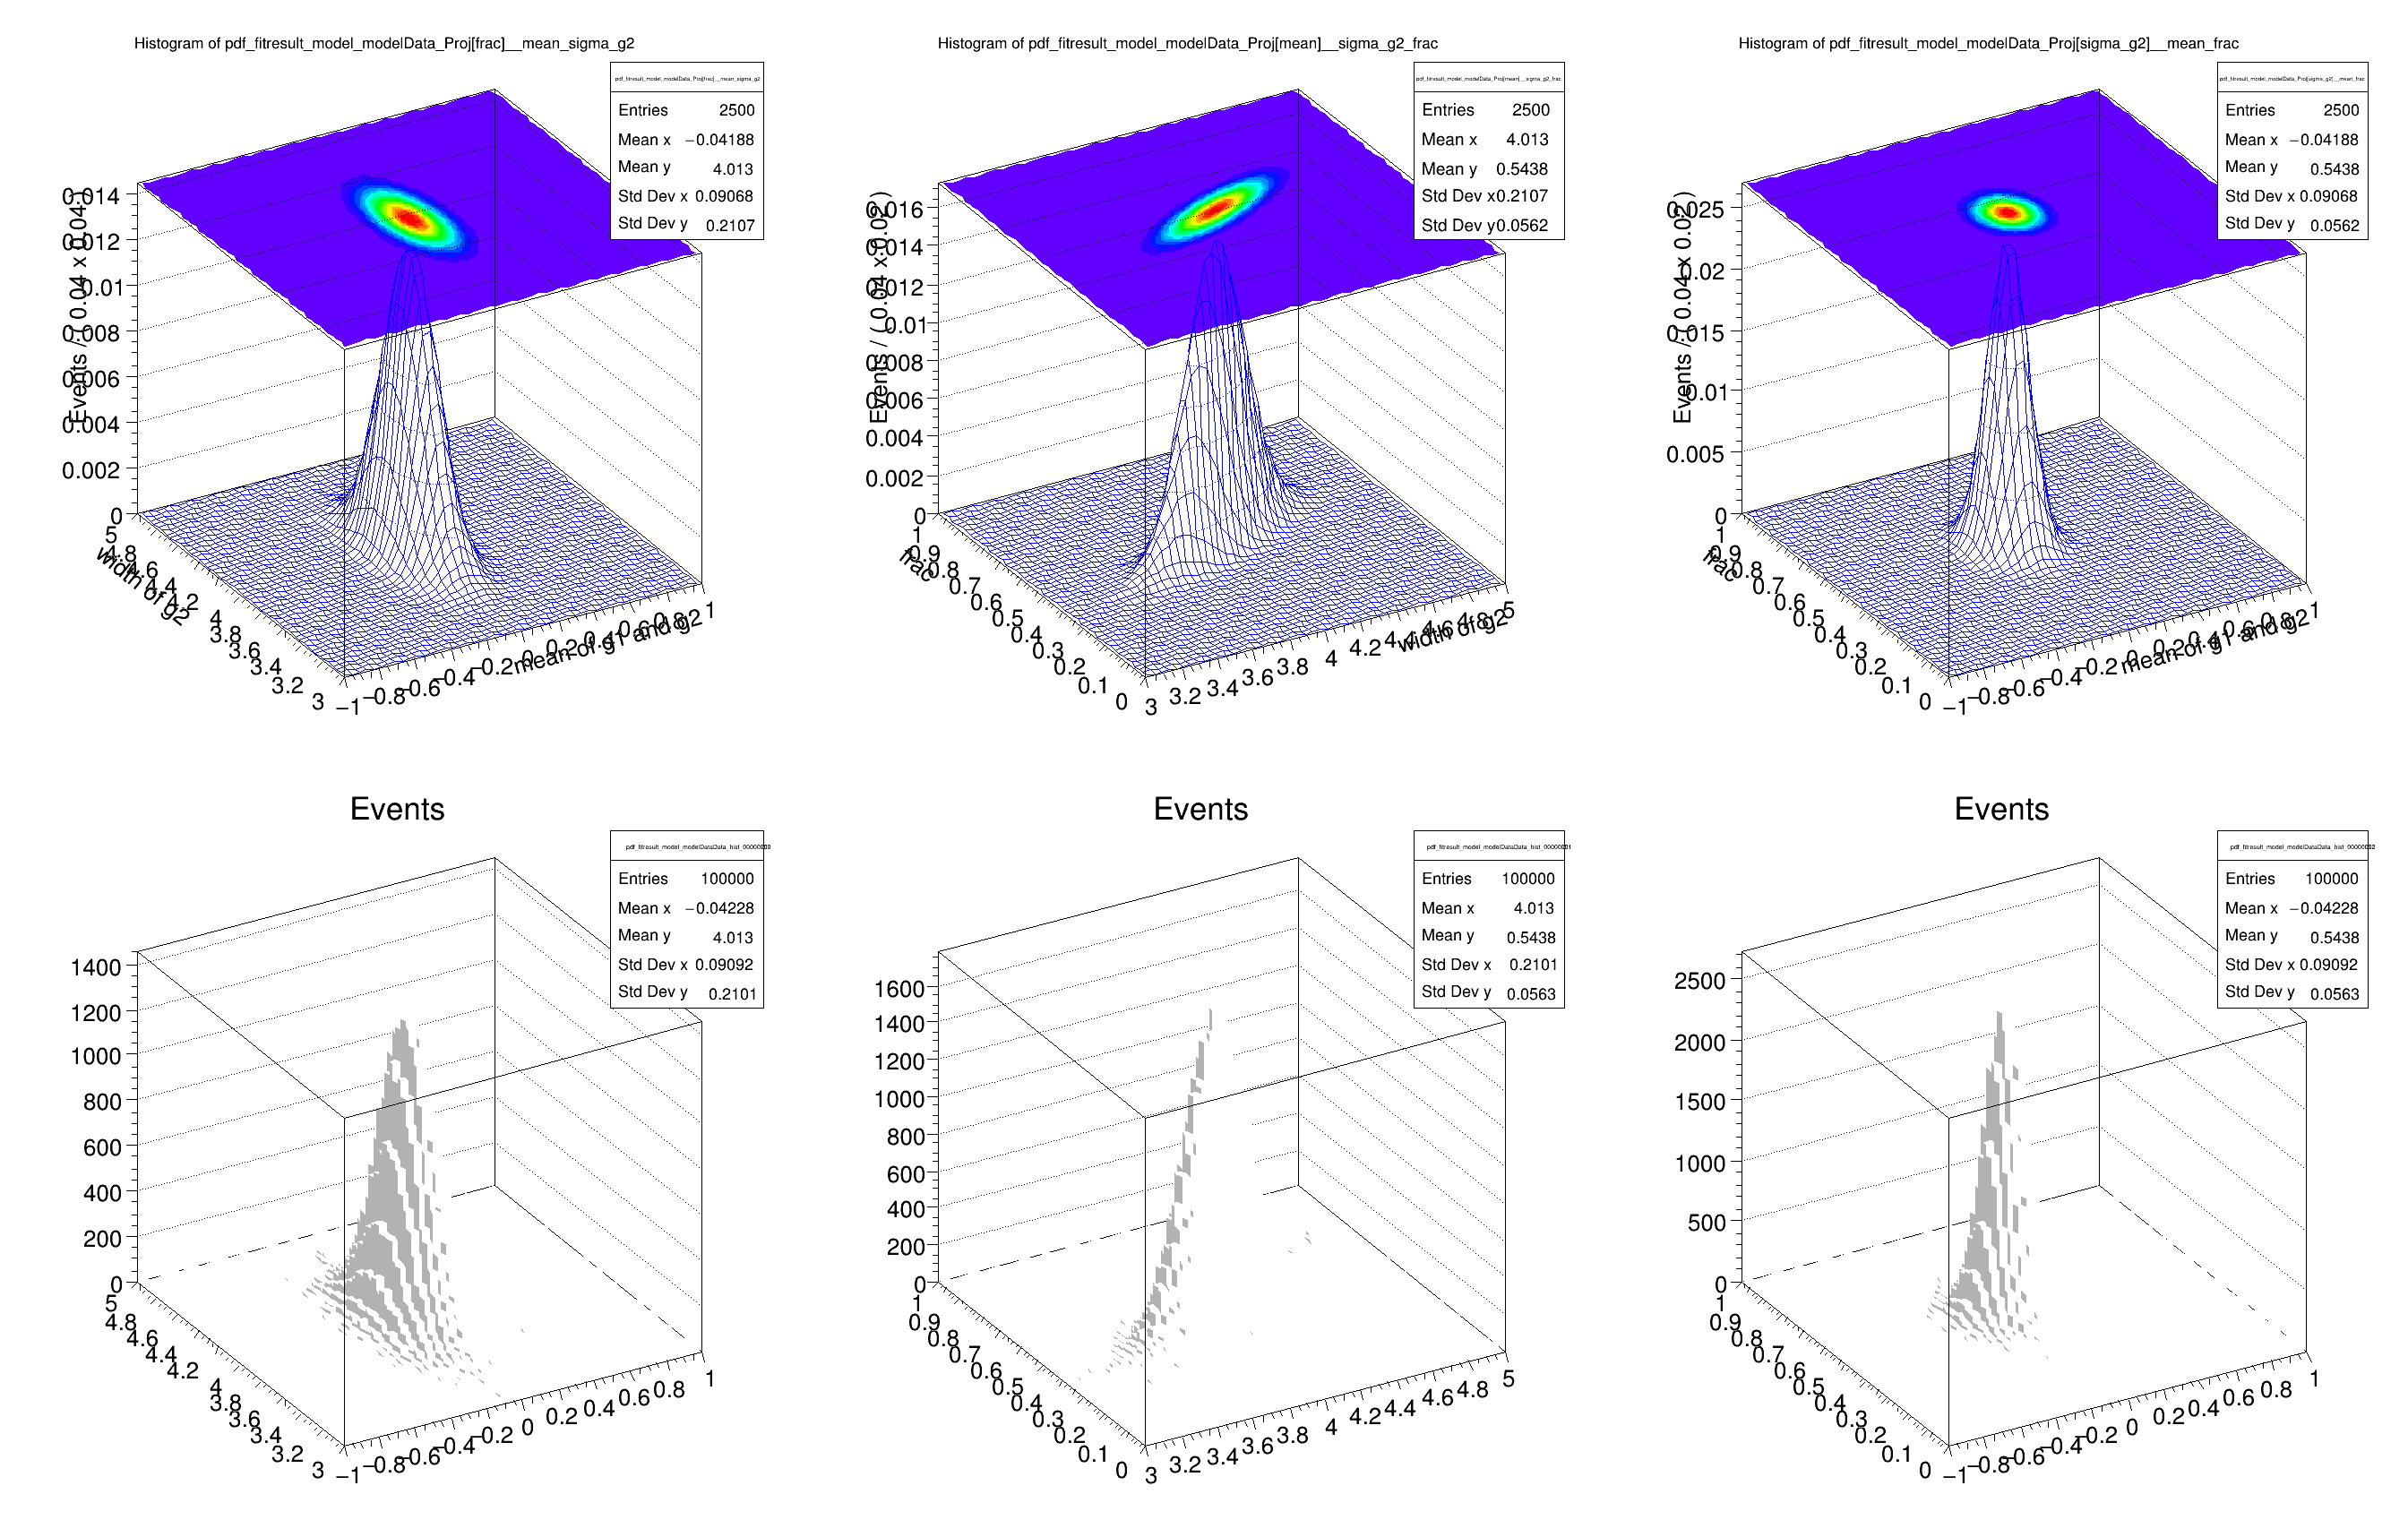
c2 = ROOT.TCanvas("rf608_fitresultaspdf_2", "rf608_fitresultaspdf_2", 900, 600)
c2.Divide(3, 2)
c2.cd(1)
ROOT.gPad.SetLeftMargin(0.15)
hh_mean_sigmag2.GetZaxis().SetTitleOffset(1.4)
hh_mean_sigmag2.Draw("surf3")
c2.cd(2)
ROOT.gPad.SetLeftMargin(0.15)
hh_sigmag2_frac.GetZaxis().SetTitleOffset(1.4)
hh_sigmag2_frac.Draw("surf3")
c2.cd(3)
ROOT.gPad.SetLeftMargin(0.15)
hh_mean_frac.GetZaxis().SetTitleOffset(1.4)
hh_mean_frac.Draw("surf3")
tmp1 = d.createHistogram(mean, sigma_g2, 50, 50)
tmp2 = d.createHistogram(sigma_g2, frac, 50, 50)
tmp3 = d.createHistogram(mean, frac, 50, 50)
c2.cd(4)
ROOT.gPad.SetLeftMargin(0.15)
tmp1.GetZaxis().SetTitleOffset(1.4)
tmp1.Draw("lego3")
c2.cd(5)
ROOT.gPad.SetLeftMargin(0.15)
tmp2.GetZaxis().SetTitleOffset(1.4)
tmp2.Draw("lego3")
c2.cd(6)
ROOT.gPad.SetLeftMargin(0.15)
tmp3.GetZaxis().SetTitleOffset(1.4)
tmp3.Draw("lego3")
c2.SaveAs("rf608_fitresultaspdf_2.png")


