Logo ROOT  
Reference Guide
 
Loading...
Searching...
No Matches
rf308_normintegration2d.py File Reference

Namespaces

namespace  rf308_normintegration2d
 

Detailed Description

View in nbviewer Open in SWAN
Multidimensional models: normalization and integration of pdfs, construction of cumulative distribution functions from pdfs in two dimensions

from __future__ import print_function
import ROOT
# Set up model
# ---------------------
# Create observables x,y
x = ROOT.RooRealVar("x", "x", -10, 10)
y = ROOT.RooRealVar("y", "y", -10, 10)
# Create pdf gaussx(x,-2,3), gaussy(y,2,2)
gx = ROOT.RooGaussian("gx", "gx", x, -2.0, 3.0)
gy = ROOT.RooGaussian("gy", "gy", y, +2.0, 2.0)
# gxy = gx(x)*gy(y)
gxy = ROOT.RooProdPdf("gxy", "gxy", [gx, gy])
# Retrieve raw & normalized values of RooFit pdfs
# --------------------------------------------------------------------------------------------------
# Return 'raw' unnormalized value of gx
print("gxy = ", gxy.getVal())
# Return value of gxy normalized over x _and_ y in range [-10,10]
nset_xy = {x, y}
print("gx_Norm[x,y] = ", gxy.getVal(nset_xy))
# Create object representing integral over gx
# which is used to calculate gx_Norm[x,y] == gx / gx_Int[x,y]
x_and_y = {x, y}
igxy = gxy.createIntegral(x_and_y)
print("gx_Int[x,y] = ", igxy.getVal())
# NB: it is also possible to do the following
# Return value of gxy normalized over x in range [-10,10] (i.e. treating y
# as parameter)
nset_x = {x}
print("gx_Norm[x] = ", gxy.getVal(nset_x))
# Return value of gxy normalized over y in range [-10,10] (i.e. treating x
# as parameter)
nset_y = {y}
print("gx_Norm[y] = ", gxy.getVal(nset_y))
# Integrate normalized pdf over subrange
# ----------------------------------------------------------------------------
# Define a range named "signal" in x from -5,5
x.setRange("signal", -5, 5)
y.setRange("signal", -3, 3)
# Create an integral of gxy_Norm[x,y] over x and y in range "signal"
# ROOT.This is the fraction of of pdf gxy_Norm[x,y] which is in the
# range named "signal"
igxy_sig = gxy.createIntegral(x_and_y, NormSet=x_and_y, Range="signal")
print("gx_Int[x,y|signal]_Norm[x,y] = ", igxy_sig.getVal())
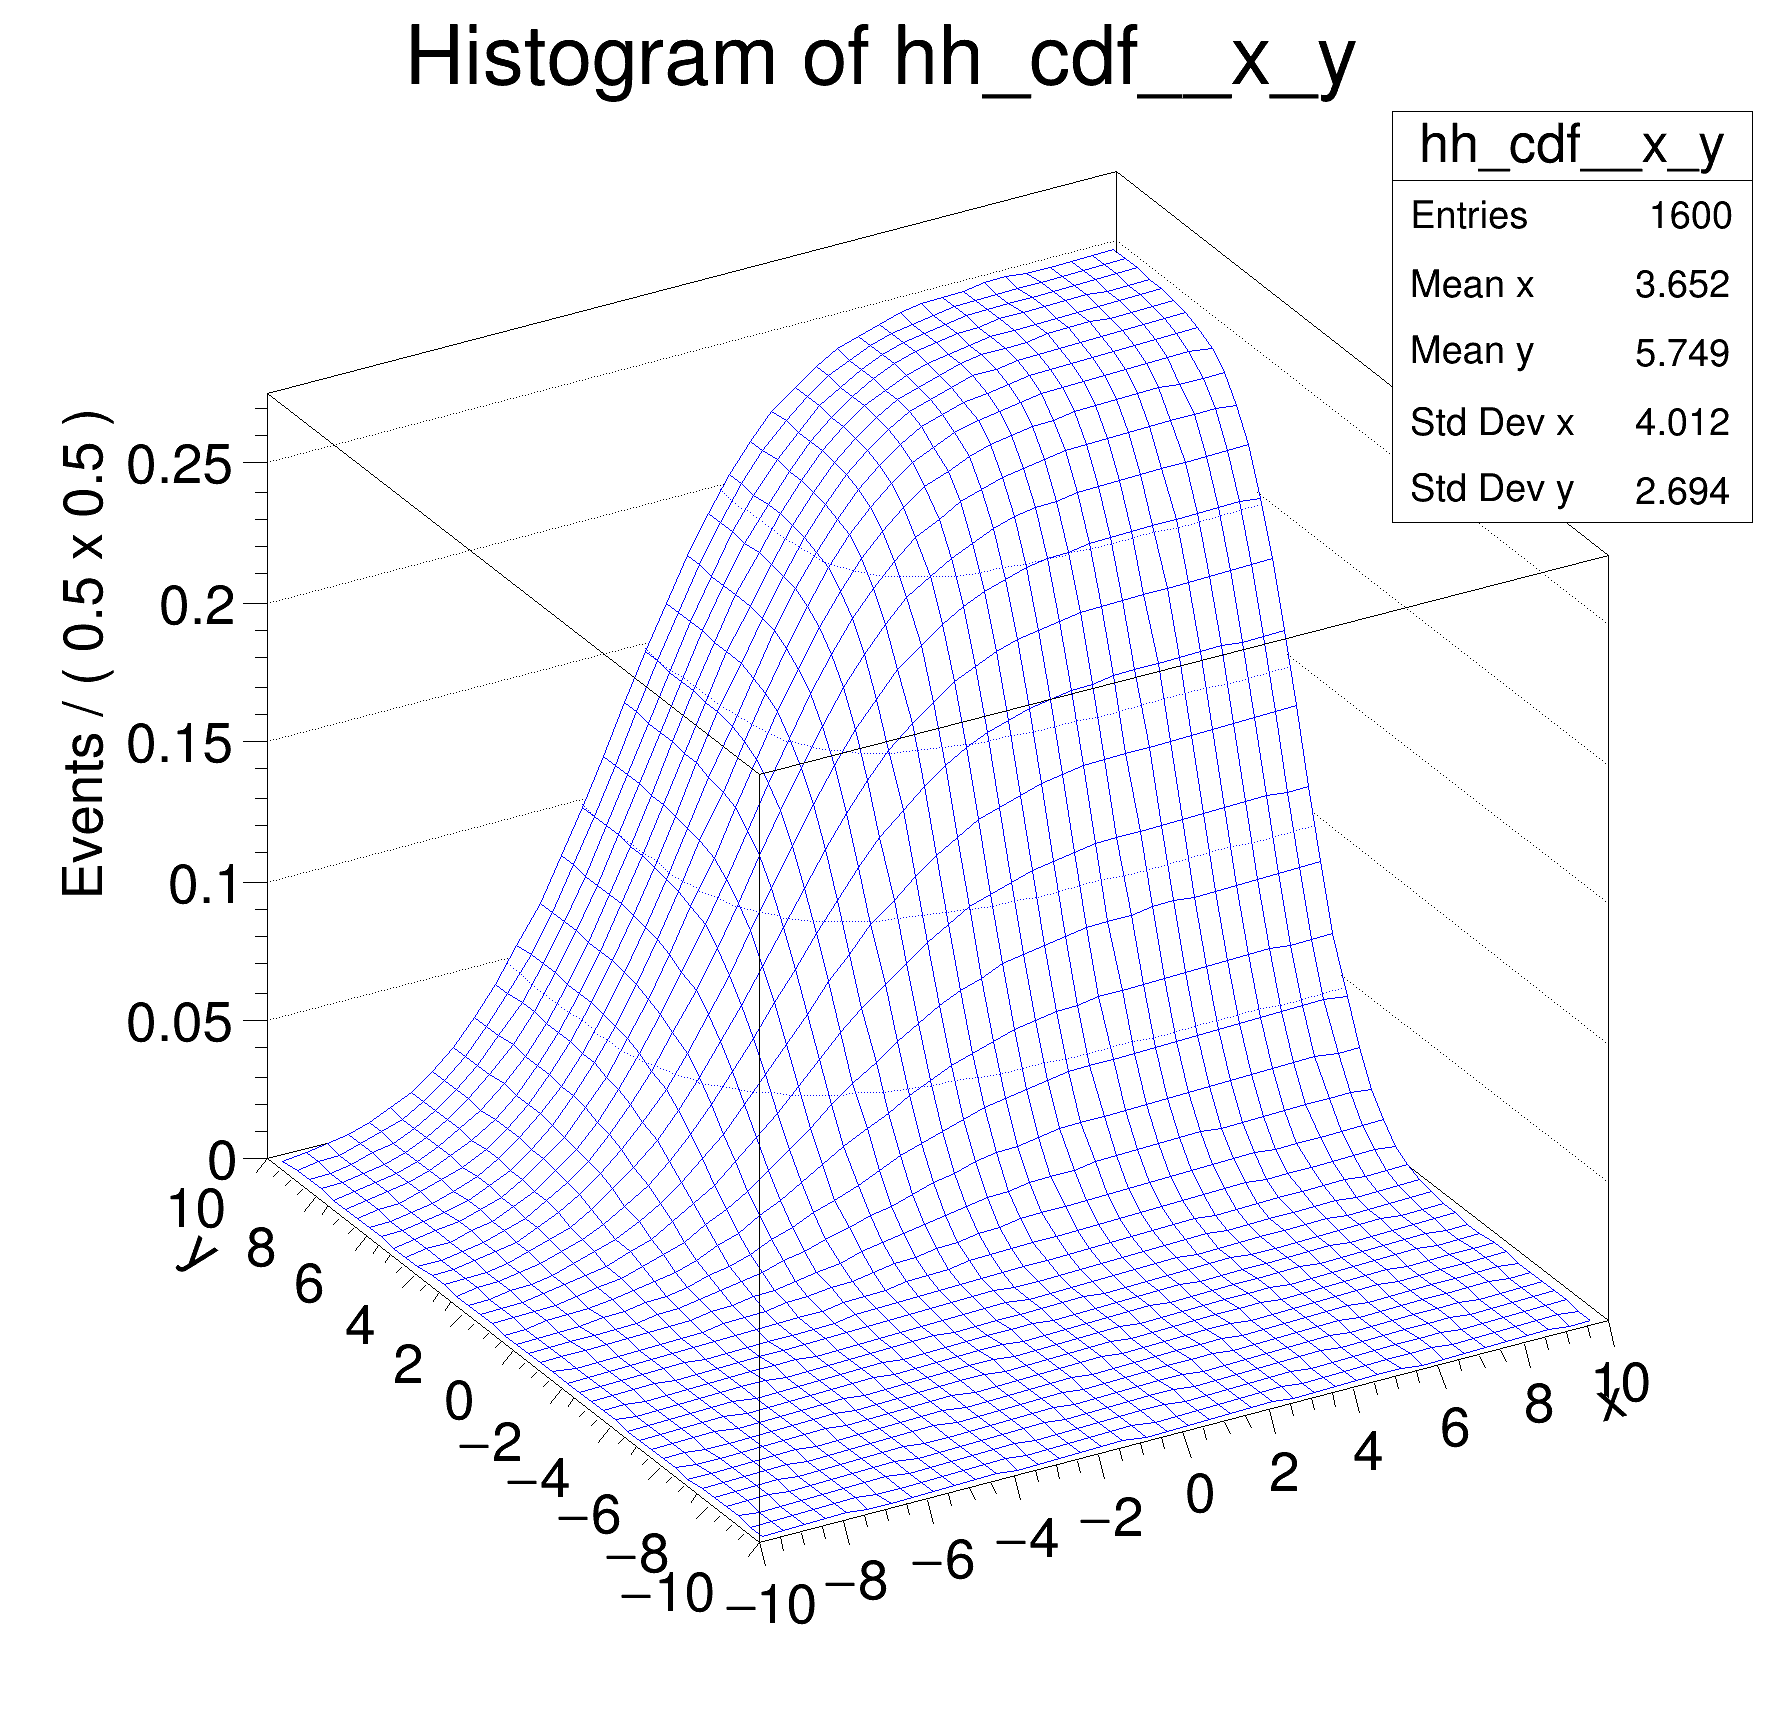
# Construct cumulative distribution function from pdf
# -----------------------------------------------------------------------------------------------------
# Create the cumulative distribution function of gx
# i.e. calculate Int[-10,x] gx(x') dx'
gxy_cdf = gxy.createCdf({x, y})
# Plot cdf of gx versus x
hh_cdf = gxy_cdf.createHistogram("hh_cdf", x, Binning=40, YVar=dict(var=y, Binning=40))
hh_cdf.SetLineColor(ROOT.kBlue)
c = ROOT.TCanvas("rf308_normintegration2d", "rf308_normintegration2d", 600, 600)
ROOT.gPad.SetLeftMargin(0.15)
hh_cdf.GetZaxis().SetTitleOffset(1.8)
hh_cdf.Draw("surf")
c.SaveAs("rf308_normintegration2d.png")
[#1] INFO:Eval -- RooRealVar::setRange(x) new range named 'signal' created with bounds [-5,5]
[#1] INFO:Eval -- RooRealVar::setRange(y) new range named 'signal' created with bounds [-3,3]
gxy = 0.4856717852477124
gx_Norm[x,y] = 0.012933200957206766
gx_Int[x,y] = 37.552326516436096
gx_Norm[x] = 0.1068955044839622
gx_Norm[y] = 0.12098919425696865
gx_Int[x,y|signal]_Norm[x,y] = 0.5720351351990984
Date
February 2018
Authors
Clemens Lange, Wouter Verkerke (C++ version)

Definition in file rf308_normintegration2d.py.