import ROOT
def makeFakeDataXY():
x = ROOT.RooRealVar("x", "x", -10, 10)
y = ROOT.RooRealVar("y", "y", -10, 10)
coord = {x, y}
d = ROOT.RooDataSet("d", "d", coord)
for i in range(10000):
tmpy = ROOT.gRandom.Gaus(0, 10)
tmpx = ROOT.gRandom.Gaus(0.5 * tmpy, 1)
if (abs(tmpy) < 10) and (abs(tmpx) < 10):
x.setVal(tmpx)
y.setVal(tmpy)
d.add(coord)
return d
x = ROOT.RooRealVar("x", "x", -10, 10)
y = ROOT.RooRealVar("y", "y", -10, 10)
a0 = ROOT.RooRealVar("a0", "a0", -0.5, -5, 5)
a1 = ROOT.RooRealVar("a1", "a1", -0.5, -1, 1)
fy = ROOT.RooPolyVar("fy", "fy", y, [a0, a1])
sigma = ROOT.RooRealVar("sigma", "width of gaussian", 0.5, 0.1, 2.0)
model = ROOT.RooGaussian("model", "Gaussian with shifting mean", x, fy, sigma)
expDataXY = makeFakeDataXY()
expDataY = expDataXY.reduce({y})
data = model.generate({x}, ProtoData=expDataY)
data.Print()
model.fitTo(expDataXY, ConditionalObservables={y}, PrintLevel=-1)
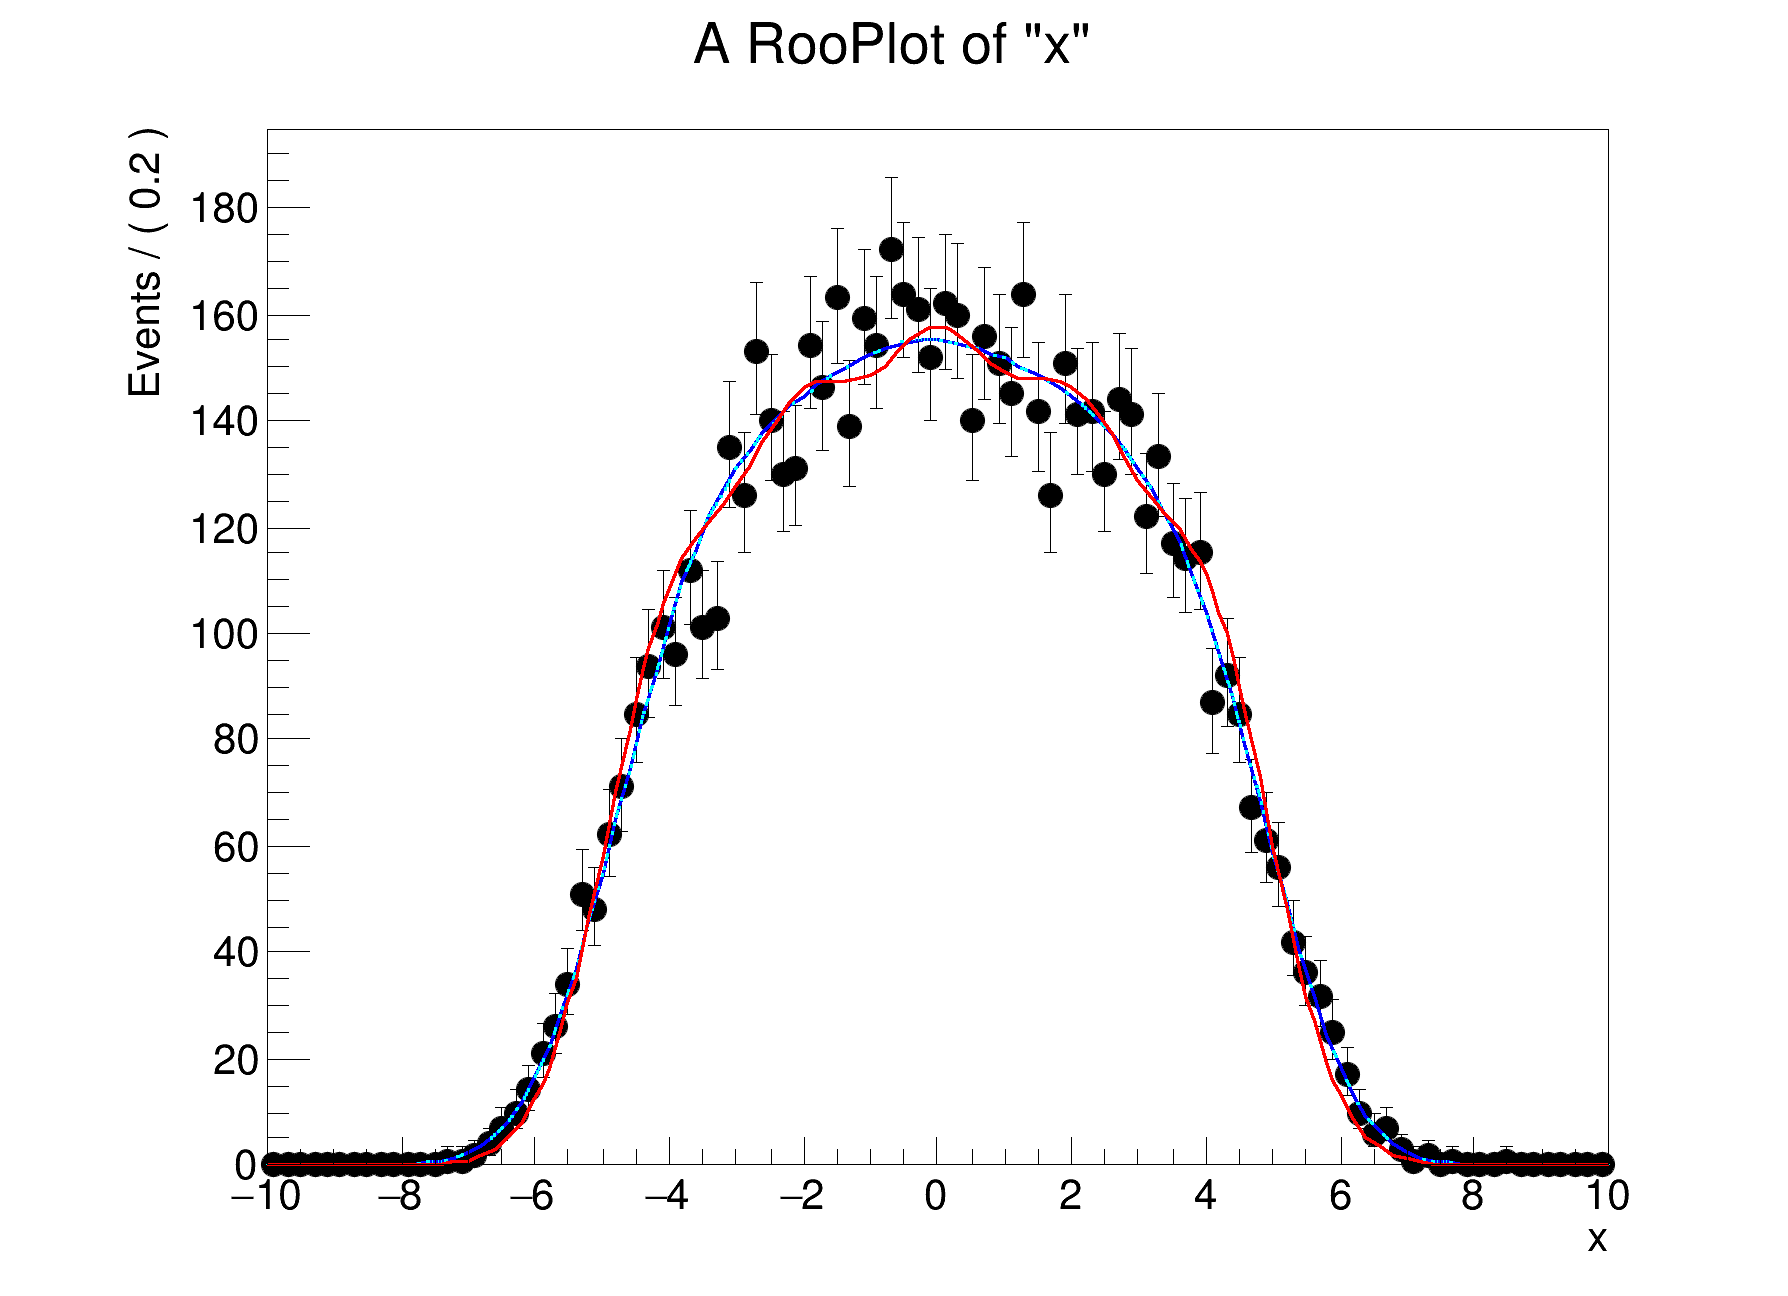
xframe = x.frame()
expDataXY.plotOn(xframe)
model.plotOn(xframe, ProjWData=expDataY)
binnedDataY = expDataY.binnedClone()
model.plotOn(xframe, ProjWData=binnedDataY, LineColor="c", LineStyle=":")
(expDataY.get().find("y")).setBins(5)
binnedDataY2 = expDataY.binnedClone()
model.plotOn(xframe, ProjWData=binnedDataY2, LineColor="r")
c = ROOT.TCanvas("rf303_conditional", "rf303_conditional", 600, 460)
ROOT.gPad.SetLeftMargin(0.15)
xframe.GetYaxis().SetTitleOffset(1.2)
xframe.Draw()
c.SaveAs("rf303_conditional.png")
RooDataSet::modelData[x,y] = 6850 entries
[#1] INFO:Minimization -- RooAbsMinimizerFcn::setOptimizeConst: activating const optimization
[#1] INFO:Minimization -- RooAbsMinimizerFcn::setOptimizeConst: deactivating const optimization
[#1] INFO:Plotting -- RooAbsReal::plotOn(model) plot on x averages using data variables (y)
[#1] INFO:Fitting -- using CPU computation library compiled with -mavx2
[#1] INFO:Plotting -- RooAbsReal::plotOn(model) plot on x averages using data variables (y)
[#1] INFO:Plotting -- RooAbsReal::plotOn(model) plot on x averages using data variables (y)


