import ROOT
x = ROOT.RooRealVar("x", "x", -10, 10)
sigma = ROOT.RooRealVar("sigma", "sigma", 3, 0.1, 10)
mean = ROOT.RooRealVar("mean", "mean", -3, -10, 10)
gauss = ROOT.RooGaussian("gauss", "gauss", x, mean, sigma)
data = gauss.generate({x}, 100)
gauss.fitTo(data, PrintLevel=-1)
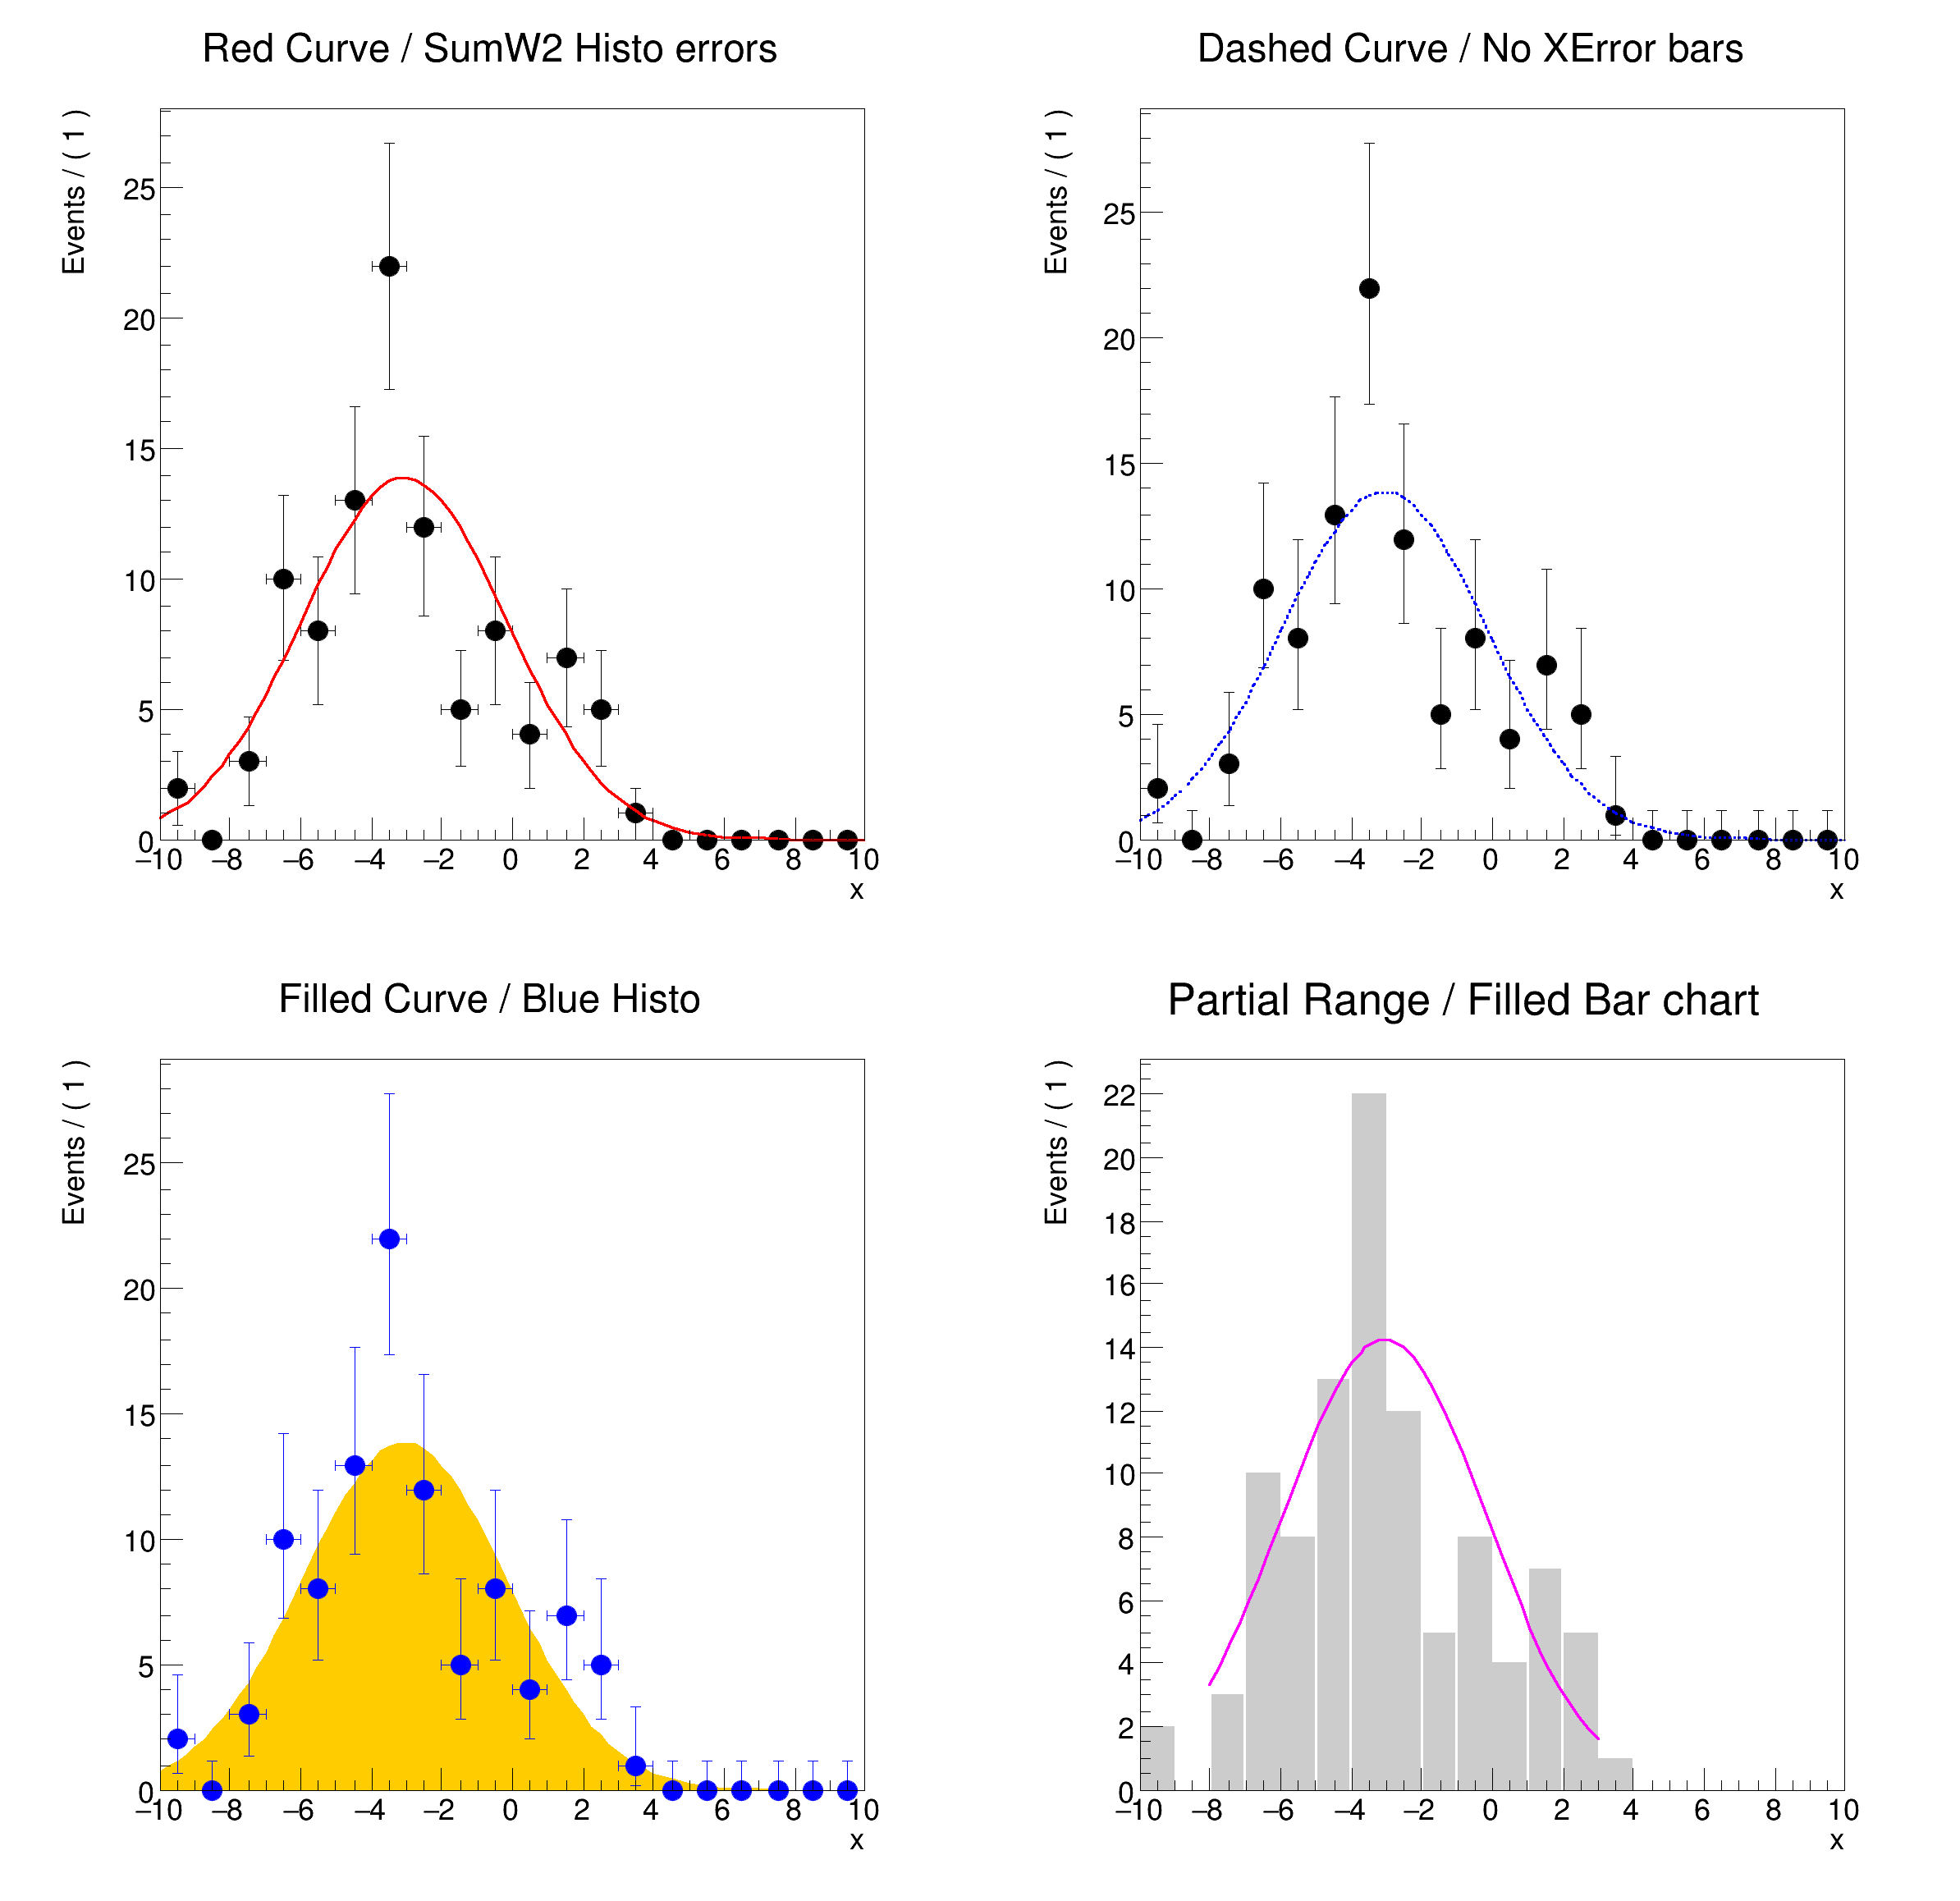
frame1 = x.frame(Name="xframe", Title="Red Curve / SumW2 Histo errors", Bins=20)
frame2 = x.frame(Name="xframe", Title="Dashed Curve / No XError bars", Bins=20)
frame3 = x.frame(Name="xframe", Title="Filled Curve / Blue Histo", Bins=20)
frame4 = x.frame(Name="xframe", Title="Partial Range / Filled Bar chart", Bins=20)
data.plotOn(frame1, DataError="SumW2")
data.plotOn(frame2, XErrorSize=0)
data.plotOn(frame3, MarkerColor="b", LineColor="b")
data.plotOn(frame4, DrawOption="B", DataError=None, XErrorSize=0, FillColor="kGray")
gauss.plotOn(frame1, LineColor="r")
gauss.plotOn(frame2, LineStyle="--")
gauss.plotOn(frame3, MoveToBack=True, DrawOption="F", FillColor="kOrange")
gauss.plotOn(frame4, Range=(-8, 3), LineColor="m")
c = ROOT.TCanvas("rf107_plotstyles", "rf107_plotstyles", 800, 800)
c.Divide(2, 2)
c.cd(1)
ROOT.gPad.SetLeftMargin(0.15)
frame1.GetYaxis().SetTitleOffset(1.6)
frame1.Draw()
c.cd(2)
ROOT.gPad.SetLeftMargin(0.15)
frame2.GetYaxis().SetTitleOffset(1.6)
frame2.Draw()
c.cd(3)
ROOT.gPad.SetLeftMargin(0.15)
frame3.GetYaxis().SetTitleOffset(1.6)
frame3.Draw()
c.cd(4)
ROOT.gPad.SetLeftMargin(0.15)
frame4.GetYaxis().SetTitleOffset(1.6)
frame4.Draw()
c.SaveAs("rf107_plotstyles.png")


