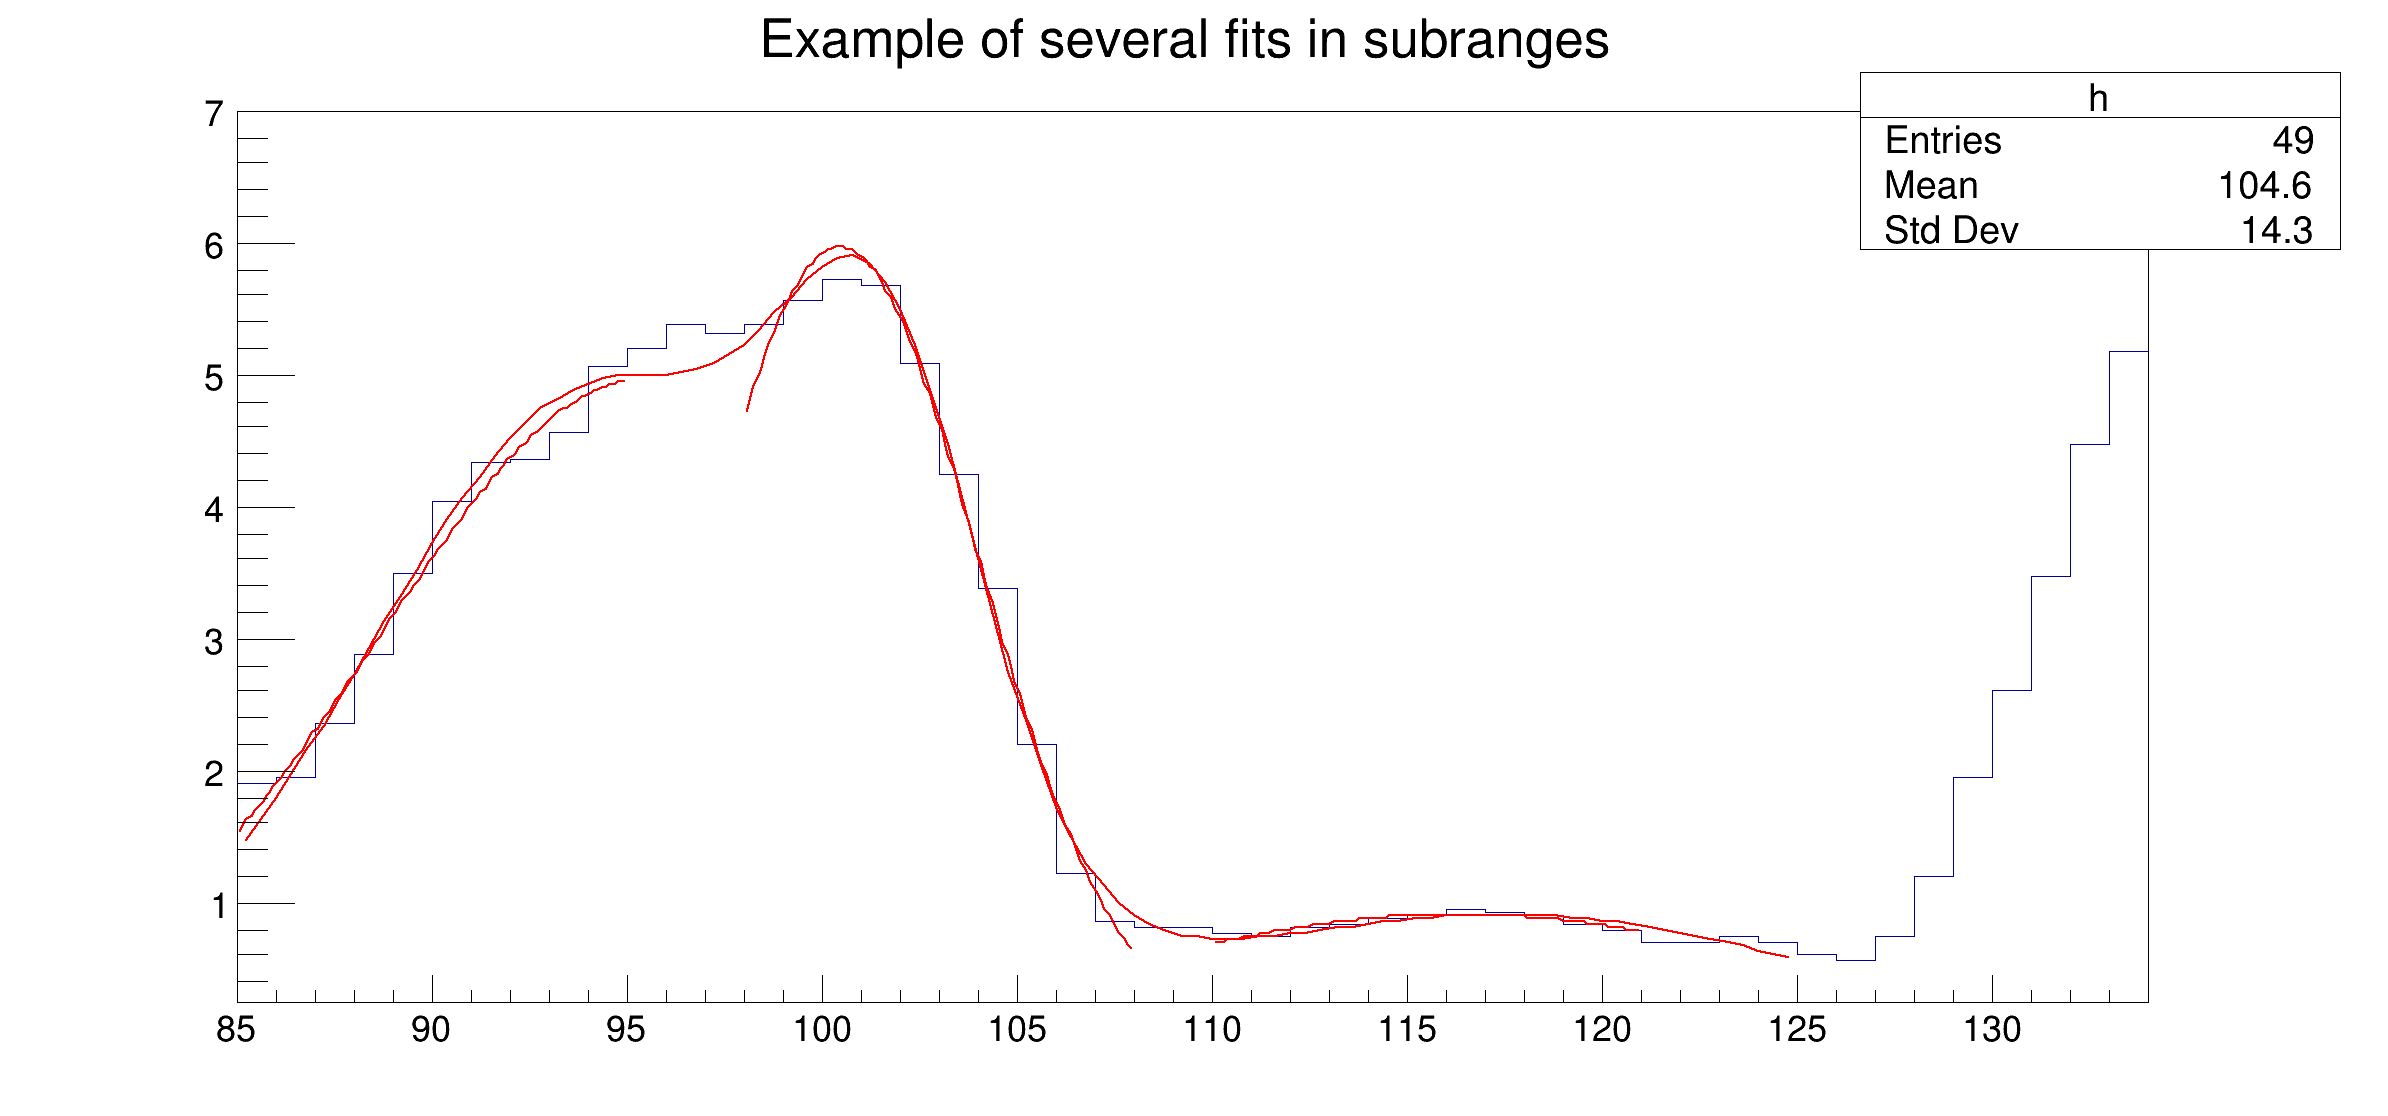

Fitting multiple functions to different ranges of a 1-D histogram Example showing how to fit in a sub-range of an histogram A histogram is created and filled with the bin contents and errors defined in the table below.
Three Gaussians are fitted in sub-ranges of this histogram. A new function (a sum of 3 Gaussians) is fitted on another subrange Note that when fitting simple functions, such as Gaussians, the initial values of parameters are automatically computed by ROOT. In the more complicated case of the sum of 3 Gaussians, the initial values of parameters must be given. In this particular case, the initial values are taken from the result of the individual fits.

****************************************
Minimizer is Minuit2 / Migrad
Chi2 = 0.0848003
NDf = 7
Edm = 8.86911e-08
NCalls = 106
Constant = 4.96664 +/- 2.83221
Mean = 95.4663 +/- 12.3905
Sigma = 6.82779 +/- 7.49131 (limited)
****************************************
Minimizer is Minuit2 / Migrad
Chi2 = 0.0771026
NDf = 7
Edm = 1.00182e-07
NCalls = 73
Constant = 5.96312 +/- 1.14355
Mean = 100.467 +/- 1.53372
Sigma = 3.54806 +/- 1.16899 (limited)
****************************************
Minimizer is Minuit2 / Migrad
Chi2 = 0.00877492
NDf = 8
Edm = 4.98832e-06
NCalls = 87
Constant = 0.912053 +/- 0.435309
Mean = 116.304 +/- 8.32344
Sigma = 8.38103 +/- 18.5139 (limited)
****************************************
Minimizer is Minuit2 / Migrad
Chi2 = 0.31282
NDf = 31
Edm = 3.25006e-06
NCalls = 495
p0 = 4.91052 +/- 1.41324
p1 = 94.4492 +/- 3.71244
p2 = 5.9461 +/- 2.41662
p3 = 3.22456 +/- 3.11384
p4 = 101.662 +/- 1.67862
p5 = 2.48631 +/- 1.91151
p6 = 0.911626 +/- 0.368736
p7 = 117.581 +/- 5.06092
p8 = 7.59194 +/- 8.78217
[ 4.96663958 95.46632975 6.8277931 5.9631179 100.46745499
3.54806038 0.91205321 116.30403822 8.3810307 ]
import ROOT
import numpy as np
n_x = 49
x = np.array( [ 1.913521, 1.953769, 2.347435, 2.883654, 3.493567, 4.047560,
4.337210, 4.364347, 4.563004, 5.054247, 5.194183, 5.380521, 5.303213,
5.384578, 5.563983, 5.728500, 5.685752, 5.080029, 4.251809, 3.372246,
2.207432, 1.227541, 0.8597788, 0.8220503, 0.8046592, 0.7684097, 0.7469761,
0.8019787, 0.8362375, 0.8744895, 0.9143721, 0.9462768, 0.9285364,
0.8954604, 0.8410891, 0.7853871, 0.7100883, 0.6938808, 0.7363682,
0.7032954, 0.6029015, 0.5600163, 0.7477068, 1.188785, 1.938228, 2.602717,
3.472962, 4.465014, 5.177035, ], dtype=np.float32,)
h = ROOT.TH1F("h", "Example of several fits in subranges", n_x, 85, 134)
h.SetMaximum(7)
for i, x_i in enumerate(x):
h.SetBinContent(i + 1, x[i])
par = np.zeros(9)
g1 = ROOT.TF1("g1", "gaus", 85, 95)
g2 = ROOT.TF1("g2", "gaus", 98, 108)
g3 = ROOT.TF1("g3", "gaus", 110, 121)
total = ROOT.TF1("total", "gaus(0)+gaus(3)+gaus(6)", 85, 125)
total.SetLineColor(2)
c = ROOT.TCanvas("multifit", "multifit", 800, 400)
h.Fit(g1, "R")
h.Fit(g2, "R+")
h.Fit(g3, "+", "", 110, 121);
g1.GetParameters(par[:3])
g2.GetParameters(par[3:6])
g3.GetParameters(par[6:])
print(par)
total.SetParameters(par)
h.Draw()
h.Fit(total, "R+")
c.SaveAs("multifit.png")
- Authors
- Jonas Rembser, Rene Brun (C++ version)
Definition in file multifit.py.


