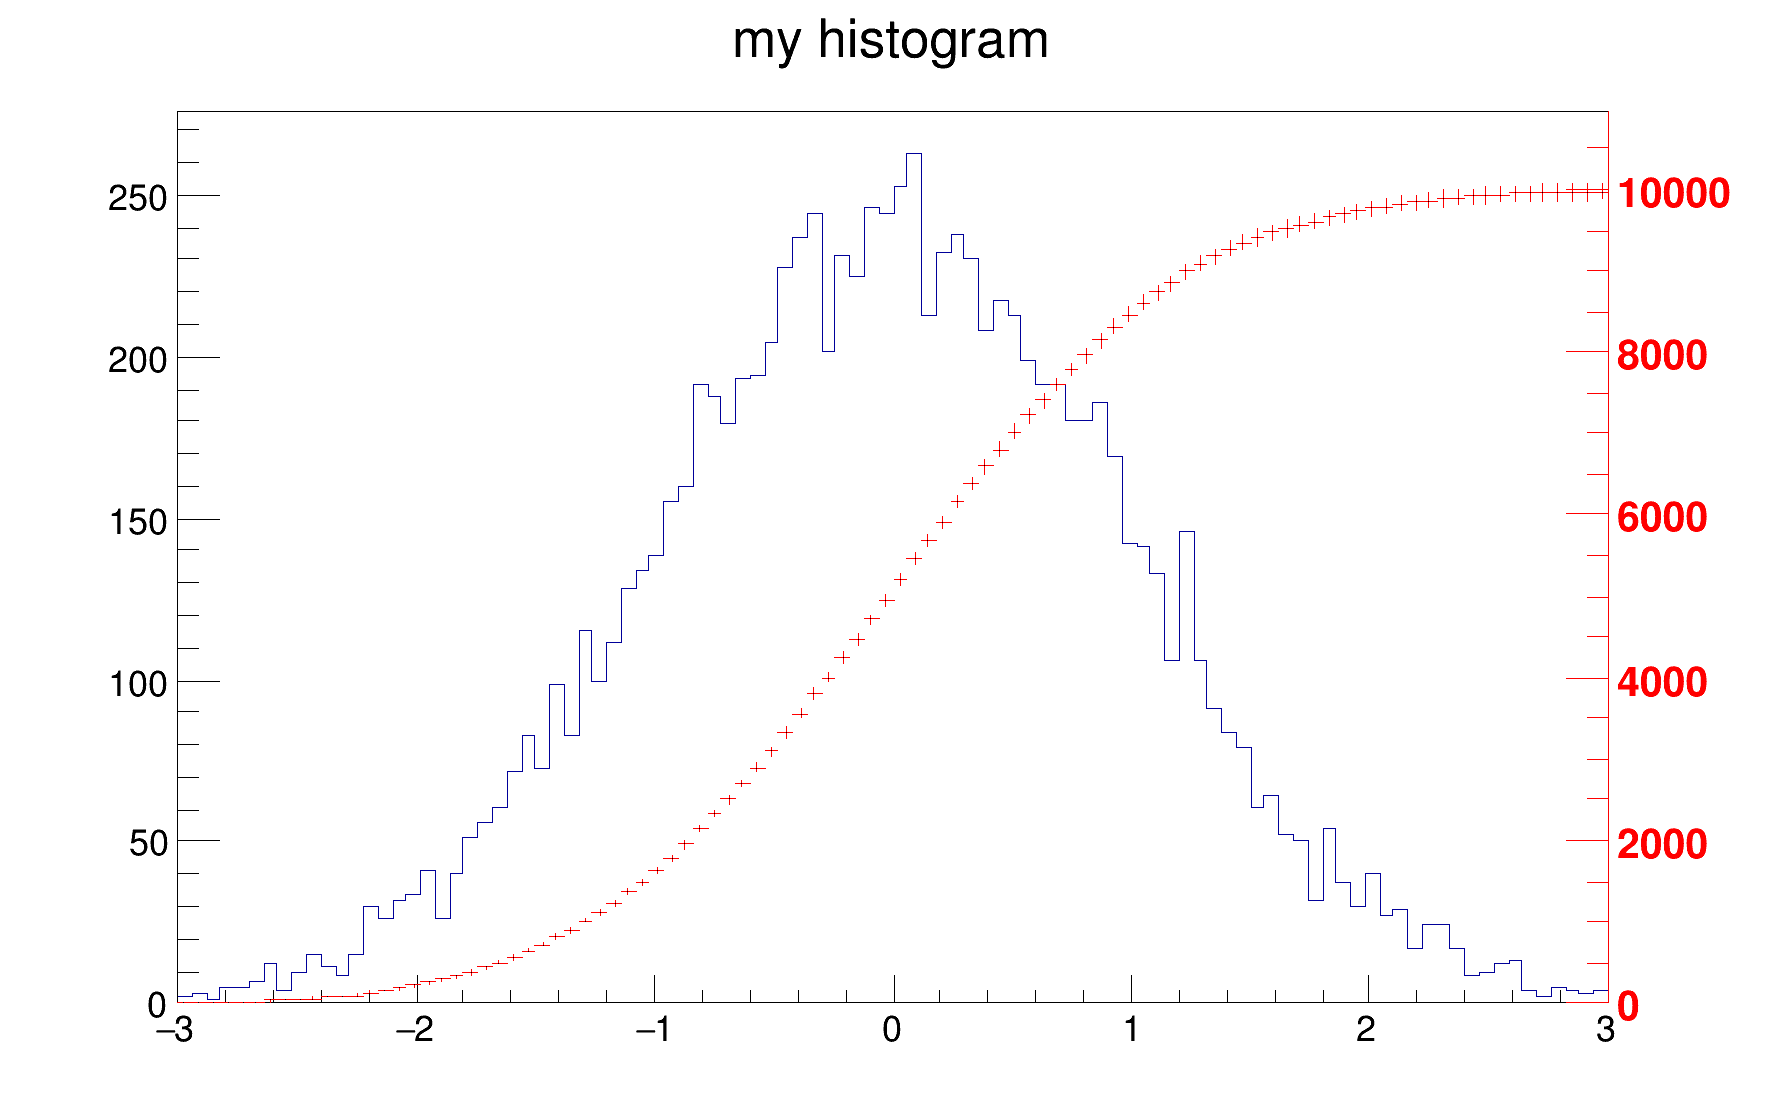

Example of macro illustrating how to superimpose two histograms with different scales in the "same" pad.
Inspired by work of Rene Brun.
import ROOT
c1 = ROOT.TCanvas("c1","hists with different scales",600,400)
ROOT.gStyle.SetOptStat(False)
h1 = ROOT.TH1F("h1","my histogram",100,-3,3)
for i in range(10000) :
h1.Fill(ROOT.gRandom.Gaus(0,1))
h1.Draw()
c1.Update()
hint1 = ROOT.TH1F("hint1","h1 bins integral",100,-3,3)
sum = 0
for i in range(1,101) :
sum += h1.GetBinContent(i)
hint1.SetBinContent(i,sum)
rightmax = 1.1*hint1.GetMaximum()
scale = ROOT.gPad.GetUymax()/rightmax
hint1.SetLineColor(ROOT.kRed)
hint1.Scale(scale)
hint1.Draw("same")
axis = ROOT.TGaxis(ROOT.gPad.GetUxmax(),ROOT.gPad.GetUymin(),
ROOT.gPad.GetUxmax(), ROOT.gPad.GetUymax(),0,rightmax,510,"+L")
axis.SetLineColor(ROOT.kRed)
axis.SetLabelColor(ROOT.kRed)
axis.Draw()
- Author
- Alberto Ferro
Definition in file twoscales.py.