

Data and categories: tools for manipulation of (un)binned datasets
from __future__ import print_function
import ROOT
import math
x = ROOT.RooRealVar("x", "x", -10, 10)
y = ROOT.RooRealVar("y", "y", 0, 40)
c = ROOT.RooCategory("c", "c")
c.defineType("Plus", +1)
c.defineType("Minus", -1)
d = ROOT.RooDataSet("d", "d", {x, y, c})
for i in range(1000):
x.setVal(i / 50 - 10)
y.setVal(math.sqrt(1.0 * i))
if i % 2:
c.setLabel("Plus")
else:
c.setLabel("Minus")
if i < 3:
print(x, y, c)
d.add({x, y, c})
d.Print("v")
print("")
row = d.get()
row.Print("v")
print("")
d.get(900).Print("v")
print("")
print("\n >> d1 has only columns x,c")
d1 = d.reduce({x, c})
d1.Print("v")
print("\n >> d2 has only column y")
d2 = d.reduce({y})
d2.Print("v")
print("\n >> d3 has only the points with y>5.17")
d3 = d.reduce("y>5.17")
d3.Print("v")
print("\n >> d4 has only columns x, for data points with y>5.17")
d4 = d.reduce({x, c}, "y>5.17")
d4.Print("v")
print("\n >> merge d2(y) with d1(x,c) to form d1(x,c,y)")
d1.merge(d2)
d1.Print("v")
print("\n >> append data points of d3 to d1")
d1.append(d3)
d1.Print("v")
print(">> construct dh (binned) from d(unbinned) but only take the x and y dimensions, ")
print(">> the category 'c' will be projected in the filling process")
x.setBins(10)
y.setBins(10)
dh = ROOT.RooDataHist("dh", "binned version of d", {x, y}, d)
dh.Print("v")
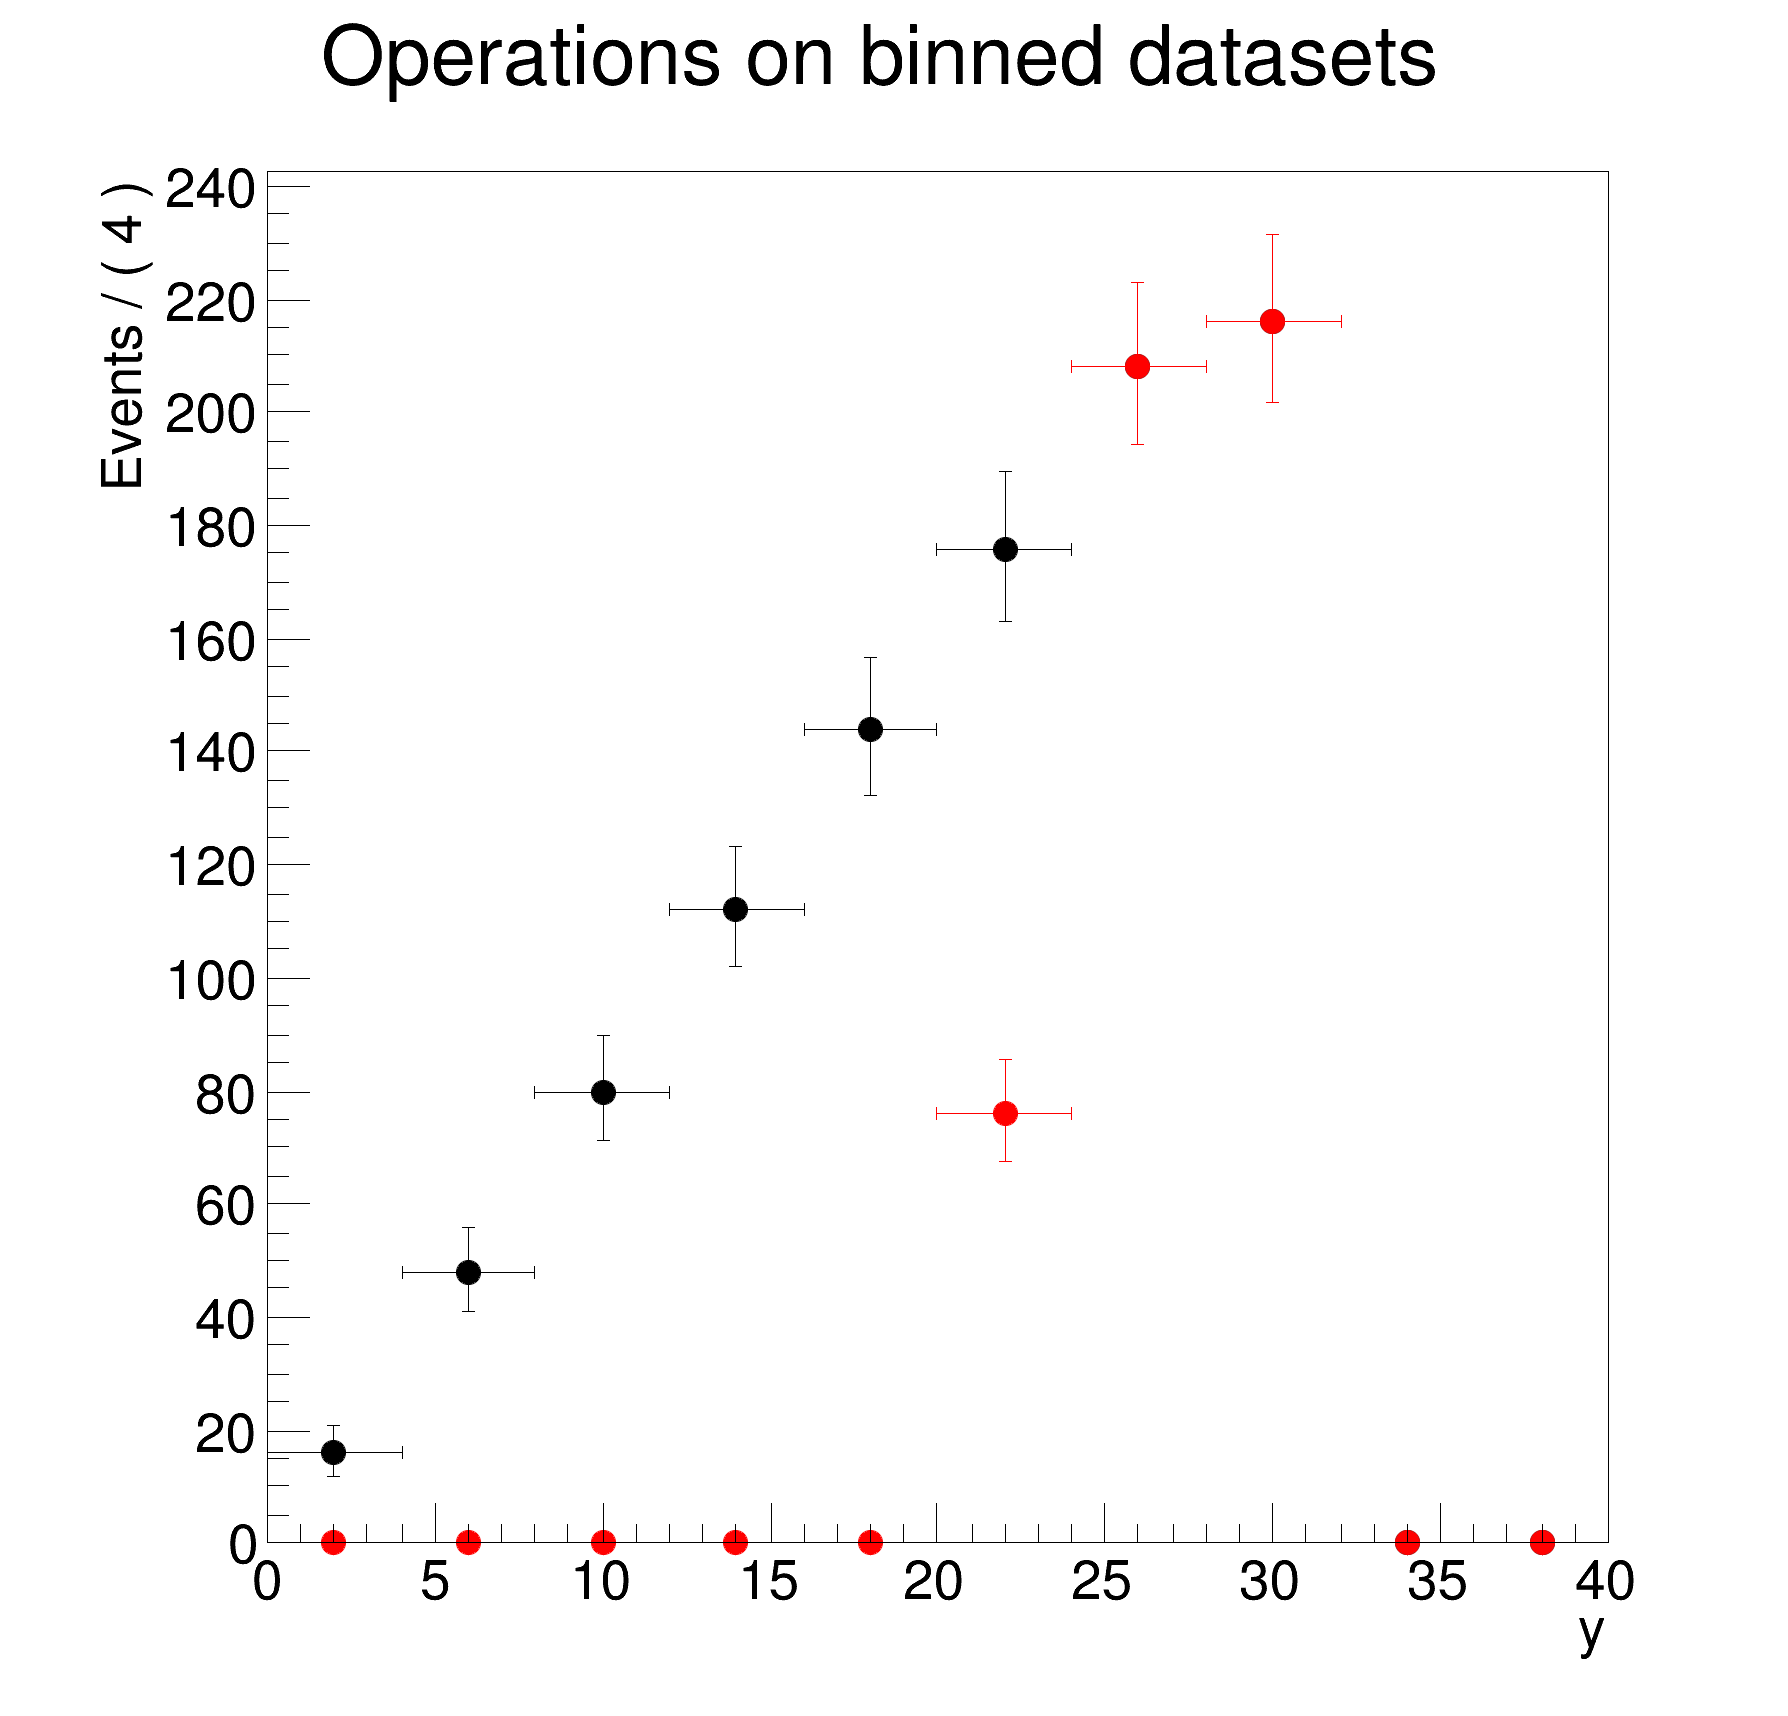
yframe = y.frame(Bins=10, Title="Operations on binned datasets")
dh.plotOn(yframe)
print(">> number of bins in dh : ", dh.numEntries())
print(">> sum of weights in dh : ", dh.sum(False))
print(">> integral over histogram: ", dh.sum(True))
x.setVal(0.3)
y.setVal(20.5)
print(">> retrieving the properties of the bin enclosing coordinate (x,y) = (0.3,20.5) bin center:")
dh.get({x, y}).Print("v")
print(" weight = ", dh.weight())
print(">> Creating 1-dimensional projection on y of dh for bins with x>0")
dh2 = dh.reduce({y}, "x>0")
dh2.Print("v")
dh2.plotOn(yframe, LineColor="r", MarkerColor="r")
print("\n >> Persisting d via ROOT I/O")
f = ROOT.TFile("rf402_datahandling.root", "RECREATE")
d.Write()
f.ls()
c = ROOT.TCanvas("rf402_datahandling", "rf402_datahandling", 600, 600)
ROOT.gPad.SetLeftMargin(0.15)
yframe.GetYaxis().SetTitleOffset(1.4)
yframe.Draw()
c.SaveAs("rf402_datahandling.png")
Option_t Option_t TPoint TPoint const char GetTextMagnitude GetFillStyle GetLineColor GetLineWidth GetMarkerStyle GetTextAlign GetTextColor GetTextSize void char Point_t Rectangle_t WindowAttributes_t Float_t Float_t Float_t Int_t Int_t UInt_t UInt_t Rectangle_t Int_t Int_t Window_t TString Int_t GCValues_t GetPrimarySelectionOwner GetDisplay GetScreen GetColormap GetNativeEvent const char const char dpyName wid window const char font_name cursor keysym reg const char only_if_exist regb h Point_t winding char text const char depth char const char Int_t count const char ColorStruct_t color const char Pixmap_t Pixmap_t PictureAttributes_t attr const char char ret_data h unsigned char height h Atom_t Int_t ULong_t ULong_t unsigned char prop_list Atom_t Atom_t Atom_t Time_t type
DataStore d (d)
Contains 1000 entries
Observables:
1) x = 9.98 L(-10 - 10) "x"
2) c = Plus(idx = 1)
"c"
3) y = 31.607 L(0 - 40) "y"
1) 0x78d4c60 RooRealVar:: x = 9.98 L(-10 - 10) "x"
2) 0x7b70150 RooCategory:: c = Plus(idx = 1)
"c"
3) 0x7c19940 RooRealVar:: y = 31.607 L(0 - 40) "y"
1) 0x78d4c60 RooRealVar:: x = 8 L(-10 - 10) "x"
2) 0x7b70150 RooCategory:: c = Minus(idx = -1)
"c"
3) 0x7c19940 RooRealVar:: y = 30 L(0 - 40) "y"
DataStore d (d)
Contains 1000 entries
Observables:
1) x = 9.98 L(-10 - 10) "x"
2) c = Plus(idx = 1)
"c"
DataStore d (d)
Contains 1000 entries
Observables:
1) y = 31.607 L(0 - 40) "y"
[#1] INFO:InputArguments -- The formula y>5.17 claims to use the variables (x,c,y) but only (y) seem to be in use.
inputs: y>5.17
DataStore d (d)
Contains 973 entries
Observables:
1) x = 9.98 L(-10 - 10) "x"
2) c = Plus(idx = 1)
"c"
3) y = 31.607 L(0 - 40) "y"
DataStore d (d)
Contains 973 entries
Observables:
1) x = 9.98 L(-10 - 10) "x"
2) c = Plus(idx = 1)
"c"
DataStore d (d)
Contains 1000 entries
Observables:
1) x = 9.98 L(-10 - 10) "x"
2) c = Plus(idx = 1)
"c"
3) y = 31.607 L(0 - 40) "y"
DataStore d (d)
Contains 1973 entries
Observables:
1) x = 9.98 L(-10 - 10) "x"
2) c = Plus(idx = 1)
"c"
3) y = 31.607 L(0 - 40) "y"
DataStore dh (binned version of d)
Contains 100 entries
Observables:
1) x = 9 L(-10 - 10) B(10) "x"
2) y = 38 L(0 - 40) B(10) "y"
Binned Dataset dh (binned version of d)
Contains 100 bins with a total weight of 1000
Observables: 1) x = 9 L(-10 - 10) B(10) "x"
2) y = 38 L(0 - 40) B(10) "y"
1) 0x82968b0 RooRealVar:: x = 1 L(-10 - 10) B(10) "x"
2) 0x830f6c0 RooRealVar:: y = 22 L(0 - 40) B(10) "y"
DataStore dh (binned version of d)
Contains 10 entries
Observables:
1) y = 38 L(0 - 40) B(10) "y"
Binned Dataset dh (binned version of d)
Contains 10 bins with a total weight of 500
Observables: 1) y = 38 L(0 - 40) B(10) "y"
[#1] INFO:Plotting -- RooPlot::updateFitRangeNorm: New event count of 500 will supercede previous event count of 1000 for normalization of PDF projections
TFile** rf402_datahandling.root
TFile* rf402_datahandling.root
KEY: RooDataSet d;1 d
KEY: TProcessID ProcessID0;1 6bac1aac-91a3-11ef-9192-942c8a89beef
RooRealVar::x = -10 L(-10 - 10)
RooRealVar::y = 0 L(0 - 40)
{ {"Minus" , -1}, {"Plus" , 1} }
<class cppyy.gbl.RooRealVar at 0x7629cd0>
RooRealVar::x = -9.98 L(-10 - 10)
RooRealVar::y = 1 L(0 - 40)
{ {"Minus" , -1}, {"Plus" , 1} }
<class cppyy.gbl.RooRealVar at 0x7629cd0>
RooRealVar::x = -9.96 L(-10 - 10)
RooRealVar::y = 1.41421 L(0 - 40)
{ {"Minus" , -1}, {"Plus" , 1} }
<class cppyy.gbl.RooRealVar at 0x7629cd0>
>> d1 has only columns x,c
>> d2 has only column y
>> d3 has only the points with y>5.17
>> d4 has only columns x, for data points with y>5.17
>> merge d2(y) with d1(x,c) to form d1(x,c,y)
>> append data points of d3 to d1
>> construct dh (binned) from d(unbinned) but only take the x and y dimensions,
>> the category 'c' will be projected in the filling process
>> number of bins in dh : 100
>> sum of weights in dh : 1000.0
>> integral over histogram: 8000.0
>> retrieving the properties of the bin enclosing coordinate (x,y) = (0.3,20.5) bin center:
weight = 76.0
>> Creating 1-dimensional projection on y of dh for bins with x>0
>> Persisting d via ROOT I/O
- Date
- February 2018
- Authors
- Clemens Lange, Wouter Verkerke (C++ version)
Definition in file rf402_datahandling.py.