

Simple example illustrating how to use the C++ interpreter
from ROOT import TCanvas, TH1F, TSlider
from ROOT import gROOT, gBenchmark, gRandom
c1 =
TCanvas(
'c1',
'The HSUM example', 200, 10, 600, 400 )
c1.SetGrid();
gBenchmark.Start( 'hsum' )
total =
TH1F(
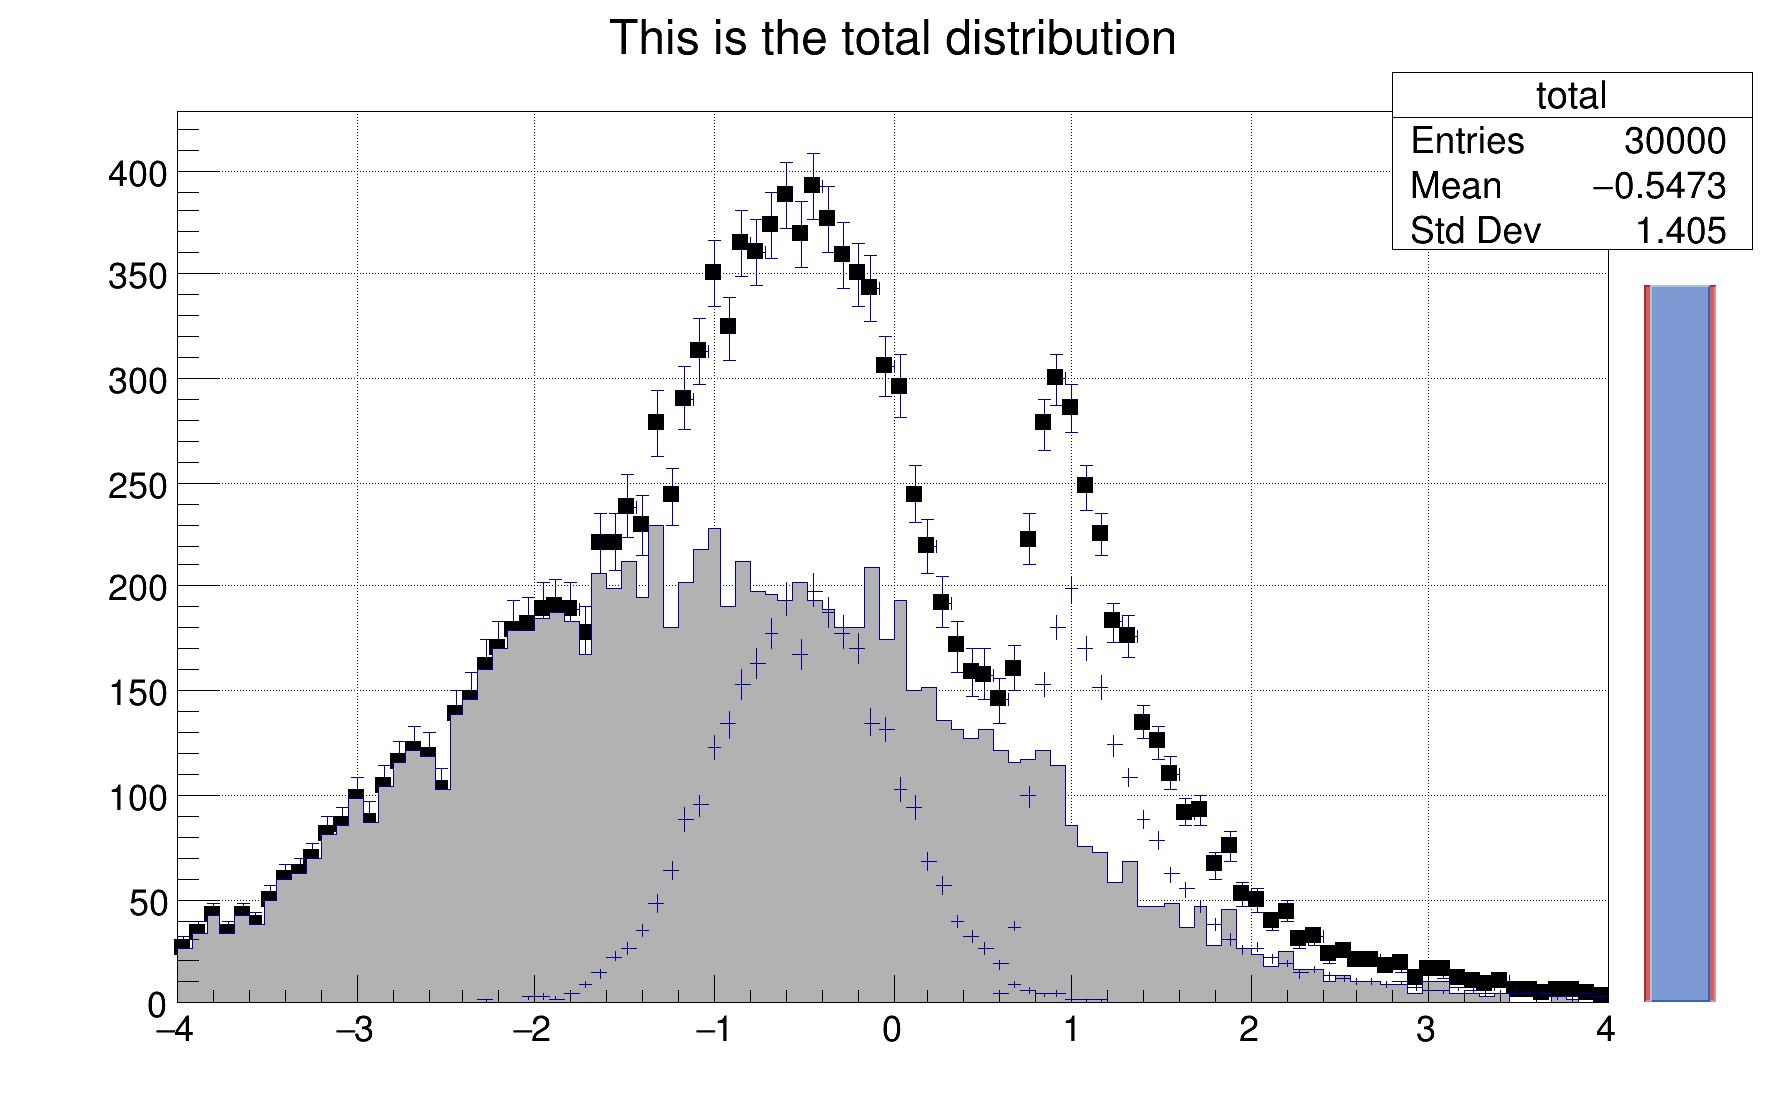
'total',
'This is the total distribution', 100, -4, 4 )
main =
TH1F(
'main',
'Main contributor', 100, -4, 4 )
s1 =
TH1F(
's1',
'This is the first signal', 100, -4, 4 )
s2 =
TH1F(
's2',
'This is the second signal', 100, -4, 4 )
total.Sumw2()
total.SetMarkerStyle( 21 )
total.SetMarkerSize( 0.7 )
main.SetFillColor( 16 )
s1.SetFillColor( 42 )
s2.SetFillColor( 46 )
gRandom.SetSeed()
gauss, landau = gRandom.Gaus, gRandom.Landau
histos = [ 'total', 'main', 's1', 's2' ]
for name in histos:
exec('%sFill = %s.Fill' % (name,name))
kUPDATE = 500
for i in range( 10000 ):
xmain = gauss( -1, 1.5 )
xs1 = gauss( -0.5, 0.5 )
xs2 = landau( 1, 0.15 )
mainFill( xmain )
s1Fill( xs1, 0.3 )
s2Fill( xs2, 0.2 )
totalFill( xmain )
totalFill( xs1, 0.3 )
totalFill( xs2, 0.2 )
if i and (i%kUPDATE) == 0 :
if i == kUPDATE :
total.Draw( 'e1p' )
main.Draw( 'same' )
s1.Draw( 'same' )
s2.Draw( 'same' )
c1.Update()
slider =
TSlider(
'slider',
'test', 4.2, 0, 4.6, total.GetMaximum(), 38 )
slider.SetFillColor( 46 )
if slider:
slider.SetRange( 0, float(i) / 10000. )
c1.Modified()
c1.Update()
for name in histos:
exec('del %sFill' % name)
del histos
slider.SetRange( 0, 1 )
total.Draw( 'sameaxis' )
c1.Modified()
c1.Update()
gBenchmark.Show( 'hsum' )
1-D histogram with a float per channel (see TH1 documentation)}
A specialized TPad including a TSliderBox object.
- Author
- Wim Lavrijsen
Definition in file hsum.py.