
 Plot the Amplitude of a Hydrogen Atom.
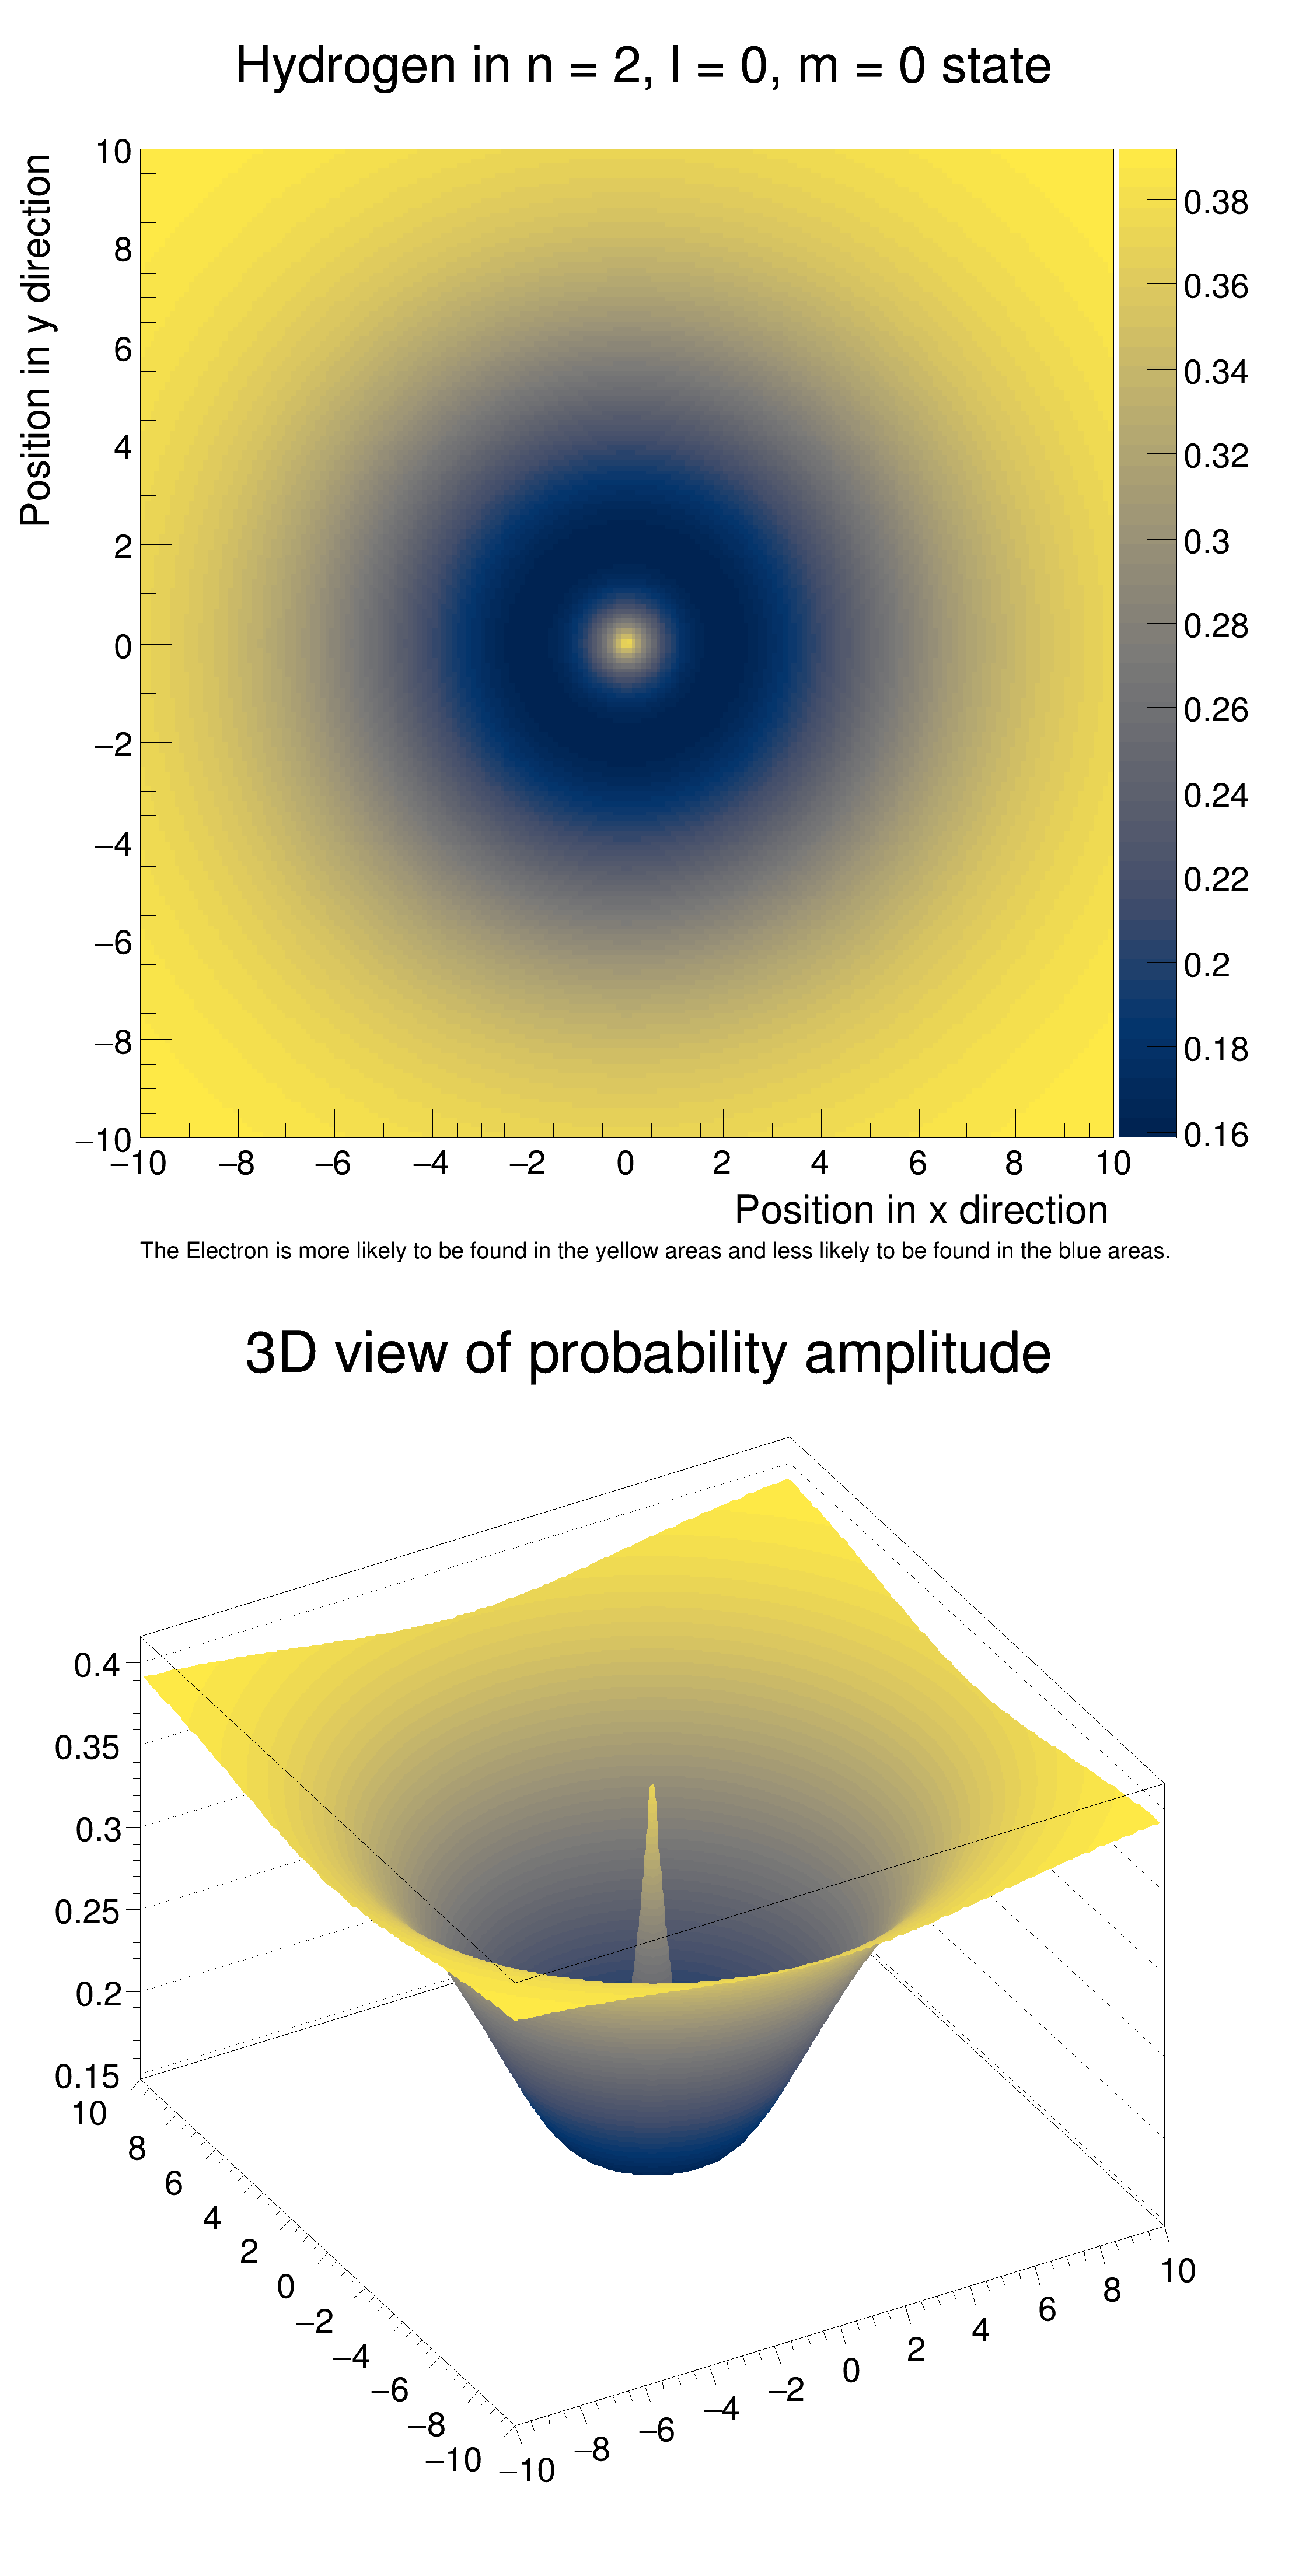
Visualize the Amplitude of a Hydrogen Atom in the n = 2, l = 0, m = 0 state. Demonstrates how TH2F can be used in Quantum Mechanics.
The formula for Hydrogen in this energy state is \( \psi_{200} = \frac{1}{4\sqrt{2\pi}a_0 ^{\frac{3}{2}}}(2-\frac{\sqrt{x^2+y^2}}{a_0})e^{-\frac{\sqrt{x^2+y^2}}{2a_0}} \)
#include <cmath>
double WaveFunction(
double x,
double y) {
double r = sqrt(
x *
x +
y*
y);
double w = (1/pow((4*sqrt(2*
TMath::Pi())* 1), 1.5)) * (2 - (
r / 1)*pow(
TMath::E(), (-1 *
r)/2));
return w*w;
}
void schroedinger_hydrogen() {
"Hydrogen in n = 2, l = 0, m = 0 state; Position in x direction; Position in y direction",
200, -10, 10, 200, -10, 10);
for (float i = -10; i < 10; i += 0.01) {
for (float j = -10; j < 10; j += 0.01) {
h2D->
Fill(i, j, WaveFunction(i, j));
}
}
c1_1->SetRightMargin(0.14);
TLatex *
l =
new TLatex(-10, -12.43,
"The Electron is more likely to be found in the yellow areas and less likely to be found in the blue areas.");
c1_2->SetTheta(42.);
h2Dc->
SetTitle(
"3D view of probability amplitude;;");
}
R__EXTERN TStyle * gStyle
virtual void SetLabelSize(Float_t size=0.04)
Set size of axis labels.
virtual void SetTitle(const char *title)
See GetStatOverflows for more information.
TAxis * GetXaxis()
Get the behaviour adopted by the object about the statoverflows. See EStatOverflows for more informat...
TObject * Clone(const char *newname=0) const
Make a complete copy of the underlying object.
virtual void SetContour(Int_t nlevels, const Double_t *levels=0)
Set the number and values of contour levels.
virtual void Draw(Option_t *option="")
Draw this histogram with options.
2-D histogram with a double per channel (see TH1 documentation)}
2-D histogram with a float per channel (see TH1 documentation)}
Int_t Fill(Double_t)
Invalid Fill method.
To draw Mathematical Formula.
void SetOptStat(Int_t stat=1)
The type of information printed in the histogram statistics box can be selected via the parameter mod...
void SetPalette(Int_t ncolors=kBird, Int_t *colors=0, Float_t alpha=1.)
See TColor::SetPalette.
constexpr Double_t E()
Base of natural log:
- Author
- Advait Dhingra
Definition in file schroedinger_hydrogen.C.