Loading [MathJax]/extensions/tex2jax.js
Logo ROOT  
Reference Guide
 
All Classes Namespaces Files Functions Variables Typedefs Enumerations Enumerator Properties Friends Macros Modules Pages
Loading...
Searching...
No Matches
ntuple1.C File Reference

Detailed Description

View in nbviewer Open in SWAN Simple tree analysis.

#include "TCanvas.h"
#include "TFile.h"
#include "TNtuple.h"
#include "TProfile.h"
#include "TBenchmark.h"
#include "TStyle.h"
#include "TPaveText.h"
#include "TFrame.h"
#include "TF1.h"
#include "TROOT.h"
#include "TSystem.h"
#include "TInterpreter.h"
void ntuple1() {
//just in case this script is executed multiple times
delete gROOT->GetListOfFiles()->FindObject("hsimple.root");
delete gROOT->GetListOfCanvases()->FindObject("c1");
gBenchmark->Start("ntuple1");
//
// Connect ROOT histogram/ntuple demonstration file
// generated by example $ROOTSYS/tutorials/hsimple.C.
TString dir = gROOT->GetTutorialDir();
dir.Append("/hsimple.C");
dir.ReplaceAll("/./","/");
if (gBenchmark->GetBench("hsimple") < 0) gInterpreter->LoadMacro(dir.Data());
TFile *f1 = (TFile*)gROOT->ProcessLineFast("hsimple(1)");
if (!f1) return;
//
// Create a canvas, with 4 pads
//
TCanvas *c1 = new TCanvas("c1","The Ntuple canvas",200,10,700,780);
TPad *pad1 = new TPad("pad1","This is pad1",0.02,0.52,0.48,0.98,21);
TPad *pad2 = new TPad("pad2","This is pad2",0.52,0.52,0.98,0.98,21);
TPad *pad3 = new TPad("pad3","This is pad3",0.02,0.02,0.48,0.48,21);
TPad *pad4 = new TPad("pad4","This is pad4",0.52,0.02,0.98,0.48,1);
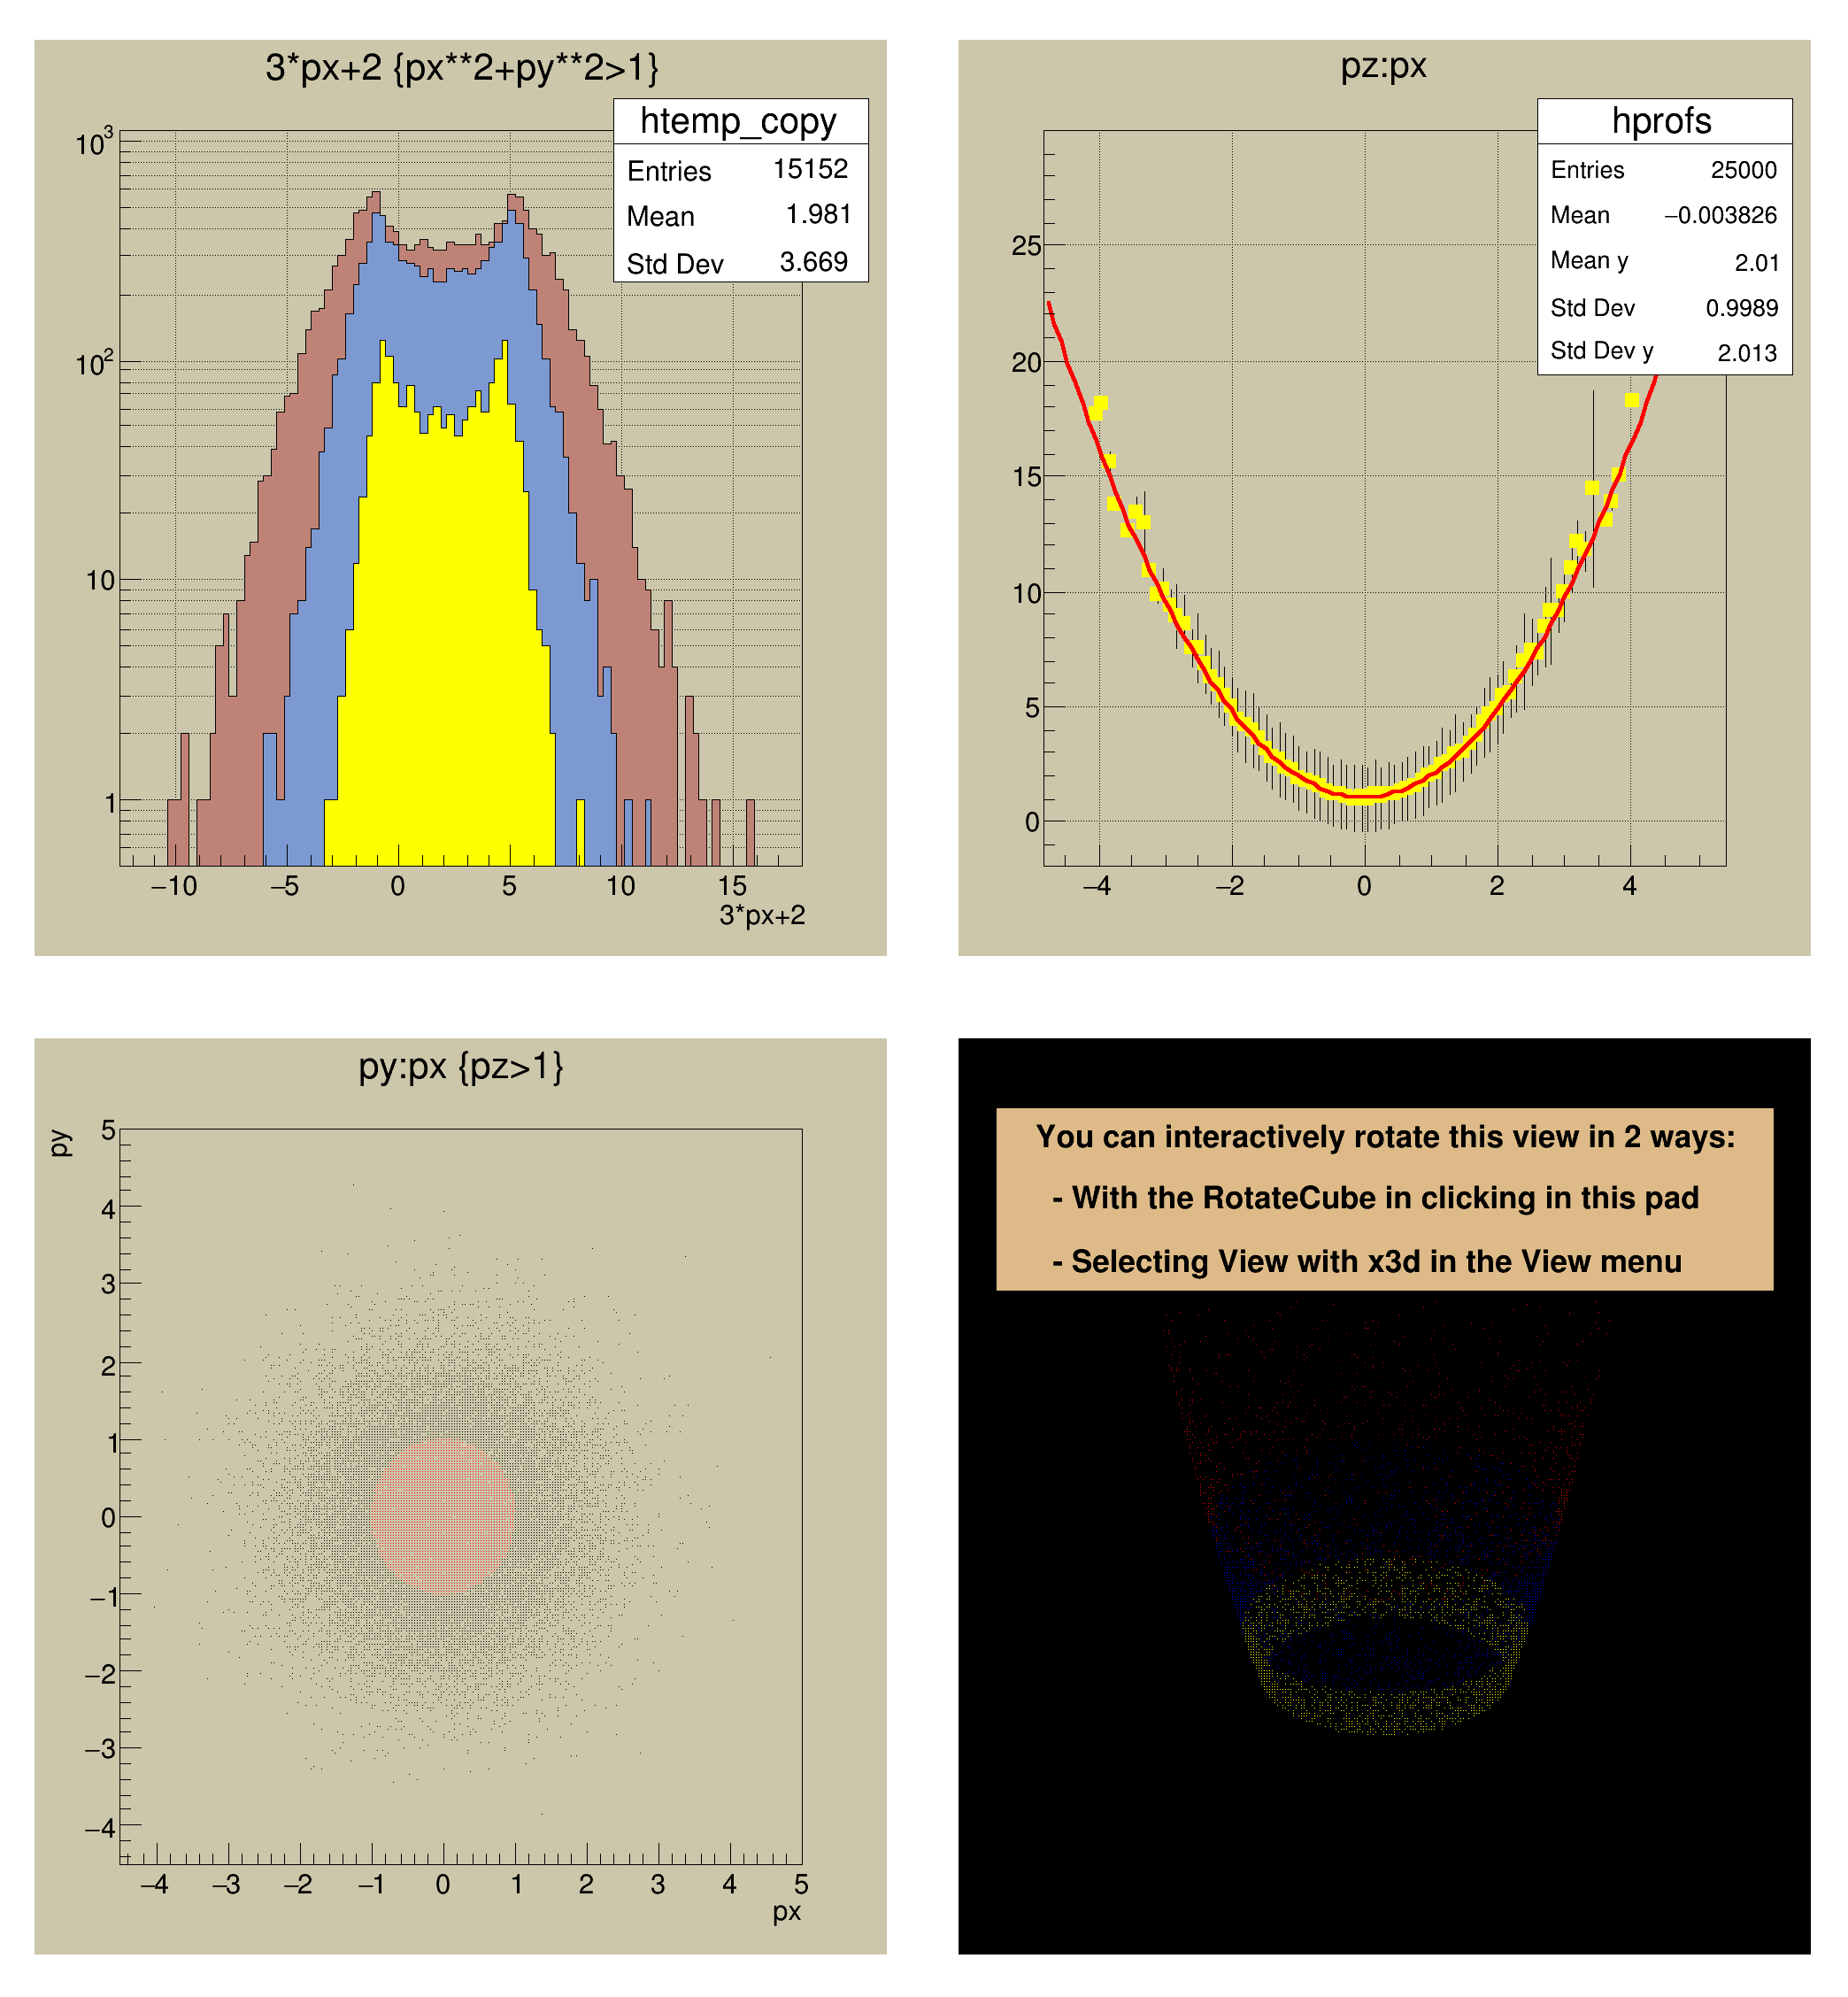
pad1->Draw();
pad2->Draw();
pad3->Draw();
pad4->Draw();
//
// Change default style for the statistics box
gStyle->SetStatW(0.30);
gStyle->SetStatH(0.20);
//
// Display a function of one ntuple column imposing a condition
// on another column.
pad1->cd();
pad1->SetGrid();
pad1->SetLogy();
TNtuple *ntuple = (TNtuple*)f1->Get("ntuple");
ntuple->SetLineColor(1);
ntuple->SetFillStyle(1001);
ntuple->SetFillColor(45);
ntuple->Draw("3*px+2","px**2+py**2>1");
ntuple->SetFillColor(38);
ntuple->Draw("2*px+2","pz>2","same");
ntuple->SetFillColor(5);
ntuple->Draw("1.3*px+2","(px^2+py^2>4) && py>0","same");
pad1->RedrawAxis();
//
// Display the profile of two columns
// The profile histogram produced is saved in the current directory with
// the name hprofs
pad2->cd();
pad2->SetGrid();
ntuple->Draw("pz:px>>hprofs","","goffprofs");
TProfile *hprofs = (TProfile*)gDirectory->Get("hprofs");
hprofs->SetMarkerColor(5);
hprofs->SetMarkerSize(0.7);
hprofs->SetMarkerStyle(21);
hprofs->Fit("pol2");
// Get pointer to fitted function and modify its attributes
TF1 *fpol2 = hprofs->GetFunction("pol2");
fpol2->SetLineWidth(4);
fpol2->SetLineColor(2);
//
// Display a scatter plot of two columns with a selection.
// Superimpose the result of another cut with a different marker color
pad3->cd();
pad3->GetFrame()->SetBorderSize(8);
ntuple->SetMarkerColor(1);
ntuple->Draw("py:px","pz>1");
ntuple->SetMarkerColor(2);
ntuple->Draw("py:px","pz<1","same");
//
// Display a 3-D scatter plot of 3 columns. Superimpose a different selection.
pad4->cd();
ntuple->Draw("pz:py:px","(pz<10 && pz>6)+(pz<4 && pz>3)");
ntuple->SetMarkerColor(4);
ntuple->Draw("pz:py:px","pz<6 && pz>4","same");
ntuple->SetMarkerColor(5);
ntuple->Draw("pz:py:px","pz<4 && pz>3","same");
TPaveText *l4 = new TPaveText(-0.9,0.5,0.9,0.95);
l4->SetFillColor(42);
l4->SetTextAlign(12);
l4->AddText("You can interactively rotate this view in 2 ways:");
l4->AddText(" - With the RotateCube in clicking in this pad");
l4->AddText(" - Selecting View with x3d in the View menu");
l4->Draw();
//
c1->cd();
c1->Update();
gBenchmark->Show("ntuple1");
}
R__EXTERN TBenchmark * gBenchmark
Definition TBenchmark.h:59
#define gDirectory
Definition TDirectory.h:385
#define gInterpreter
#define gROOT
Definition TROOT.h:404
R__EXTERN TStyle * gStyle
Definition TStyle.h:413
virtual void SetFillColor(Color_t fcolor)
Set the fill area color.
Definition TAttFill.h:37
virtual void SetFillStyle(Style_t fstyle)
Set the fill area style.
Definition TAttFill.h:39
virtual void SetLineWidth(Width_t lwidth)
Set the line width.
Definition TAttLine.h:43
virtual void SetLineColor(Color_t lcolor)
Set the line color.
Definition TAttLine.h:40
virtual void SetMarkerColor(Color_t mcolor=1)
Set the marker color.
Definition TAttMarker.h:38
virtual void SetMarkerStyle(Style_t mstyle=1)
Set the marker style.
Definition TAttMarker.h:40
virtual void SetMarkerSize(Size_t msize=1)
Set the marker size.
Definition TAttMarker.h:41
virtual void SetTextAlign(Short_t align=11)
Set the text alignment.
Definition TAttText.h:42
Int_t GetBench(const char *name) const
Returns index of Benchmark name.
virtual void Start(const char *name)
Starts Benchmark with the specified name.
virtual void Show(const char *name)
Stops Benchmark name and Prints results.
The Canvas class.
Definition TCanvas.h:23
1-Dim function class
Definition TF1.h:213
A ROOT file is a suite of consecutive data records (TKey instances) with a well defined format.
Definition TFile.h:54
virtual TFitResultPtr Fit(const char *formula, Option_t *option="", Option_t *goption="", Double_t xmin=0, Double_t xmax=0)
Fit histogram with function fname.
Definition TH1.cxx:3893
virtual TF1 * GetFunction(const char *name) const
Return pointer to function with name.
Definition TH1.cxx:8881
A simple TTree restricted to a list of float variables only.
Definition TNtuple.h:28
The most important graphics class in the ROOT system.
Definition TPad.h:26
void SetGrid(Int_t valuex=1, Int_t valuey=1) override
Definition TPad.h:326
void SetLogy(Int_t value=1) override
Set Lin/Log scale for Y.
Definition TPad.cxx:5967
void RedrawAxis(Option_t *option="") override
Redraw the frame axis.
Definition TPad.cxx:5313
TVirtualPad * cd(Int_t subpadnumber=0) override
Set Current pad.
Definition TPad.cxx:604
TFrame * GetFrame() override
Get frame.
Definition TPad.cxx:2866
void Draw(Option_t *option="") override
Draw Pad in Current pad (re-parent pad if necessary).
Definition TPad.cxx:1300
A Pave (see TPave) with text, lines or/and boxes inside.
Definition TPaveText.h:21
virtual TText * AddText(Double_t x1, Double_t y1, const char *label)
Add a new Text line to this pavetext at given coordinates.
virtual void Draw(Option_t *option="")
Draw this pavetext with its current attributes.
Profile Histogram.
Definition TProfile.h:32
Basic string class.
Definition TString.h:136
const char * Data() const
Definition TString.h:369
TString & ReplaceAll(const TString &s1, const TString &s2)
Definition TString.h:692
TString & Append(const char *cs)
Definition TString.h:564
void SetStatH(Float_t h=0.1)
Definition TStyle.h:383
void SetStatColor(Color_t color=19)
Definition TStyle.h:373
void SetStatW(Float_t w=0.19)
Definition TStyle.h:382
virtual void Draw(Option_t *opt)
Default Draw method for all objects.
Definition TTree.h:428
virtual void SetBorderSize(Short_t bordersize)
Definition TWbox.h:52
return c1
Definition legend1.C:41
TF1 * f1
Definition legend1.C:11
Author
Rene Brun

Definition in file ntuple1.C.