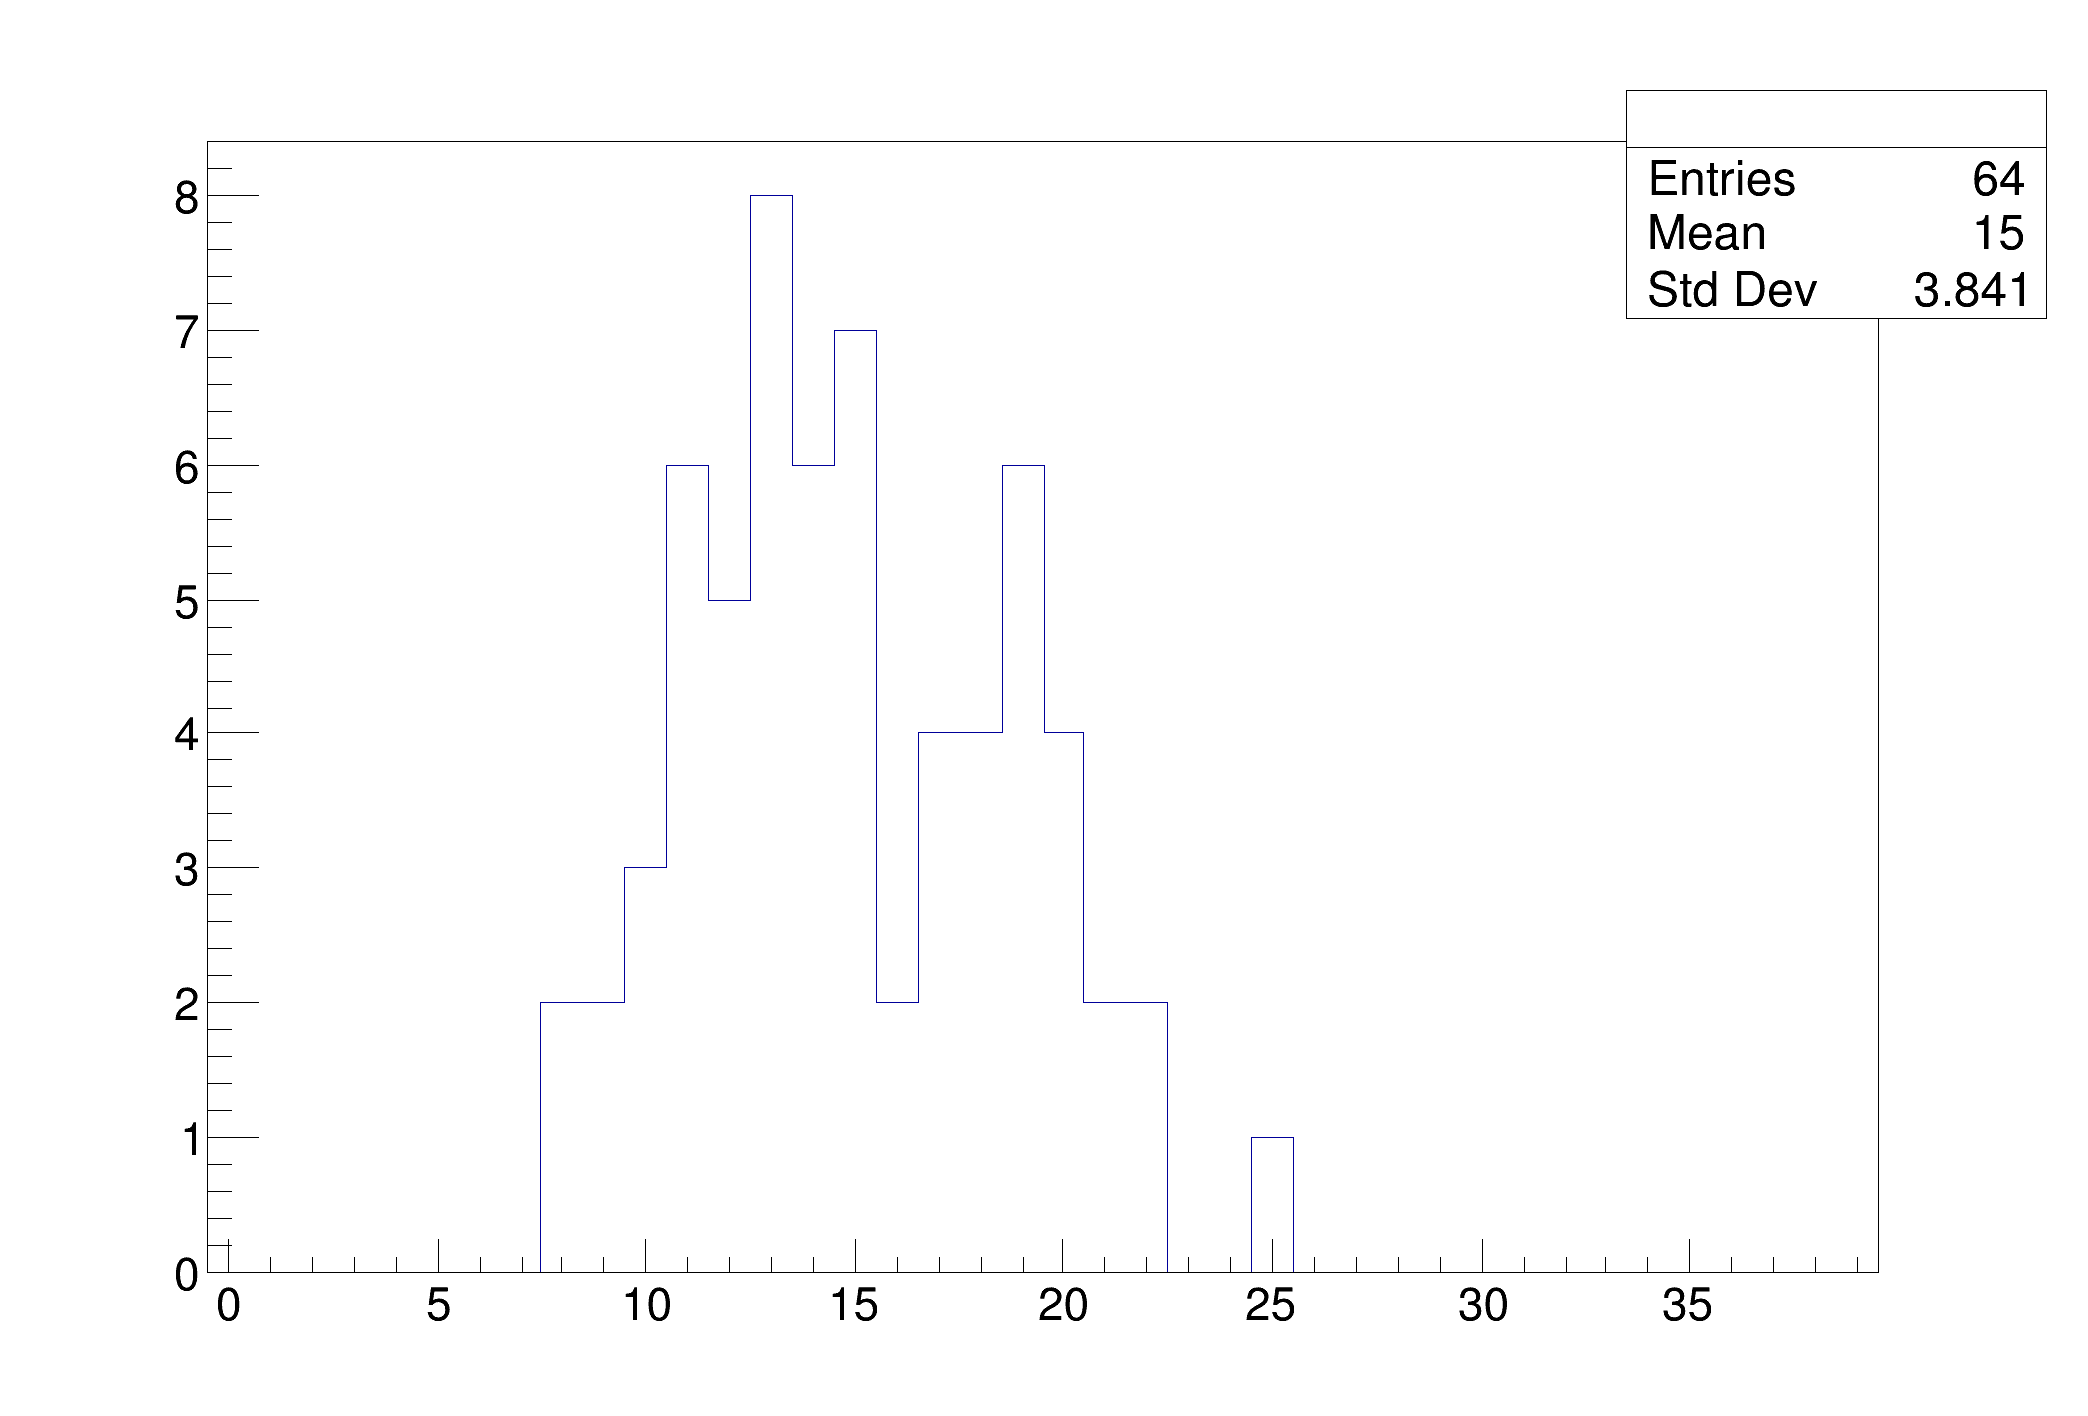
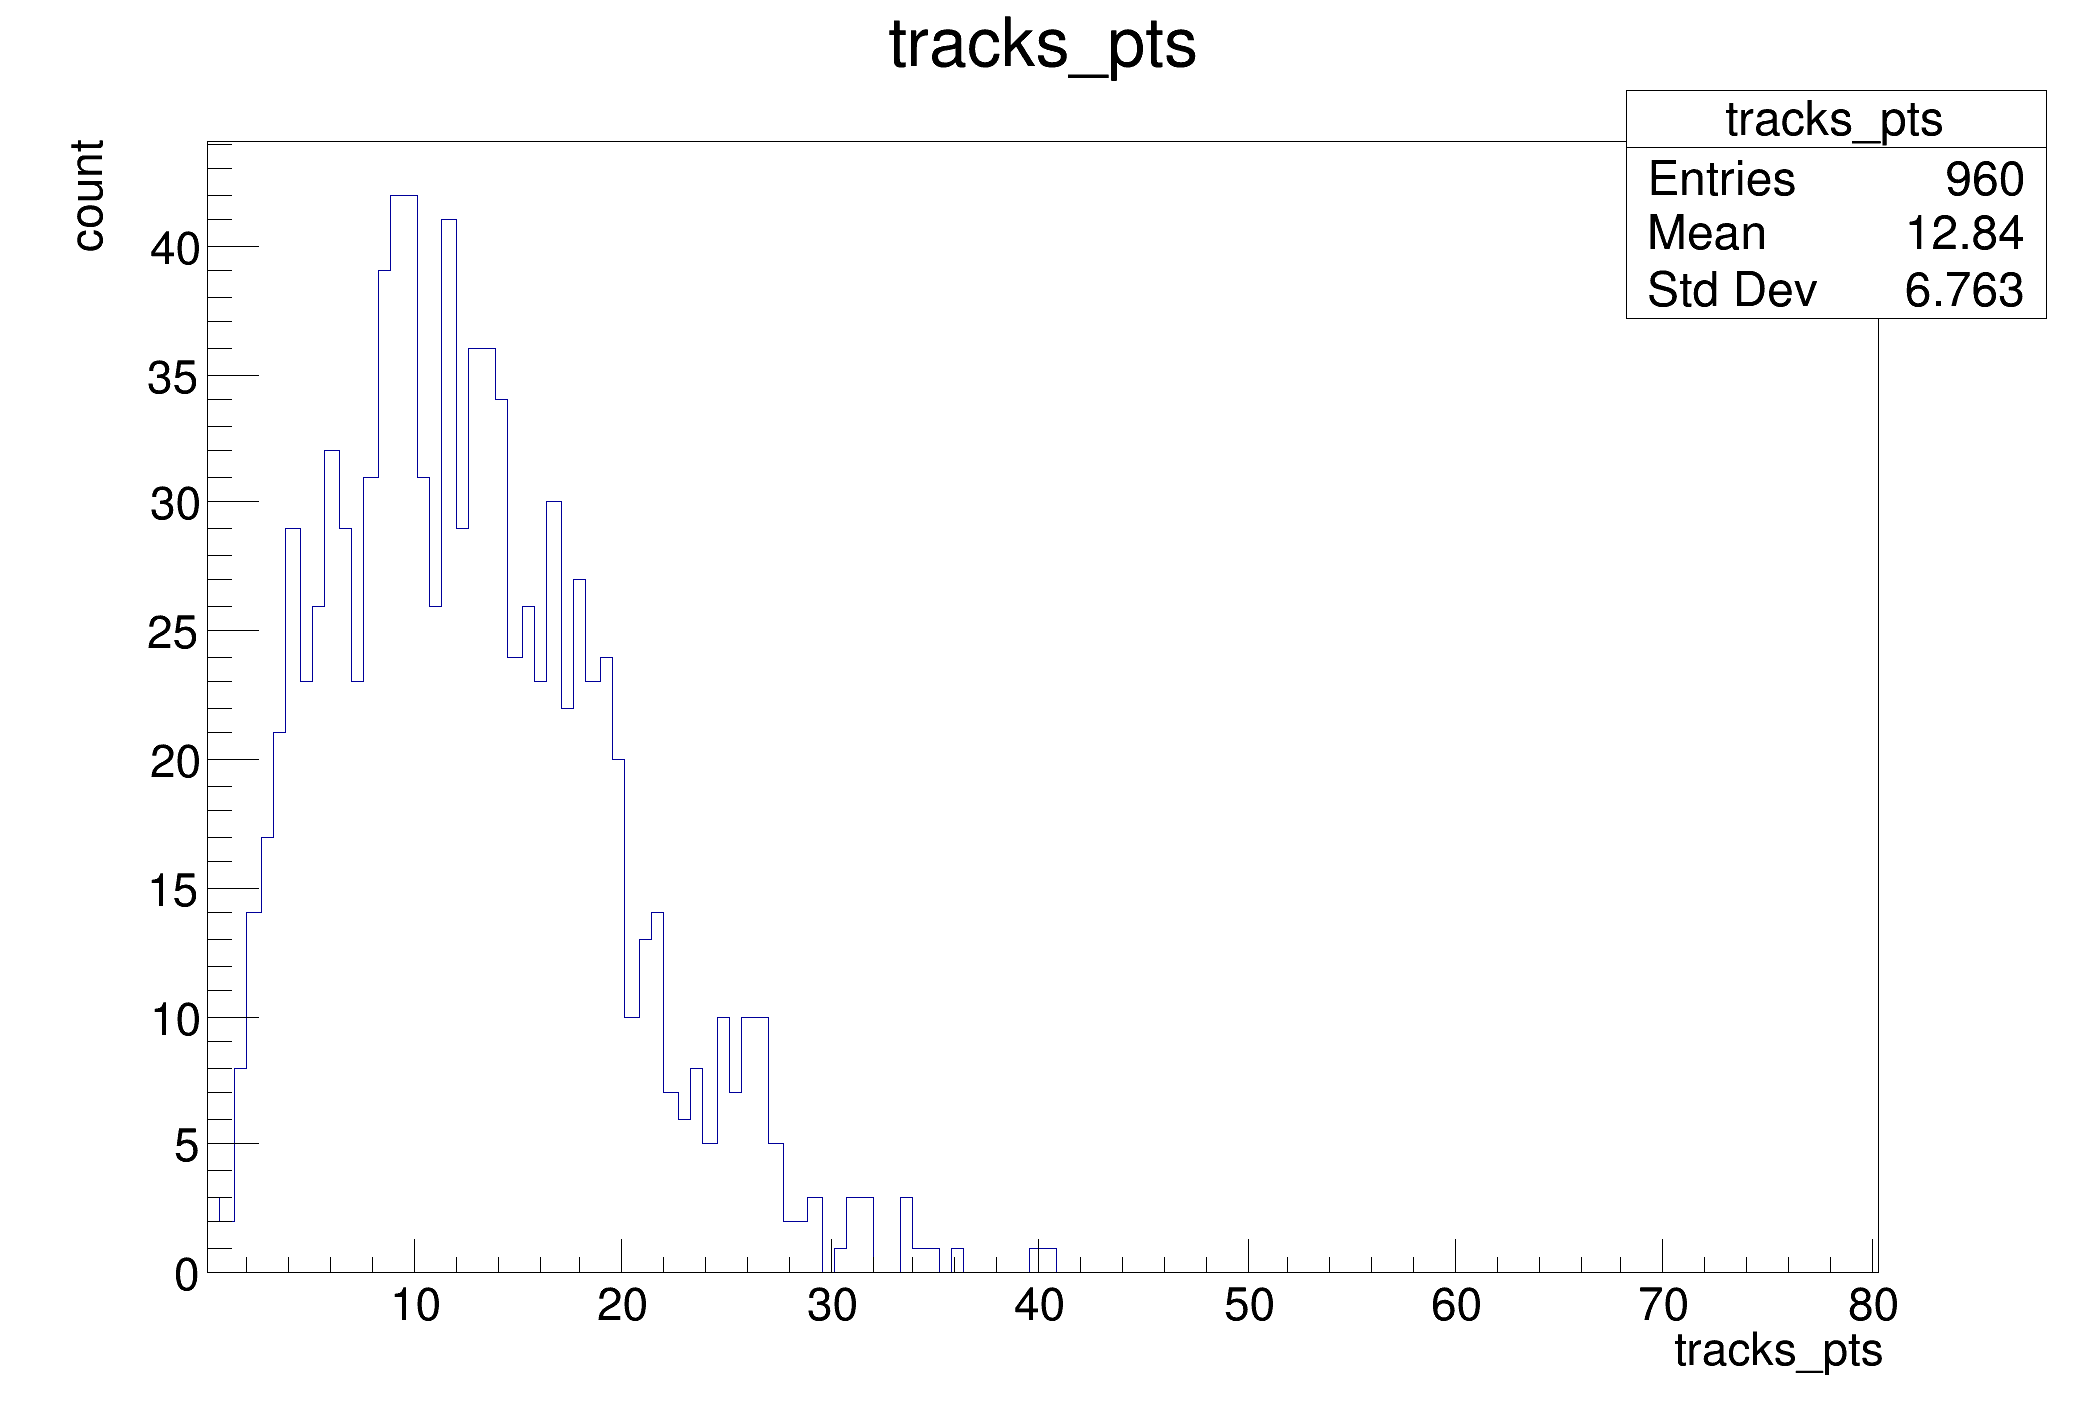
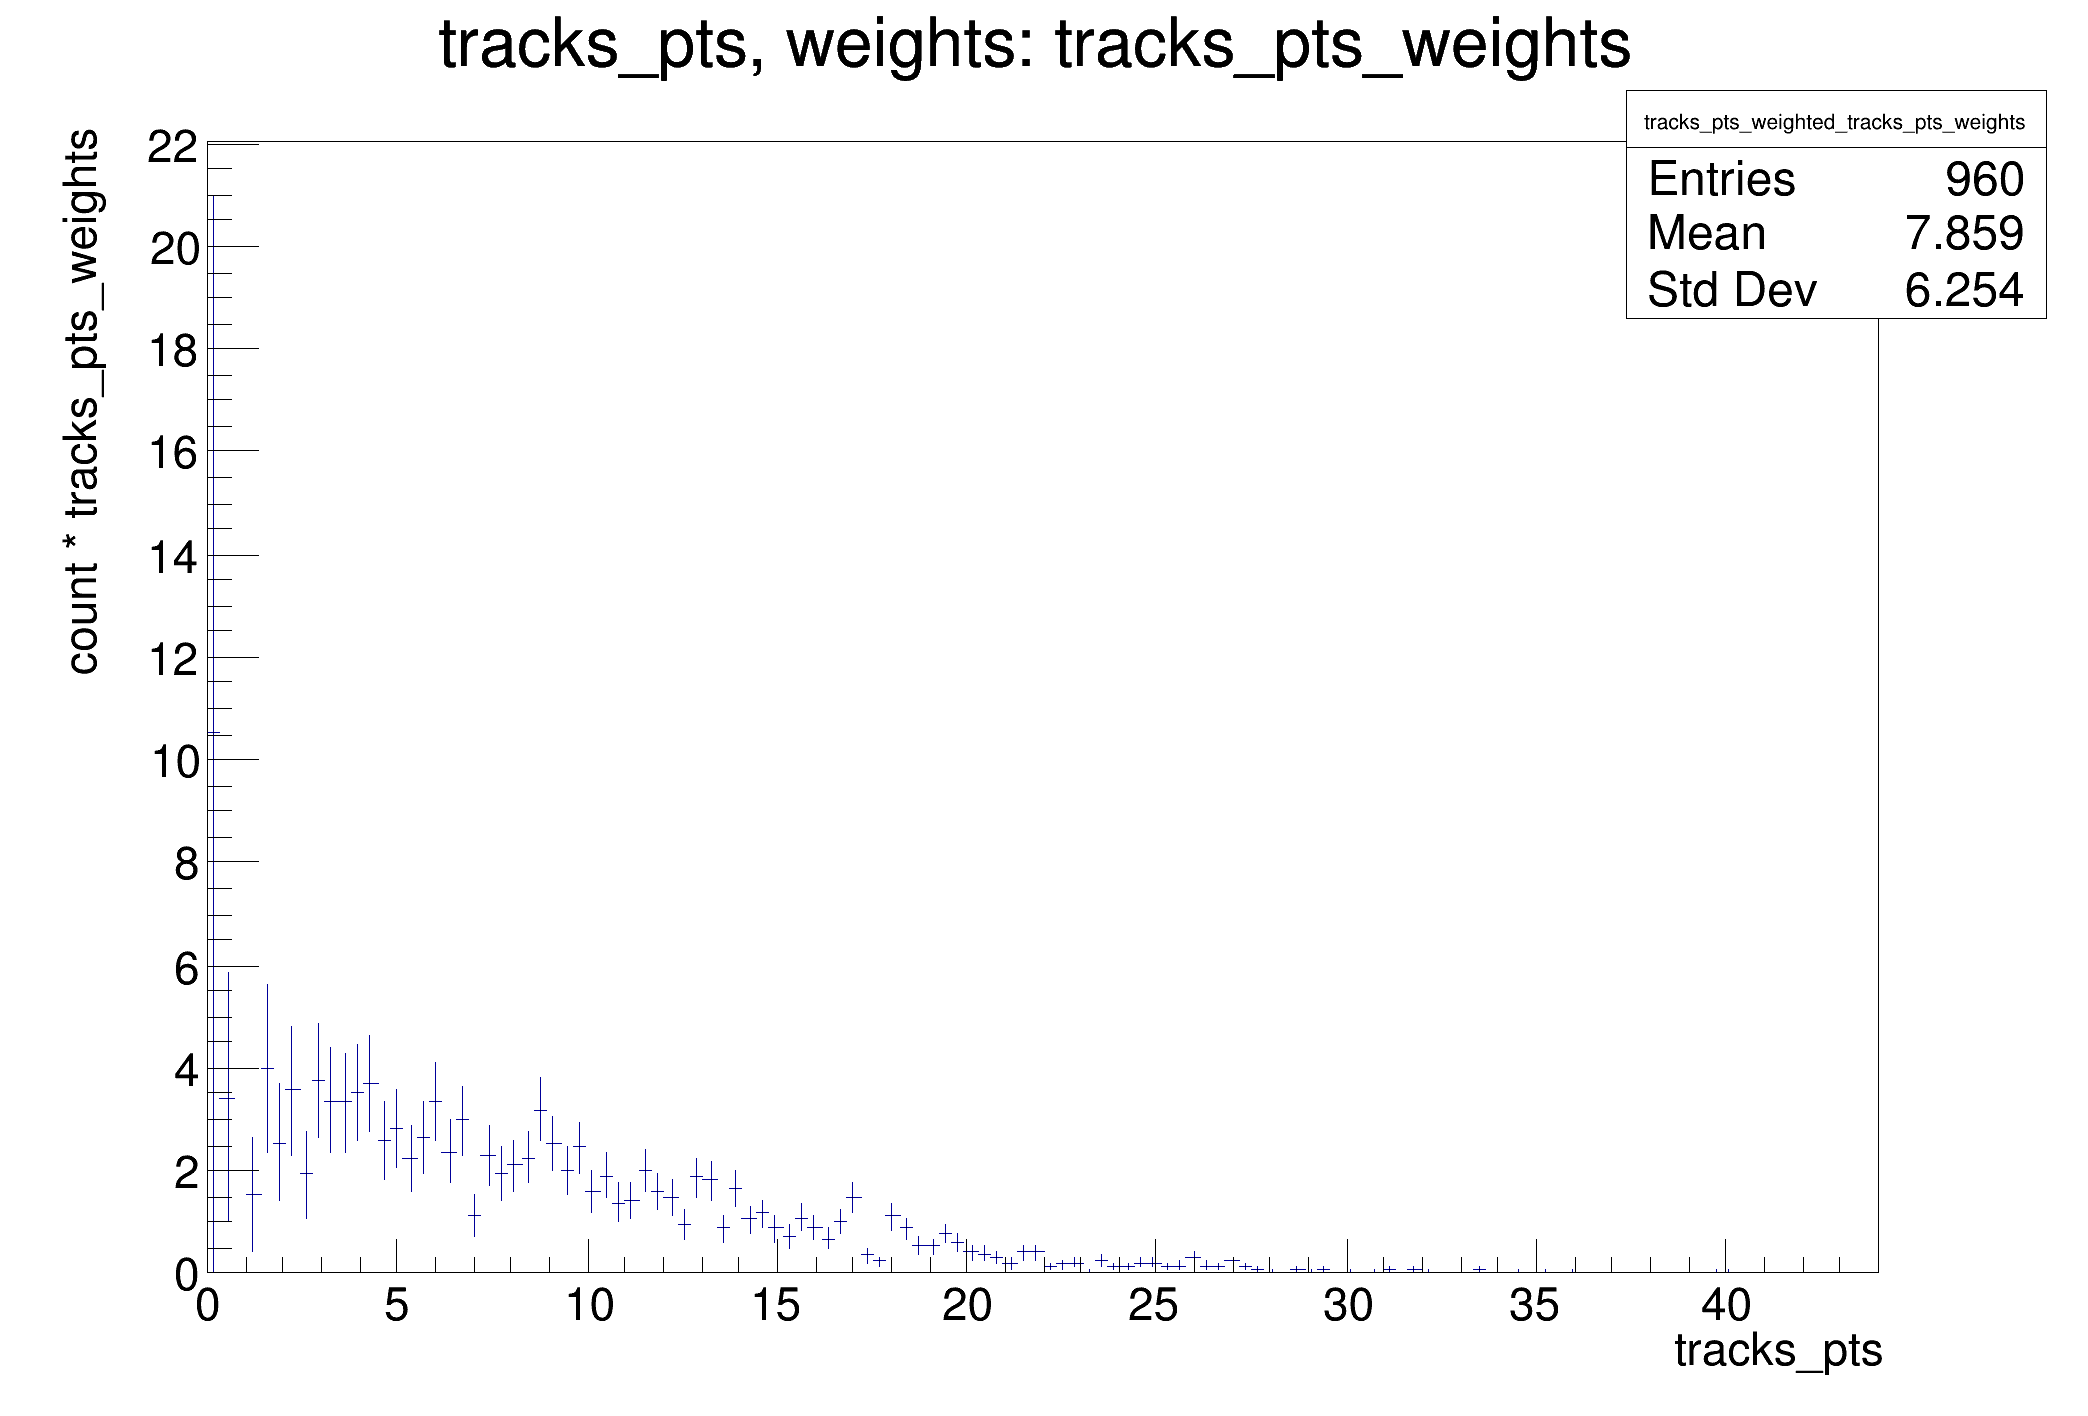
vectors of tracks.
This tutorial shows the possibility to use data models which are more complex than flat ntuples with RDataFrame
import ROOT
fill_tree_code = '''
using FourVector = ROOT::Math::XYZTVector;
using FourVectorVec = std::vector<FourVector>;
using CylFourVector = ROOT::Math::RhoEtaPhiVector;
// A simple helper function to fill a test tree: this makes the example
// stand-alone.
void fill_tree(const char *filename, const char *treeName)
{
const double M = 0.13957; // set pi+ mass
TRandom3 R(1);
auto genTracks = [&](){
FourVectorVec tracks;
const auto nPart = R.Poisson(15);
tracks.reserve(nPart);
for (int j = 0; j < nPart; ++j) {
const auto px = R.Gaus(0, 10);
const auto py = R.Gaus(0, 10);
const auto pt = sqrt(px * px + py * py);
const auto eta = R.Uniform(-3, 3);
const auto phi = R.Uniform(0.0, 2 * TMath::Pi());
CylFourVector vcyl(pt, eta, phi);
// set energy
auto E = sqrt(vcyl.R() * vcyl.R() + M * M);
// fill track vector
tracks.emplace_back(vcyl.X(), vcyl.Y(), vcyl.Z(), E);
}
return tracks;
};
ROOT::RDataFrame d(64);
d.Define("tracks", genTracks).Snapshot<FourVectorVec>(treeName, filename, {"tracks"});
}
'''
fileName = "df002_dataModel_py.root"
treeName = "myTree"
ROOT.gInterpreter.Declare(fill_tree_code)
ROOT.fill_tree(fileName, treeName)
n_cut = 'tracks.size() > 8'
nentries = d.Filter(n_cut).Count();
print("%s events passed all filters" % nentries.GetValue())
getPt_code ='''
using namespace ROOT::VecOps;
ROOT::RVecD getPt(const RVec<FourVector> &tracks)
{
auto pt = [](const FourVector &v) { return v.pt(); };
return Map(tracks, pt);
}
'''
ROOT.gInterpreter.Declare(getPt_code)
getPtWeights_code ='''
using namespace ROOT::VecOps;
ROOT::RVecD getPtWeights(const RVec<FourVector> &tracks)
{
auto ptWeight = [](const FourVector &v) { return 1. / v.Pt(); };
return Map(tracks, ptWeight);
};
'''
ROOT.gInterpreter.Declare(getPtWeights_code)
augmented_d = d.Define('tracks_n', '(int)tracks.size()') \
.Filter('tracks_n > 2') \
.Define('tracks_pts', 'getPt( tracks )') \
.Define("tracks_pts_weights", 'getPtWeights( tracks )' )
trN = augmented_d.Histo1D(("", "", 40, -.5, 39.5), "tracks_n")
trPts = augmented_d.Histo1D("tracks_pts")
trWPts = augmented_d.Histo1D("tracks_pts", "tracks_pts_weights")
c1 = ROOT.TCanvas()
trN.Draw()
c1.SaveAs("df002_trN.png")
c2 = ROOT.TCanvas()
trPts.Draw()
c2.SaveAs("df002_trPts.png")
c3 = ROOT.TCanvas()
trWPts.Draw()
c2.SaveAs("df002_trWPts.png")
print("Saved figures to df002_*.png")
ROOT's RDataFrame offers a high level interface for analyses of data stored in TTree,...

 Show how to work with non-flat data models, e.g.

