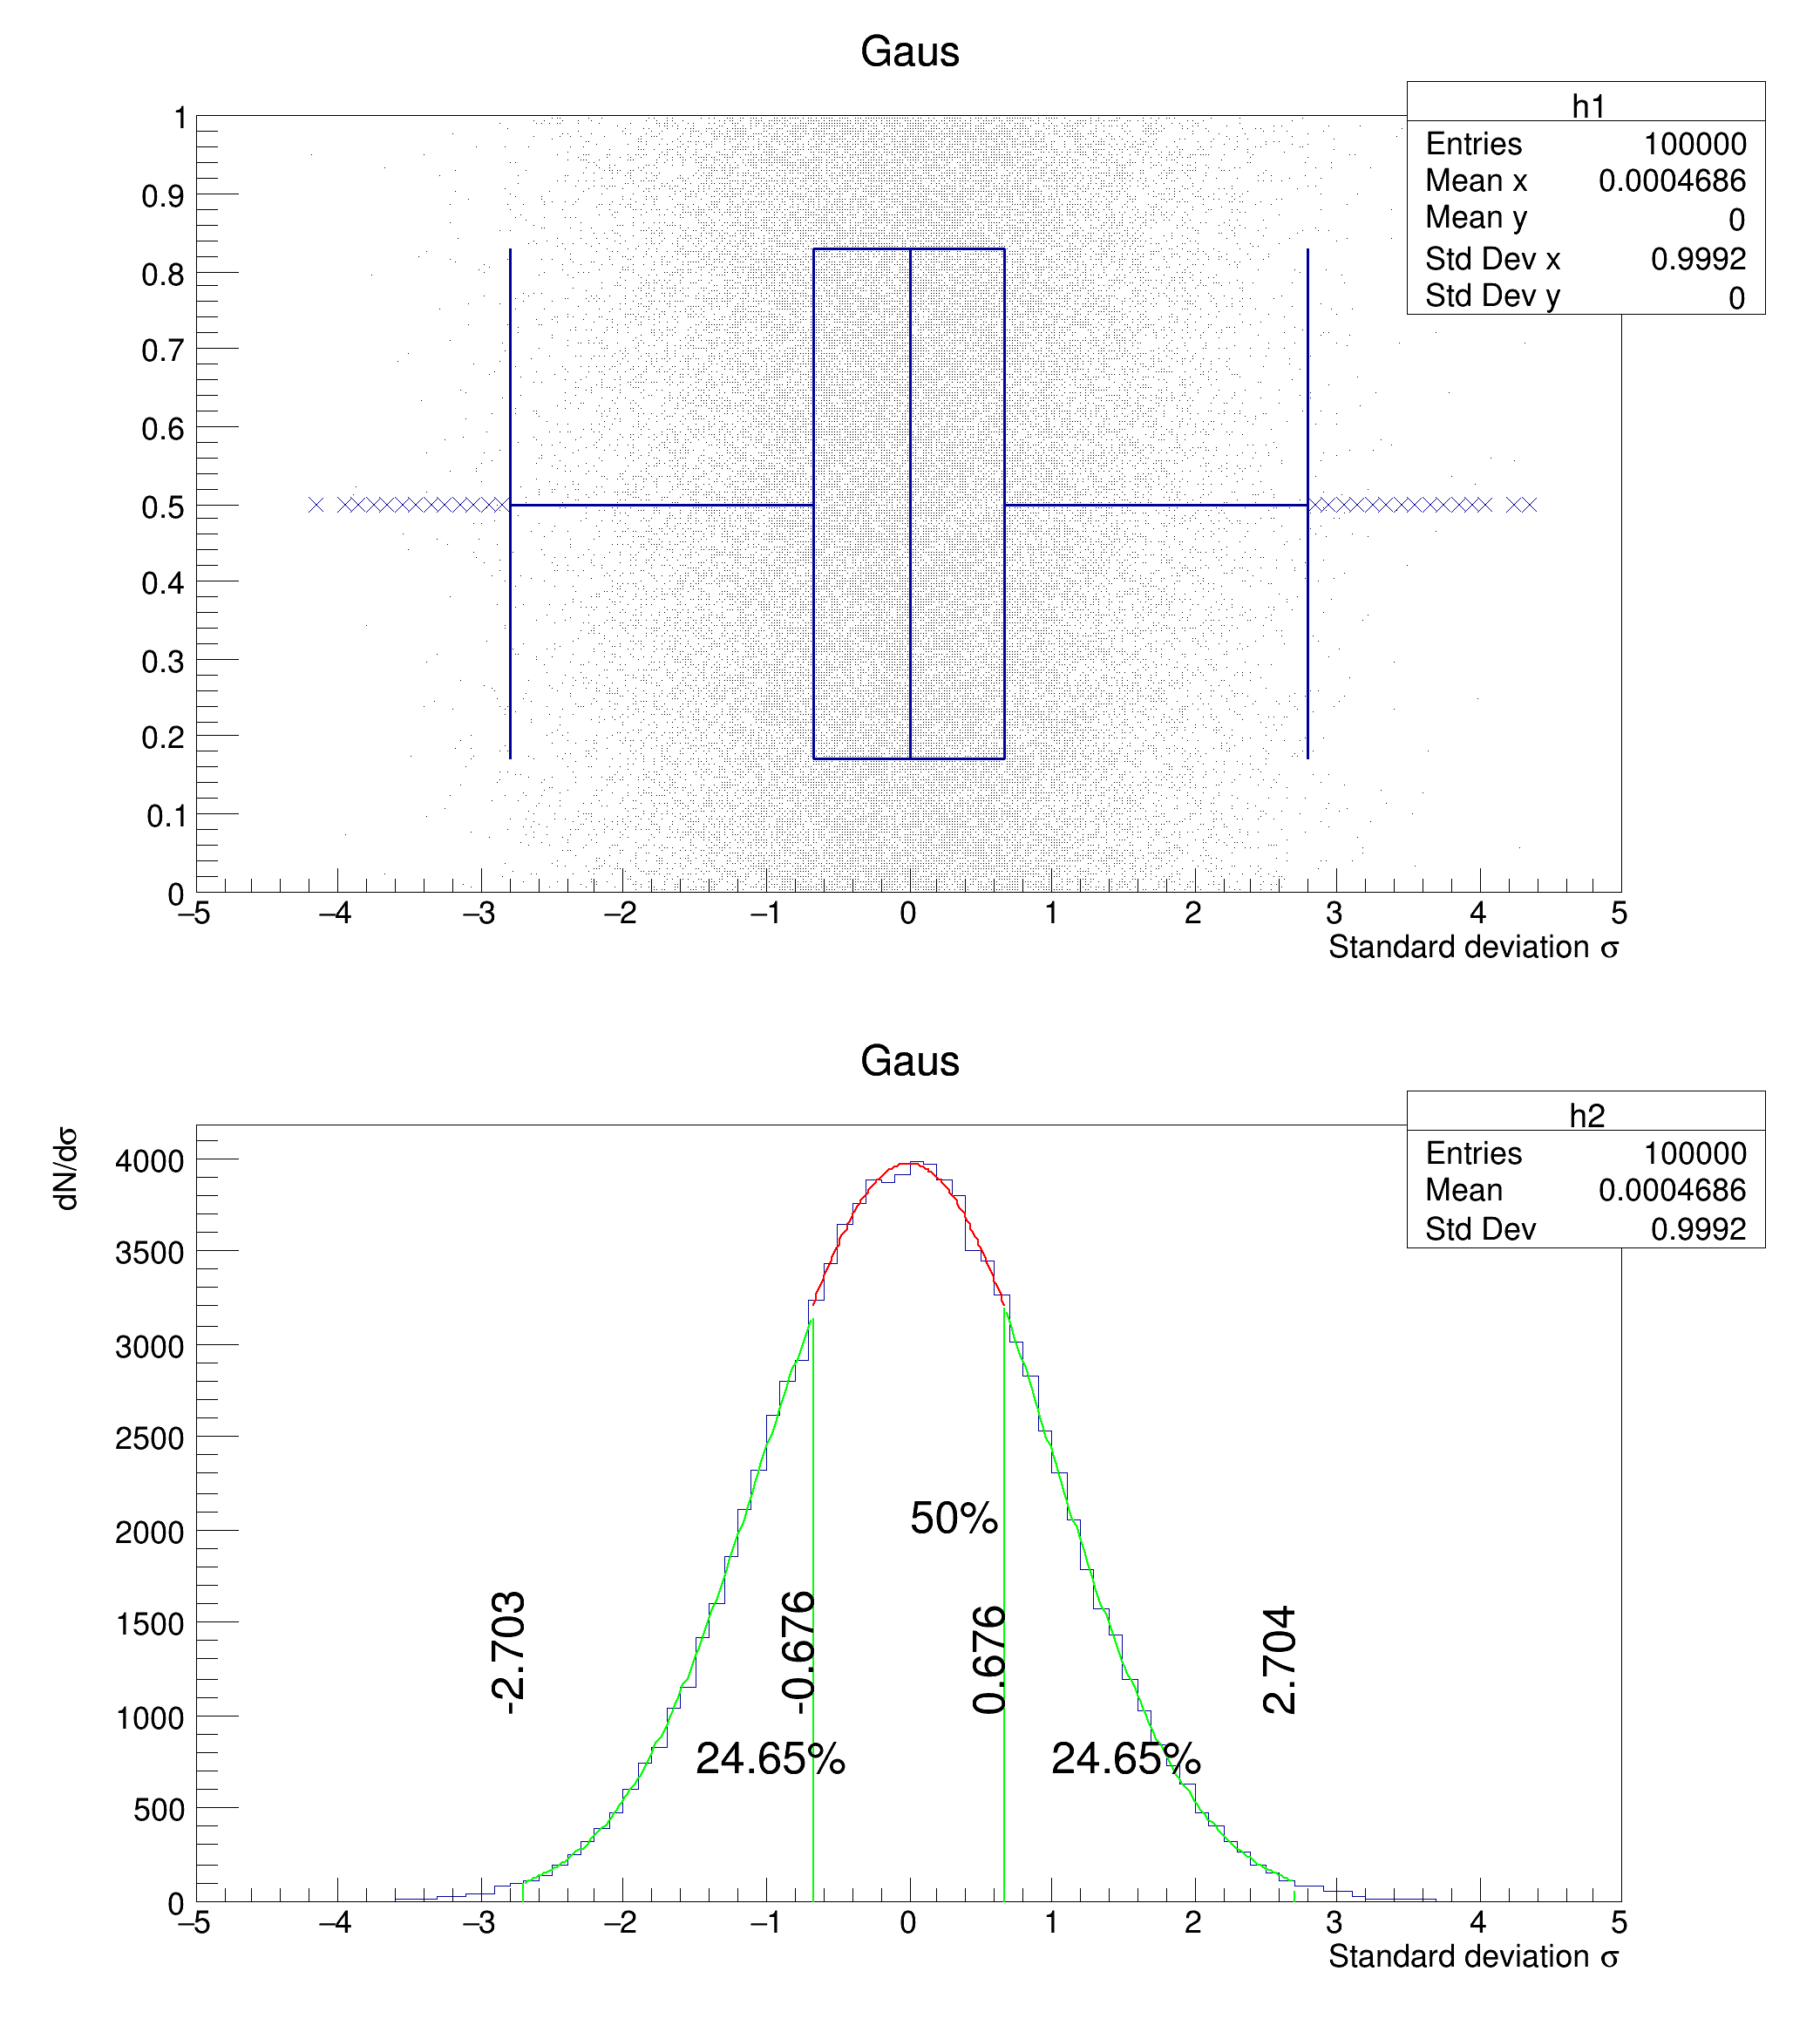
 Example of candle plot showing the whiskers definition.

Q1 (-25%): -0.675525 Median: 0.00168511 Q3 (+25%): 0.676189
FCN=11.7941 FROM MIGRAD STATUS=CONVERGED 138 CALLS 139 TOTAL
EDM=1.08103e-12 STRATEGY= 1 ERROR MATRIX ACCURATE
EXT PARAMETER STEP FIRST
NO. NAME VALUE ERROR SIZE DERIVATIVE
1 Constant 3.72831e+03 1.82107e+02 4.21637e-02 1.36245e-08
2 Mean -1.10774e-01 7.20921e-02 8.42717e-06 -1.49401e-04
3 Sigma 9.59469e-01 2.51499e-02 2.82317e-06 5.37129e-04
FCN=8.04689 FROM MIGRAD STATUS=CONVERGED 139 CALLS 140 TOTAL
EDM=6.08152e-08 STRATEGY= 1 ERROR MATRIX ACCURATE
EXT PARAMETER STEP FIRST
NO. NAME VALUE ERROR SIZE DERIVATIVE
1 Constant 4.07186e+03 2.44580e+02 3.87026e-02 3.94837e-07
2 Mean -2.92179e-02 8.71835e-02 7.07837e-06 -2.13598e-02
3 Sigma 1.00971e+00 2.88317e-02 2.27510e-06 -1.25158e-01
FCN=6.93238 FROM MIGRAD STATUS=CONVERGED 106 CALLS 107 TOTAL
EDM=6.56099e-08 STRATEGY= 1 ERROR MATRIX ACCURATE
EXT PARAMETER STEP FIRST
NO. NAME VALUE ERROR SIZE DERIVATIVE
1 Constant 3.97002e+03 2.57596e+01 2.40433e-02 -9.00146e-06
2 Mean -1.89022e-04 1.18284e-02 1.62701e-05 7.29142e-03
3 Sigma 1.02465e+00 3.35469e-02 1.82218e-05 7.40149e-03
void candleplotwhiskers() {
auto c1 =
new TCanvas(
"c1",
"Candle Presets",700,800);
auto h1 =
new TH2I(
"h1",
"Gaus",100,-5,5,1,0,1);
auto h2 =
new TH1I(
"h2",
"Gaus",100,-5,5);
h2->GetXaxis()->SetTitle("Standard deviation #sigma");
h2->GetYaxis()->SetTitle("dN/d#sigma");
float myRand;
for (int i = 0; i < 100000; i++) {
myRand = rng->Gaus(0,1);
h2->Fill(myRand);
}
q[0] = 0.;
q[1] = 0.;
q[2] = 0.;
p[0] = 0.25; p[1] = 0.5; p[2] = 0.75;
cout <<
"Q1 (-25%): " <<
q[0] <<
" Median: " <<
q[1] <<
" Q3 (+25%): " <<
q[2] << endl;
auto mygaus_1_middle =
new TF1(
"mygaus_1_middle",
"gaus",
q[0],
q[2]);
auto mygaus_1_left =
new TF1(
"mygaus_1_left",
"gaus",
q[0]-1.5*iqr,
q[0]);
mygaus_1_left->SetLineColor(
kGreen);
auto mygaus_1_right =
new TF1(
"mygaus_1_right",
"gaus",
q[2],
q[2]+1.5*iqr);
mygaus_1_right->SetLineColor(
kGreen);
h2->Draw("");
h2->Fit("mygaus_1_left","R");
mygaus_1_left->Draw("same");
auto l3 =
new TLine(
q[0]-1.5*iqr,0,
q[0]-1.5*iqr,mygaus_1_left->Eval(
q[0]-1.5*iqr));
l3->SetLineColor(
kGreen); l3->SetLineWidth(2); l3->Draw(
"");
auto l1 =
new TLine(
q[0] ,0,
q[0] ,mygaus_1_left->Eval(
q[0]));
l1->SetLineWidth(2); l1->SetLineColor(
kGreen); l1->Draw(
"");
h2->Fit("mygaus_1_right","R","");
mygaus_1_right->Draw("same");
auto l4 =
new TLine(
q[2]+1.5*iqr,0,
q[2]+1.5*iqr,mygaus_1_left->Eval(
q[2]+1.5*iqr));
l4->SetLineColor(
kGreen); l4->SetLineWidth(2); l4->Draw(
"");
auto l5 =
new TLine(
q[2] ,0,
q[2] ,mygaus_1_right->Eval(
q[2]));
l5->SetLineWidth(2); l5->SetLineColor(
kGreen); l5->Draw(
"");
h2->Fit("mygaus_1_middle","R");
mygaus_1_middle->Draw("same");
auto t =
new TText(); t->SetTextFont(42);
t->DrawText(0,mygaus_1_middle->Eval(0)/2,"50%");
t->DrawText(-1.5,mygaus_1_middle->Eval(-1.5)/2,"24.65%");
t->DrawText(+1,mygaus_1_middle->Eval(+1.5)/2,"24.65%");
t->DrawText(
q[0]-1.5*iqr,1000,
Form(
"%.3f",
q[0]-1.5*iqr))->SetTextAngle(90);
t->DrawText(
q[2]+1.5*iqr,1000,
Form(
"%.3f",
q[2]+1.5*iqr))->SetTextAngle(90);
t->DrawText(
q[0],1000,
Form(
"%.3f",
q[0]))->SetTextAngle(90);
t->DrawText(
q[2],1000,
Form(
"%.3f",
q[2]))->SetTextAngle(90);
}
char * Form(const char *fmt,...)
virtual void SetFillStyle(Style_t fstyle)
Set the fill area style.
virtual void SetLineWidth(Width_t lwidth)
Set the line width.
1-D histogram with an int per channel (see TH1 documentation)}
TAxis * GetXaxis()
Get the behaviour adopted by the object about the statoverflows. See EStatOverflows for more informat...
virtual Int_t Fill(Double_t x)
Increment bin with abscissa X by 1.
virtual void Draw(Option_t *option="")
Draw this histogram with options.
2-D histogram with an int per channel (see TH1 documentation)}
Use the TLine constructor to create a simple line.
virtual void SetTitle(const char *title="")
Set the title of the TNamed.
This is the base class for the ROOT Random number generators.
Base class for several text objects.
- Author
- Georg Troska
Definition in file candleplotwhiskers.C.

 Example of candle plot showing the whiskers definition.