Logo ROOT  
Reference Guide
 
Loading...
Searching...
No Matches
rf108_plotbinning.C File Reference

Detailed Description

View in nbviewer Open in SWAN Basic functionality: plotting unbinned data with alternate and variable binnings

␛[1mRooFit v3.60 -- Developed by Wouter Verkerke and David Kirkby␛[0m
Copyright (C) 2000-2013 NIKHEF, University of California & Stanford University
All rights reserved, please read http://roofit.sourceforge.net/license.txt
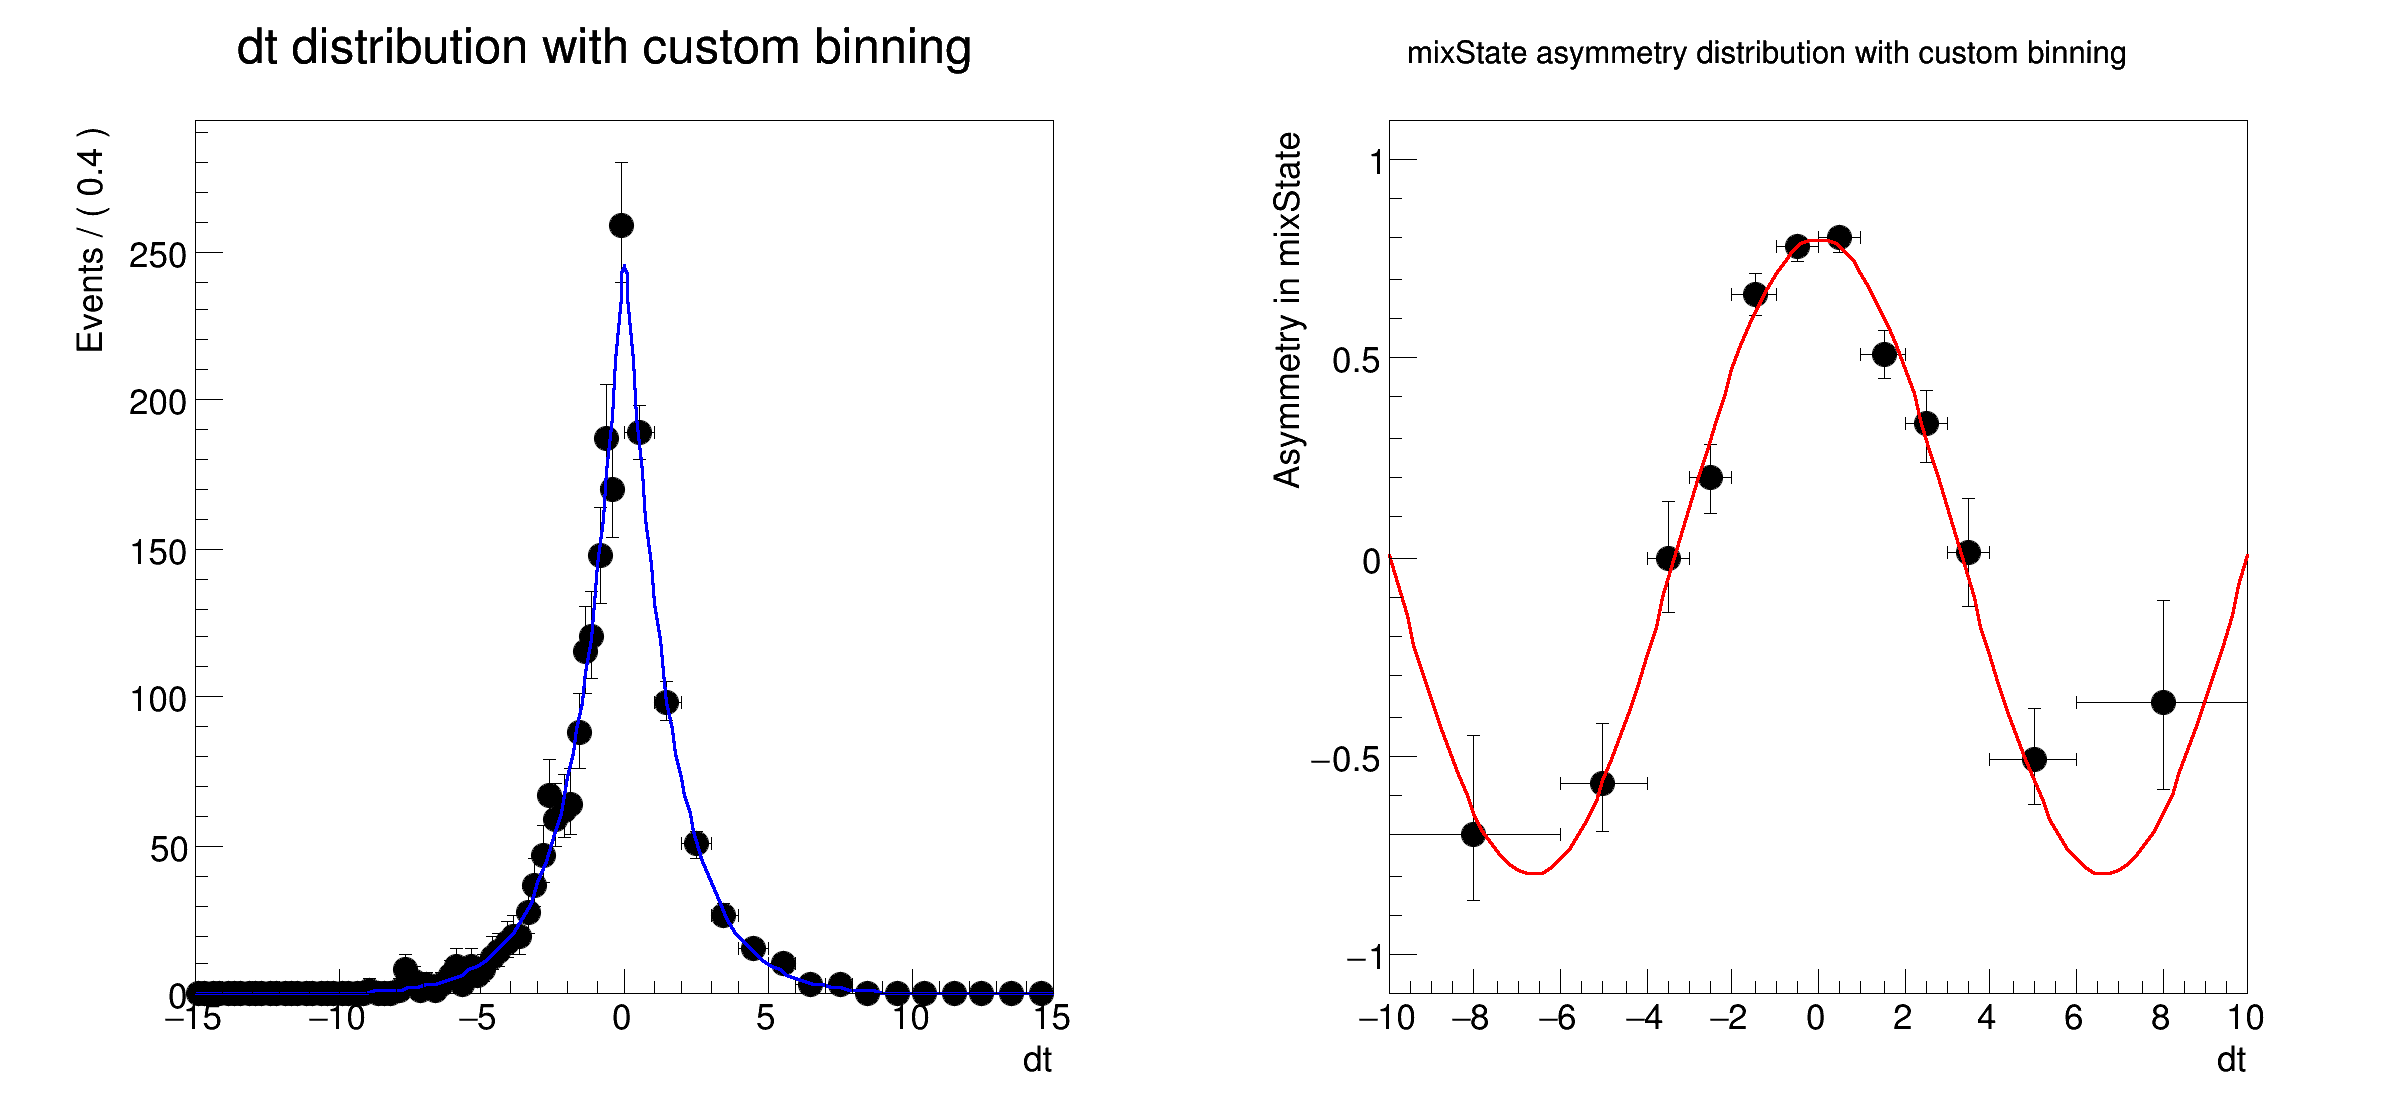
[#1] INFO:Plotting -- RooAbsReal::plotOn(bmix) plot on dt integrates over variables (mixState,tagFlav)
[#1] INFO:Plotting -- RooAbsReal::plotAsymOn(bmix) plot on dt projects variables (tagFlav)
#include "RooRealVar.h"
#include "RooDataSet.h"
#include "RooGaussModel.h"
#include "RooDecay.h"
#include "RooBMixDecay.h"
#include "RooCategory.h"
#include "RooBinning.h"
#include "RooPlot.h"
#include "TCanvas.h"
#include "TAxis.h"
#include "TH1.h"
using namespace RooFit;
{
// S e t u p m o d e l
// ---------------------
// Build a B decay pdf with mixing
RooRealVar dt("dt", "dt", -20, 20);
RooRealVar dm("dm", "dm", 0.472);
RooRealVar tau("tau", "tau", 1.547);
RooRealVar w("w", "mistag rate", 0.1);
RooRealVar dw("dw", "delta mistag rate", 0.);
RooCategory mixState("mixState", "B0/B0bar mixing state");
mixState.defineType("mixed", -1);
mixState.defineType("unmixed", 1);
RooCategory tagFlav("tagFlav", "Flavour of the tagged B0");
tagFlav.defineType("B0", 1);
tagFlav.defineType("B0bar", -1);
// Build a gaussian resolution model
RooRealVar bias1("bias1", "bias1", 0);
RooRealVar sigma1("sigma1", "sigma1", 0.1);
RooGaussModel gm1("gm1", "gauss model 1", dt, bias1, sigma1);
// Construct Bdecay (x) gauss
RooBMixDecay bmix("bmix", "decay", dt, mixState, tagFlav, tau, dm, w, dw, gm1, RooBMixDecay::DoubleSided);
// S a m p l e d a t a f r o m m o d e l
// --------------------------------------------
// Sample 2000 events in (dt,mixState,tagFlav) from bmix
RooDataSet *data = bmix.generate(RooArgSet(dt, mixState, tagFlav), 2000);
// S h o w d t d i s t r i b u t i o n w i t h c u s t o m b i n n i n g
// -------------------------------------------------------------------------------
// Make plot of dt distribution of data in range (-15,15) with fine binning for dt>0 and coarse binning for dt<0
// Create binning object with range (-15,15)
RooBinning tbins(-15, 15);
// Add 60 bins with uniform spacing in range (-15,0)
tbins.addUniform(60, -15, 0);
// Add 15 bins with uniform spacing in range (0,15)
tbins.addUniform(15, 0, 15);
// Make plot with specified binning
RooPlot *dtframe = dt.frame(Range(-15, 15), Title("dt distribution with custom binning"));
data->plotOn(dtframe, Binning(tbins));
bmix.plotOn(dtframe);
// NB: Note that bin density for each bin is adjusted to that of default frame binning as shown
// in Y axis label (100 bins --> Events/0.4*Xaxis-dim) so that all bins represent a consistent density distribution
// S h o w m i x s t a t e a s y m m e t r y w i t h c u s t o m b i n n i n g
// ------------------------------------------------------------------------------------
// Make plot of dt distribution of data asymmetry in 'mixState' with variable binning
// Create binning object with range (-10,10)
RooBinning abins(-10, 10);
// Add boundaries at 0, (-1,1), (-2,2), (-3,3), (-4,4) and (-6,6)
abins.addBoundary(0);
abins.addBoundaryPair(1);
abins.addBoundaryPair(2);
abins.addBoundaryPair(3);
abins.addBoundaryPair(4);
abins.addBoundaryPair(6);
// Create plot frame in dt
RooPlot *aframe = dt.frame(Range(-10, 10), Title("mixState asymmetry distribution with custom binning"));
// Plot mixState asymmetry of data with specified custom binning
data->plotOn(aframe, Asymmetry(mixState), Binning(abins));
// Plot corresponding property of pdf
bmix.plotOn(aframe, Asymmetry(mixState));
// Adjust vertical range of plot to sensible values for an asymmetry
aframe->SetMinimum(-1.1);
aframe->SetMaximum(1.1);
// NB: For asymmetry distributions no density corrects are needed (and are thus not applied)
// Draw plots on canvas
TCanvas *c = new TCanvas("rf108_plotbinning", "rf108_plotbinning", 800, 400);
c->Divide(2);
c->cd(1);
gPad->SetLeftMargin(0.15);
dtframe->GetYaxis()->SetTitleOffset(1.6);
dtframe->Draw();
c->cd(2);
gPad->SetLeftMargin(0.15);
aframe->GetYaxis()->SetTitleOffset(1.6);
aframe->Draw();
}
#define c(i)
Definition RSha256.hxx:101
#define gPad
virtual RooPlot * plotOn(RooPlot *frame, const RooCmdArg &arg1=RooCmdArg::none(), const RooCmdArg &arg2=RooCmdArg::none(), const RooCmdArg &arg3=RooCmdArg::none(), const RooCmdArg &arg4=RooCmdArg::none(), const RooCmdArg &arg5=RooCmdArg::none(), const RooCmdArg &arg6=RooCmdArg::none(), const RooCmdArg &arg7=RooCmdArg::none(), const RooCmdArg &arg8=RooCmdArg::none()) const
RooArgSet is a container object that can hold multiple RooAbsArg objects.
Definition RooArgSet.h:29
Class RooBMixDecay is a RooAbsAnaConvPdf implementation that describes the decay of B mesons with the...
Class RooBinning is an implements RooAbsBinning in terms of an array of boundary values,...
Definition RooBinning.h:28
RooCategory is an object to represent discrete states.
Definition RooCategory.h:27
RooDataSet is a container class to hold unbinned data.
Definition RooDataSet.h:33
Class RooGaussModel implements a RooResolutionModel that models a Gaussian distribution.
A RooPlot is a plot frame and a container for graphics objects within that frame.
Definition RooPlot.h:44
virtual void SetMinimum(Double_t minimum=-1111)
Set minimum value of Y axis.
Definition RooPlot.cxx:1091
TAxis * GetYaxis() const
Definition RooPlot.cxx:1263
static RooPlot * frame(const RooAbsRealLValue &var, Double_t xmin, Double_t xmax, Int_t nBins)
Create a new frame for a given variable in x.
Definition RooPlot.cxx:249
virtual void SetMaximum(Double_t maximum=-1111)
Set maximum value of Y axis.
Definition RooPlot.cxx:1081
virtual void Draw(Option_t *options=0)
Draw this plot and all of the elements it contains.
Definition RooPlot.cxx:691
RooRealVar represents a variable that can be changed from the outside.
Definition RooRealVar.h:39
virtual void SetTitleOffset(Float_t offset=1)
Set distance between the axis and the axis title.
Definition TAttAxis.cxx:293
The Canvas class.
Definition TCanvas.h:23
The namespace RooFit contains mostly switches that change the behaviour of functions of PDFs (or othe...
Ta Range(0, 0, 1, 1)
Date
July 2008
Author
Wouter Verkerke

Definition in file rf108_plotbinning.C.