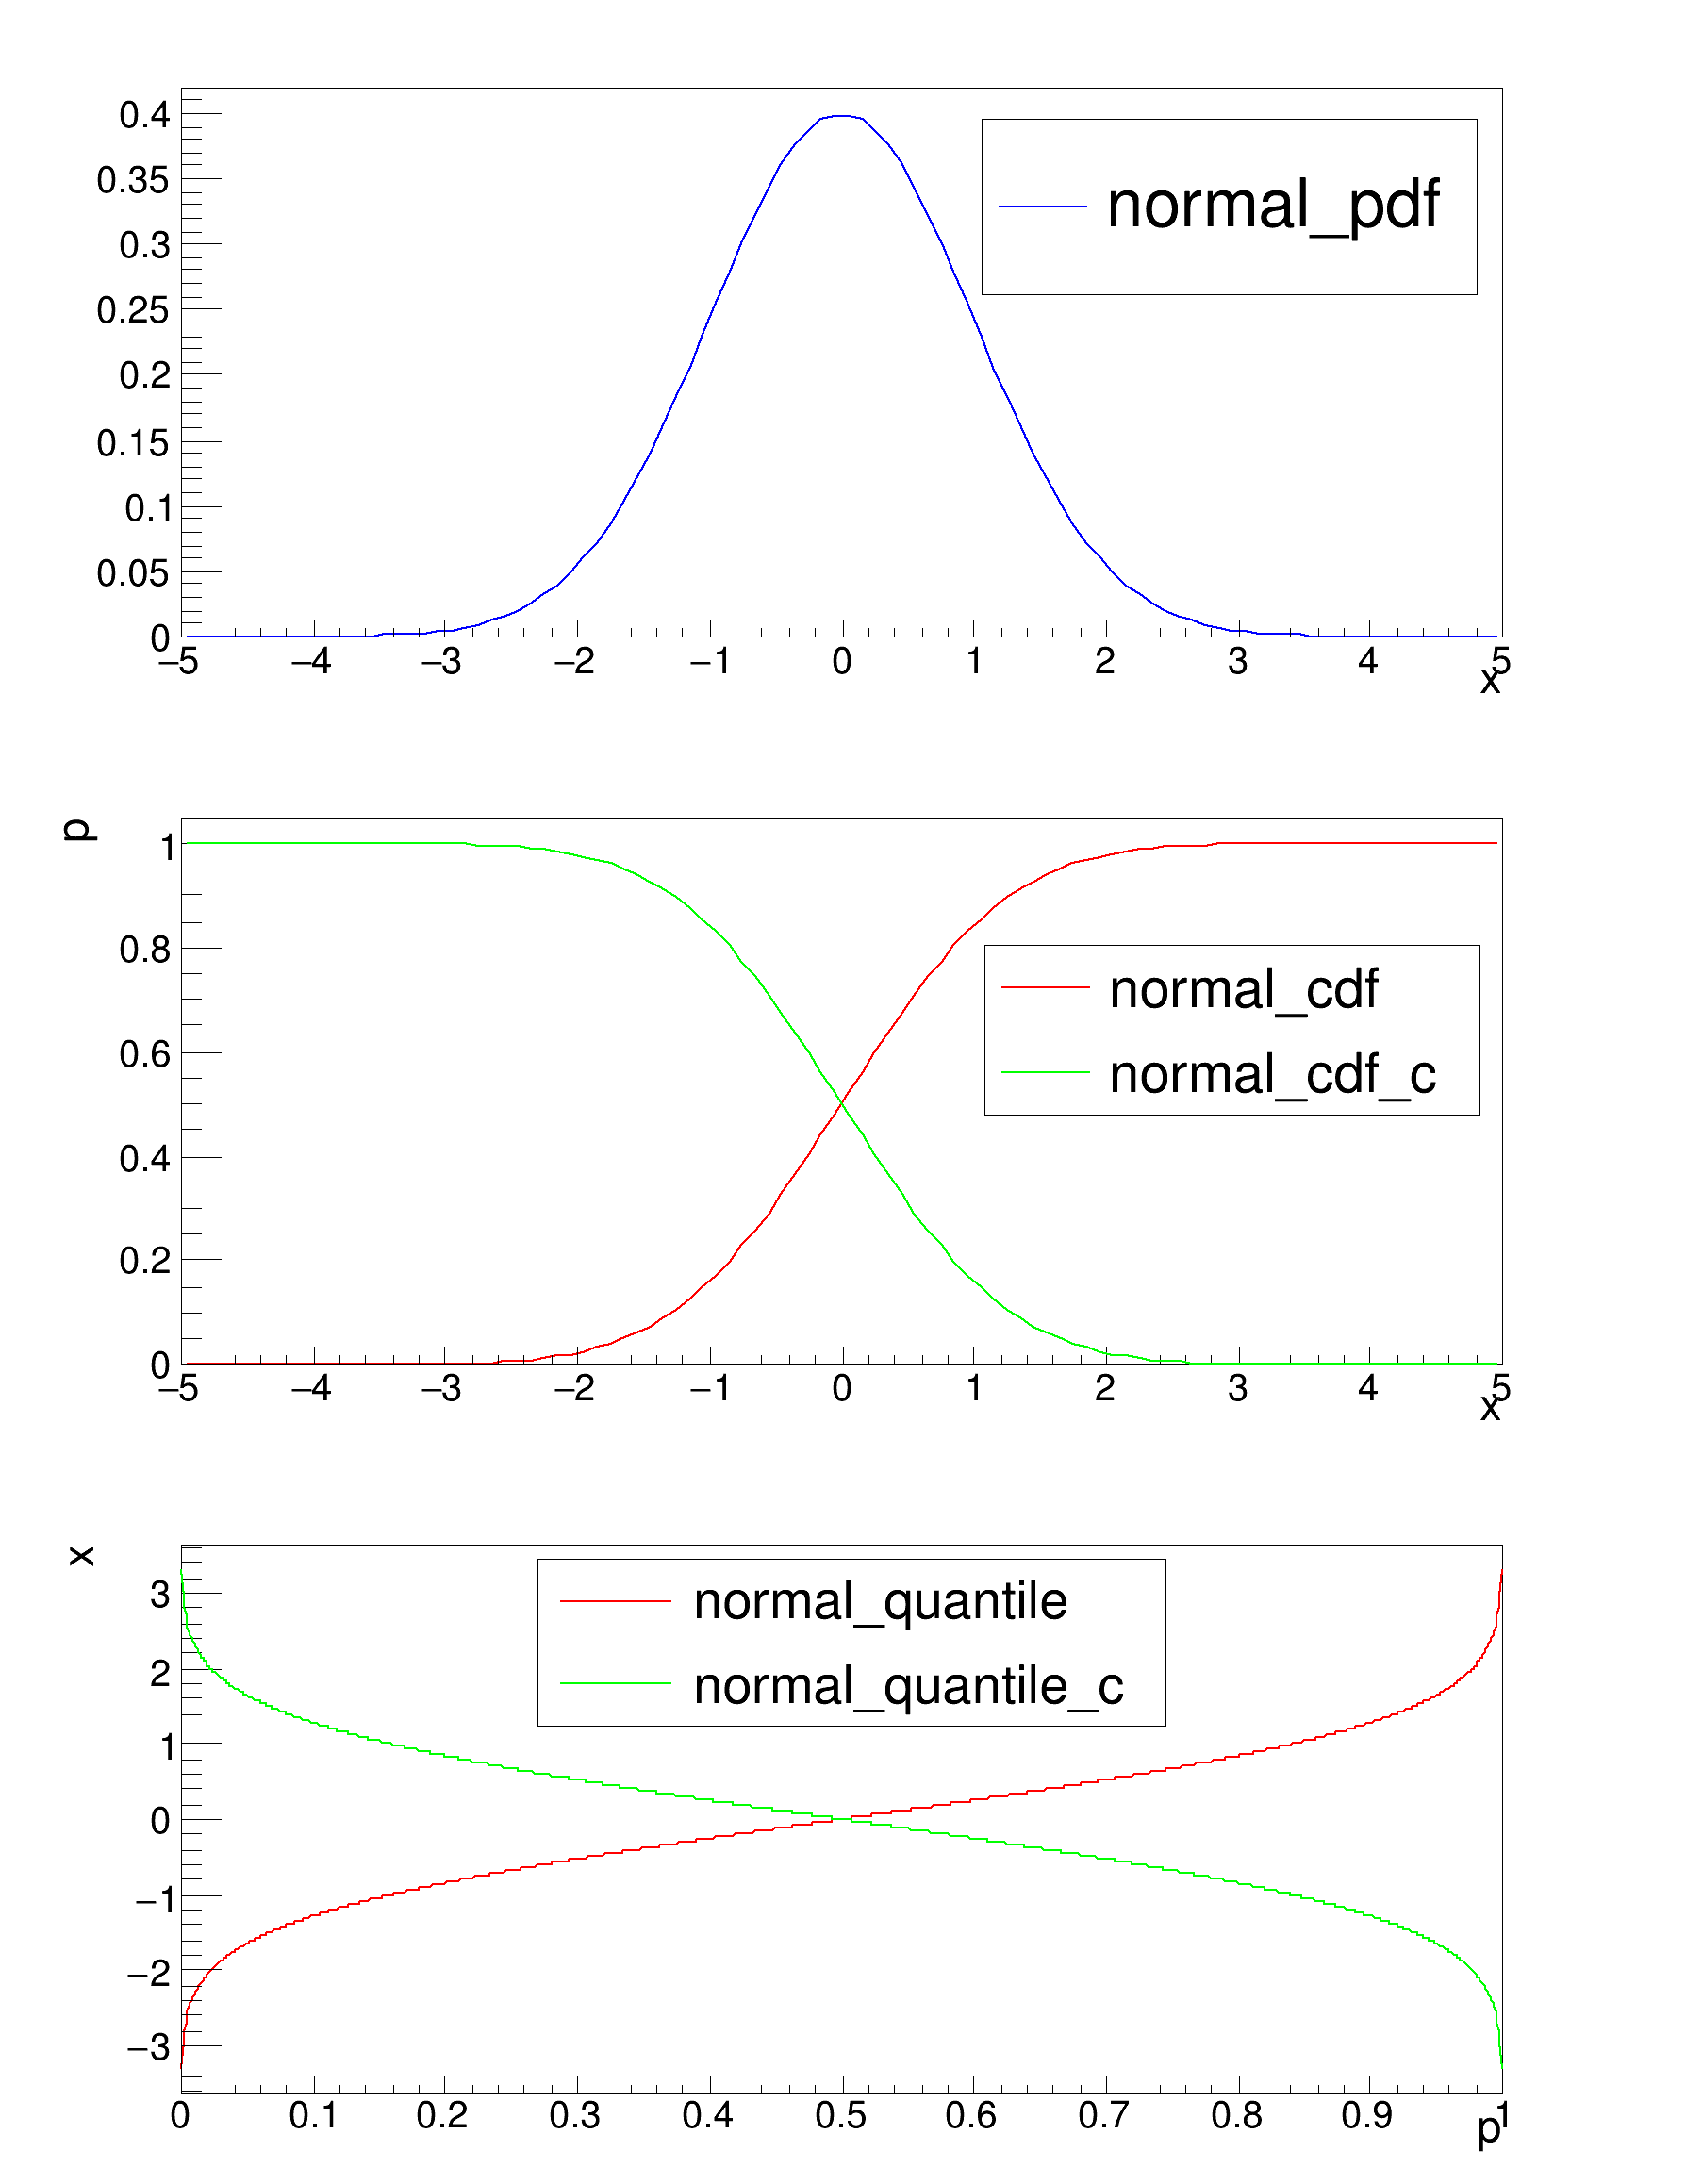
from ROOT import TF1, TCanvas, TSystem, TAxis, TLegend
from ROOT import kRed, kGreen, kBlue
pdfunc =
TF1(
"pdf",
"ROOT::Math::normal_pdf(x, [0],[1])", -5, 5)
cdfunc =
TF1(
"cdf",
"ROOT::Math::normal_cdf(x, [0],[1])", -5, 5)
ccdfunc =
TF1(
"cdf_c",
"ROOT::Math::normal_cdf_c(x, [0])", -5, 5)
qfunc =
TF1(
"quantile",
"ROOT::Math::normal_quantile(x, [0])", 0, 1)
cqfunc =
TF1(
"quantile_c",
"ROOT::Math::normal_quantile_c(x, [0])", 0, 1)
pdfunc.SetParameters(1.0, 0.0)
pdfunc.SetTitle("")
pdfunc.SetLineColor(kBlue)
Xaxis = pdfunc.GetXaxis()
Yaxis = pdfunc.GetYaxis()
Xaxis.SetLabelSize(0.06)
Xaxis.SetTitle("x")
Xaxis.SetTitleSize(0.07)
Xaxis.SetTitleOffset(0.55)
Yaxis.SetLabelSize(0.06)
cdfunc.SetParameters(1.0, 0.0)
cdfunc.SetTitle("")
cdfunc.SetLineColor(kRed)
cdXaxis = cdfunc.GetXaxis()
cdYaxis = cdfunc.GetYaxis()
cdXaxis.SetLabelSize(0.06)
cdXaxis.SetTitle("x")
cdXaxis.SetTitleSize(0.07)
cdXaxis.SetTitleOffset(0.55)
cdYaxis.SetLabelSize(0.06)
cdYaxis.SetTitle("p")
cdYaxis.SetTitleSize(0.07)
cdYaxis.SetTitleOffset(0.55)
ccdfunc.SetParameters(1.0, 0.0)
ccdfunc.SetTitle("")
ccdfunc.SetLineColor(kGreen)
qfunc.SetParameter(0, 1.0)
qfunc.SetTitle("")
qfunc.SetLineColor(kRed)
qfunc.SetNpx(1000)
qfXaxis = qfunc.GetXaxis()
qfYaxis = qfunc.GetYaxis()
qfXaxis.SetLabelSize(0.06)
qfXaxis.SetTitle("p")
qfYaxis.SetLabelSize(0.06)
qfXaxis.SetTitleSize(0.07)
qfXaxis.SetTitleOffset(0.55)
qfYaxis.SetTitle("x")
qfYaxis.SetTitleSize(0.07)
qfYaxis.SetTitleOffset(0.55)
cqfunc.SetParameter(0, 1.0)
cqfunc.SetTitle("")
cqfunc.SetLineColor(kGreen)
cqfunc.SetNpx(1000)
c1 =
TCanvas(
"c1",
"Normal Distributions", 100, 10, 600, 800)
c1.Divide(1, 3)
c1.cd(1)
pdfunc.Draw()
legend1 =
TLegend(0.583893, 0.601973, 0.885221, 0.854151)
legend1.AddEntry(pdfunc, "normal_pdf", "l")
legend1.Draw()
c1.cd(2)
cdfunc.Draw()
ccdfunc.Draw("same")
legend2 =
TLegend(0.585605, 0.462794, 0.886933, 0.710837)
legend2.AddEntry(cdfunc, "normal_cdf", "l")
legend2.AddEntry(ccdfunc, "normal_cdf_c", "l")
legend2.Draw()
c1.cd(3)
qfunc.Draw()
cqfunc.Draw("same")
legend3 =
TLegend(0.315094, 0.633668, 0.695179, 0.881711)
legend3.AddEntry(qfunc, "normal_quantile", "l")
legend3.AddEntry(cqfunc, "normal_quantile_c", "l")
legend3.Draw()
This class displays a legend box (TPaveText) containing several legend entries.

 Tutorial illustrating the new statistical distributions functions (pdf, cdf and quantile)