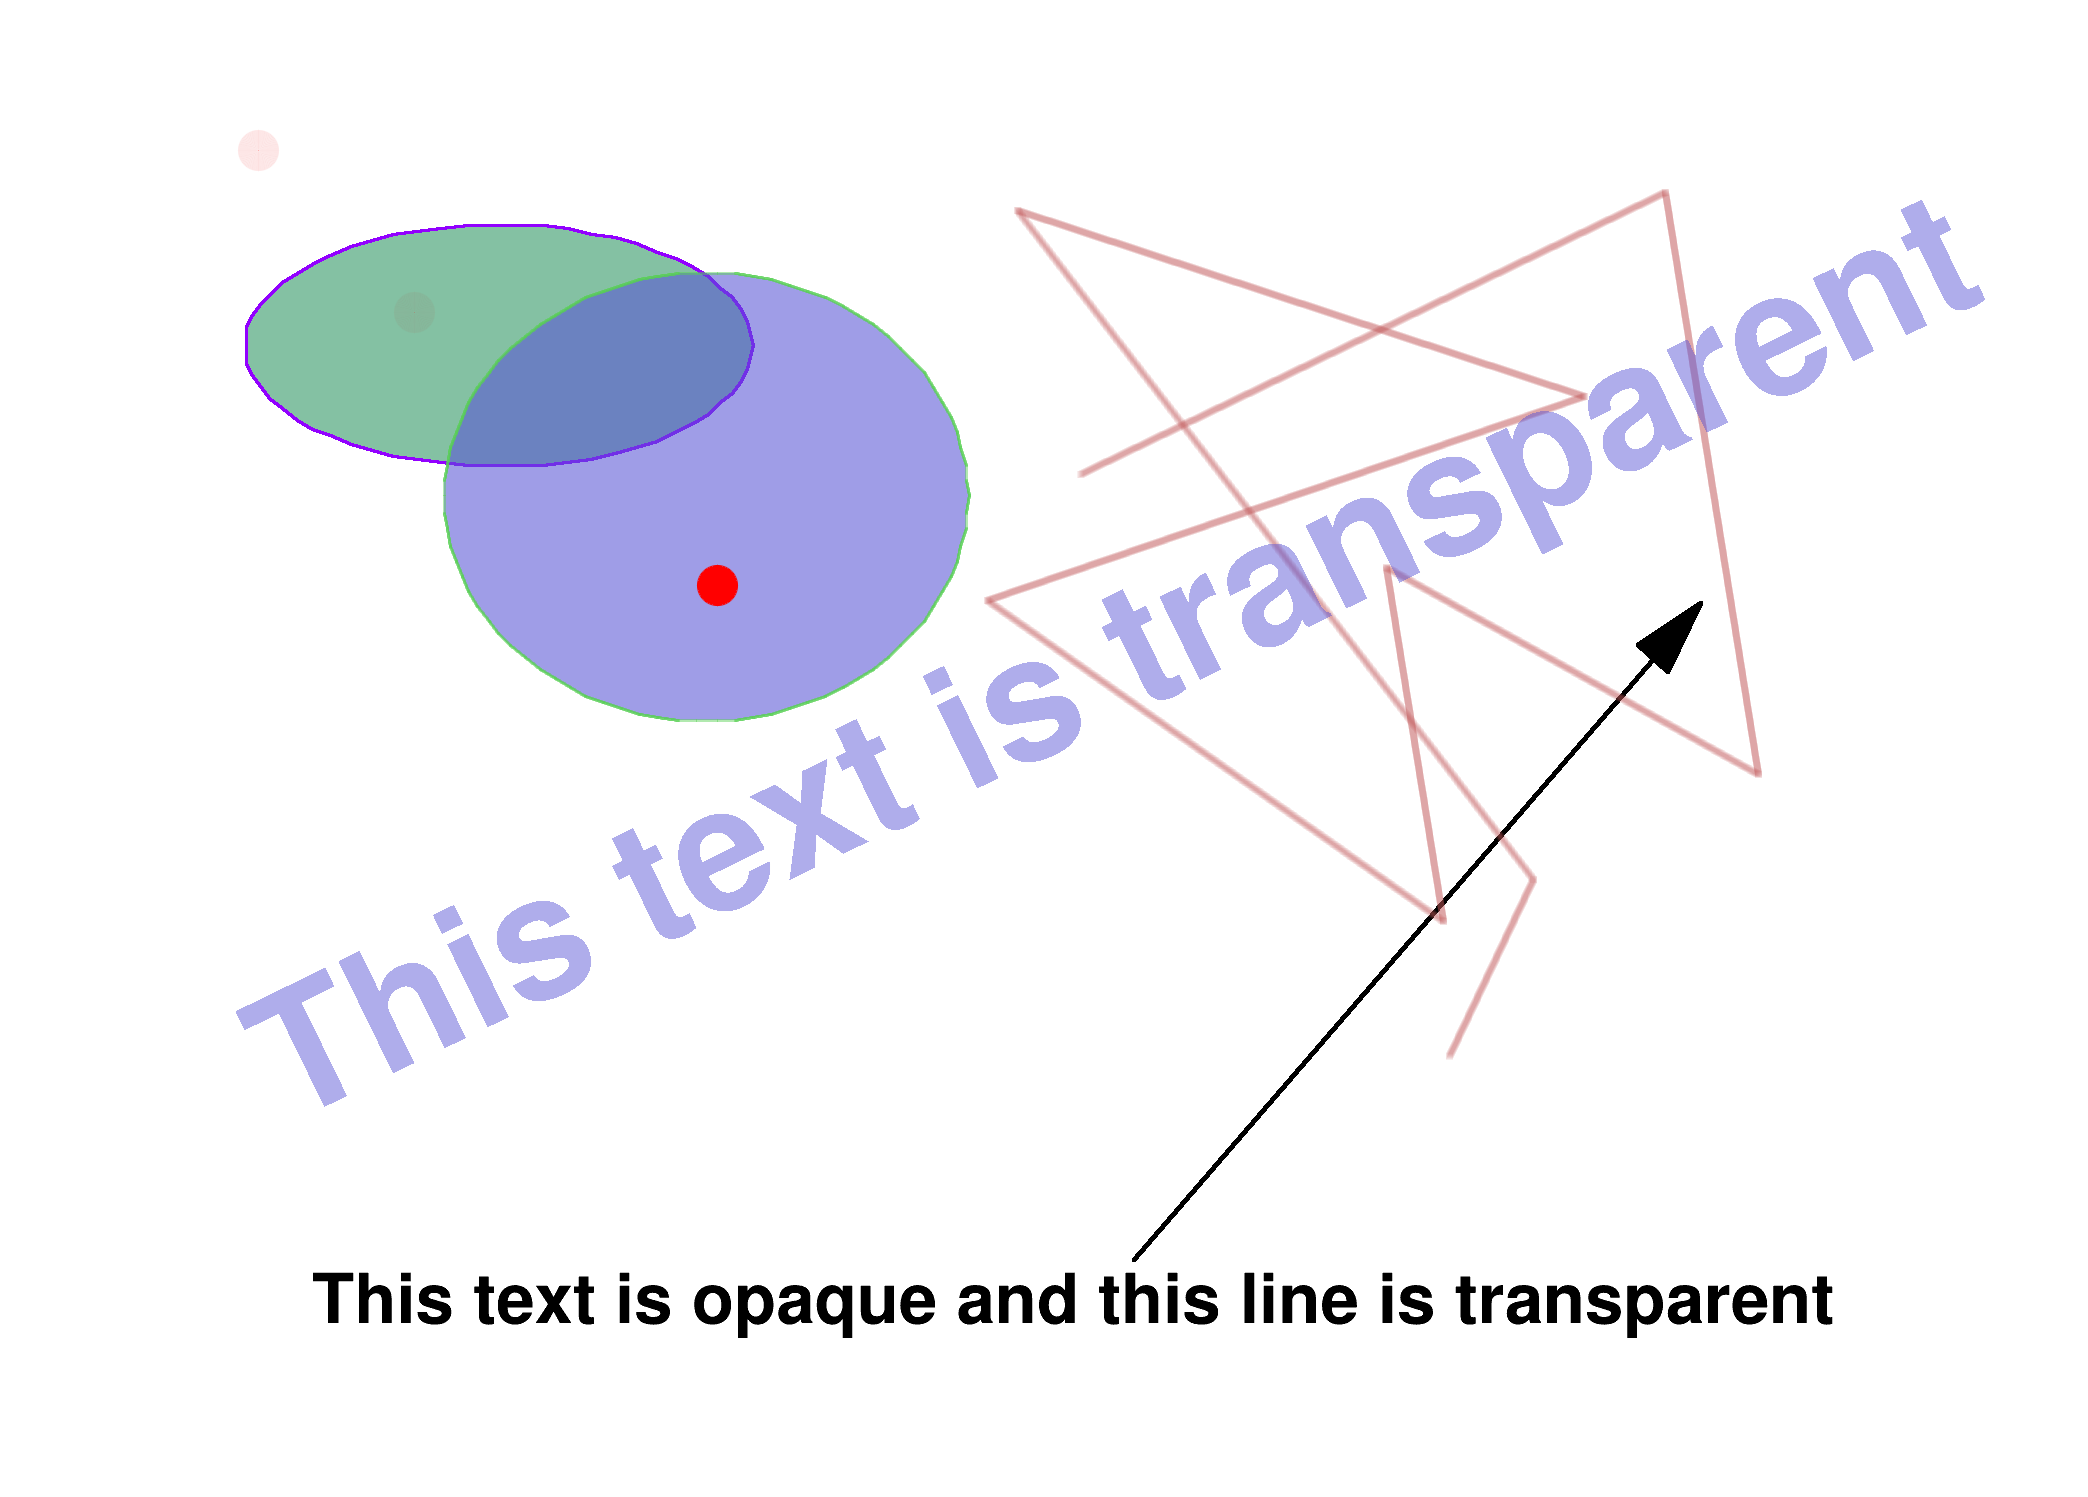
It is done by specifying the alpha value of a given color. For instance
changes the ellipse fill color to the index 9 with an alpha value of 0.571. 0. would be fully transparent (invisible) and 1. completely opaque (the default).
void transparency()
{
auto *
c1 =
new TCanvas(
"c1",
"c1",224,330,700,527);
c1->Range(-0.125,-0.125,1.125,1.125);
auto tex =
new TLatex(0.06303724,0.0194223,
"This text is opaque and this line is transparent");
tex->SetLineWidth(2);
tex->Draw();
auto arrow =
new TArrow(0.5555158,0.07171314,0.8939828,0.6195219,0.05,
"|>");
0.5232808, 0.8724928, 0.9280086, 0.7059456, 0.7399714,
0.4659742, 0.8241404, 0.4838825, 0.7936963, 0.743553};
0.7290837, 0.9631474, 0.4775896, 0.6494024, 0.3555777,
0.622012, 0.7938247, 0.9482072, 0.3904382, 0.2410359};
graph->SetLineColorAlpha(46, 0.1);
TEllipse *ellipse =
new TEllipse(0.1740688,0.8352632,0.1518625,0.1010526,0,360,0);
ellipse =
new TEllipse(0.2985315,0.7092105,0.1566977,0.1868421,0,360,0);
tex =
new TLatex(0.04871059,0.1837649,
"This text is transparent");
tex->SetTextColorAlpha(9, 0.476);
tex->SetTextSize(0.125);
tex->SetTextAngle(26.0);
tex->Draw();
auto marker =
new TMarker(0.03080229,0.998008,20);
marker->SetMarkerColorAlpha(2, .3);
marker->SetMarkerStyle(20);
marker->SetMarkerSize(1.7);
marker->Draw();
marker =
new TMarker(0.1239255,0.8635458,20);
marker->SetMarkerColorAlpha(2, .2);
marker->SetMarkerStyle(20);
marker->SetMarkerSize(1.7);
marker->Draw();
marker =
new TMarker(0.3047994,0.6344622,20);
marker->SetMarkerColor(2);
marker->SetMarkerStyle(20);
marker->SetMarkerSize(1.7);
marker->Draw();
}
Draw all kinds of Arrows.
virtual void SetFillColor(Color_t fcolor)
Set the fill area color.
virtual void SetFillColorAlpha(Color_t fcolor, Float_t falpha)
Set a transparent fill color.
virtual void SetLineWidth(Width_t lwidth)
Set the line width.
virtual void SetLineColorAlpha(Color_t lcolor, Float_t lalpha)
Set a transparent line color.
virtual void SetLineColor(Color_t lcolor)
Set the line color.
virtual void Draw(Option_t *option="")
Draw this ellipse with its current attributes.
A Graph is a graphics object made of two arrays X and Y with npoints each.
To draw Mathematical Formula.


 This macro demonstrates the use of color transparency.