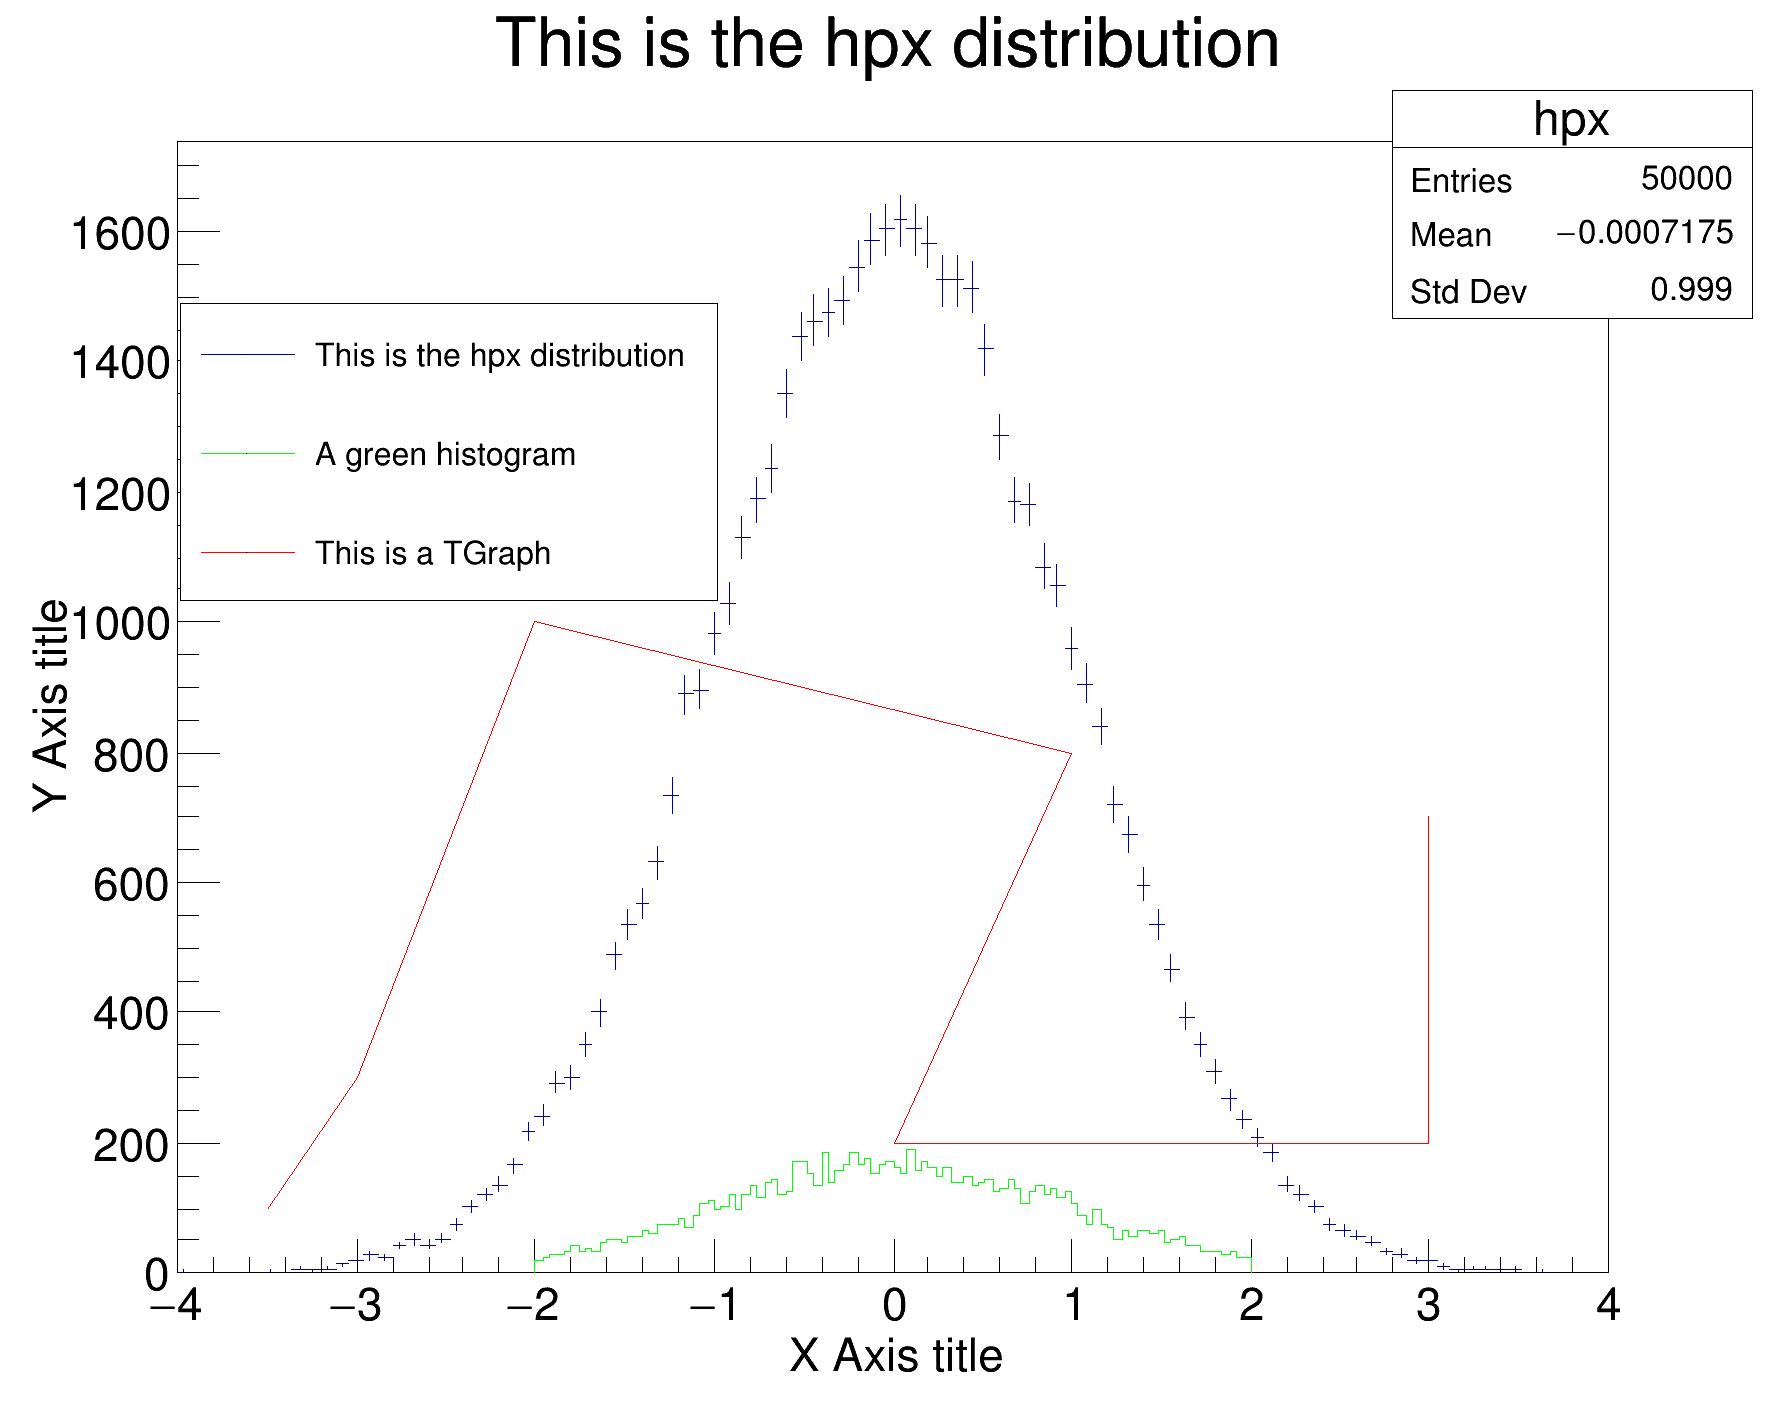
 The legend can be placed automatically in the current pad in an empty space found at painting time.
The following example illustrate this facility. Only the width and height of the legend is specified in percentage of the pad size.

void legendautoplaced()
{
auto c4 =
new TCanvas(
"c",
"c", 600,500);
auto hpx =
new TH1D(
"hpx",
"This is the hpx distribution",100,-4.,4.);
hpx->FillRandom("gaus", 50000);
hpx->Draw("E");
hpx->GetYaxis()->SetTitle("Y Axis title");
hpx->GetYaxis()->SetTitleOffset(1.3); hpx->GetYaxis()->CenterTitle(true);
hpx->GetXaxis()->SetTitle("X Axis title");
hpx->GetXaxis()->CenterTitle(true);
auto h1 =
new TH1D(
"h1",
"A green histogram",100,-2.,2.);
g->SetPoint(0, -3.5, 100 );
g->SetPoint(1, -3.0, 300 );
g->SetPoint(2, -2.0, 1000 );
g->SetPoint(3, 1.0, 800 );
g->SetPoint(4, 0.0, 200 );
g->SetPoint(5, 3.0, 200 );
g->SetPoint(6, 3.0, 700 );
g->SetTitle(
"This is a TGraph");
c4->BuildLegend();
}
virtual void SetLineColor(Color_t lcolor)
Set the line color.
A Graph is a graphics object made of two arrays X and Y with npoints each.
1-D histogram with a double per channel (see TH1 documentation)}
virtual void FillRandom(const char *fname, Int_t ntimes=5000)
Fill histogram following distribution in function fname.
virtual void Draw(Option_t *option="")
Draw this histogram with options.
- Author
- Olivier Couet
Definition in file legendautoplaced.C.


 The legend can be placed automatically in the current pad in an empty space found at painting time.