Logo ROOT   6.16/01
Reference Guide
graphpalettecolor.C File Reference

Detailed Description

View in nbviewer Open in SWAN Palette coloring for graphs is activated thanks to the options PFC (Palette Fill Color), PLC (Palette Line Color) and AMC (Palette Marker Color).

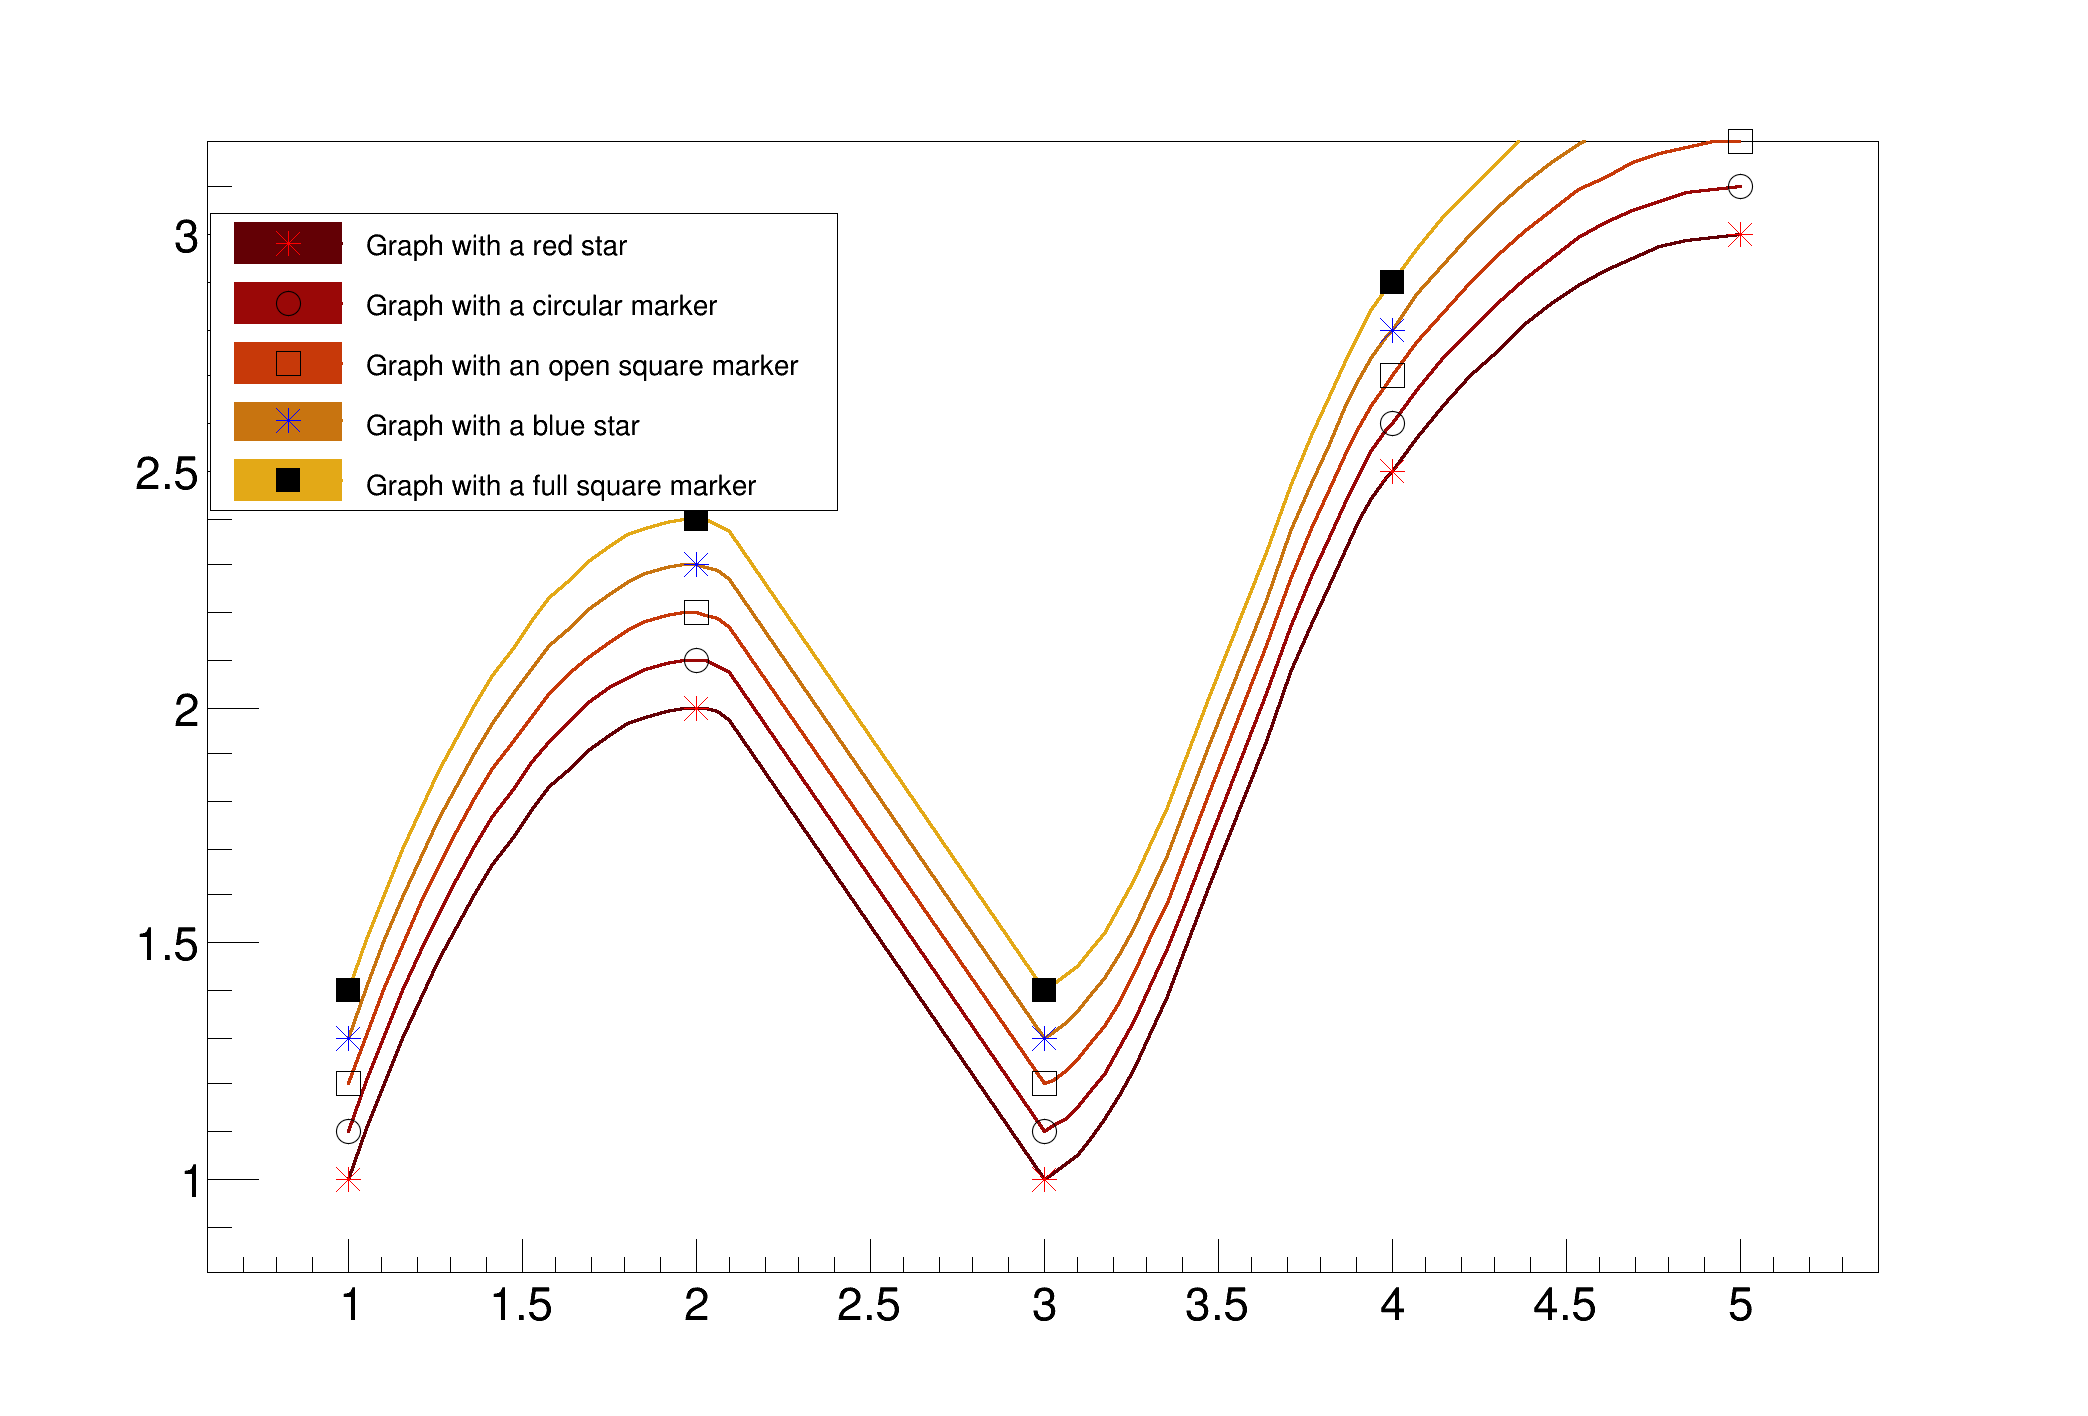
When one of these options is given to TGraph::Draw the TGraph get its color from the current color palette defined by gStyle->SetPalette(…). The color is determined according to the number of objects having palette coloring in the current pad.

In this example five graphs are displayed with palette coloring for lines and and filled area. The graphs are drawn with curves (C option) and one can see the color of each graph is picked inside the palette kSolar. The same is visible on filled polygons in the automatically built legend.
void graphpalettecolor () {
double x[5] = {1,2,3,4,5};
double y1[5] = {1.0,2.0,1.0,2.5,3.0};
double y2[5] = {1.1,2.1,1.1,2.6,3.1};
double y3[5] = {1.2,2.2,1.2,2.7,3.2};
double y4[5] = {1.3,2.3,1.3,2.8,3.3};
double y5[5] = {1.4,2.4,1.4,2.9,3.4};
TGraph *g1 = new TGraph(5,x,y1); g1->SetTitle("Graph with a red star");
TGraph *g2 = new TGraph(5,x,y2); g2->SetTitle("Graph with a circular marker");
TGraph *g3 = new TGraph(5,x,y3); g3->SetTitle("Graph with an open square marker");
TGraph *g4 = new TGraph(5,x,y4); g4->SetTitle("Graph with a blue star");
TGraph *g5 = new TGraph(5,x,y5); g5->SetTitle("Graph with a full square marker");
g1->Draw("CA* PLC PFC");
g2->Draw("PC PLC PFC");
g3->Draw("PC PLC PFC");
g4->Draw("*C PLC PFC");
g5->Draw("PC PLC PFC");
gPad->BuildLegend();
}
const Bool_t kFALSE
Definition: RtypesCore.h:88
@ kRed
Definition: Rtypes.h:63
@ kBlue
Definition: Rtypes.h:63
@ kOpenSquare
Definition: TAttMarker.h:49
@ kCircle
Definition: TAttMarker.h:46
@ kFullSquare
Definition: TAttMarker.h:48
@ kSolar
Definition: TColor.h:122
R__EXTERN TStyle * gStyle
Definition: TStyle.h:406
#define gPad
Definition: TVirtualPad.h:286
virtual void SetLineWidth(Width_t lwidth)
Set the line width.
Definition: TAttLine.h:43
virtual void SetMarkerColor(Color_t mcolor=1)
Set the marker color.
Definition: TAttMarker.h:38
virtual void SetMarkerStyle(Style_t mstyle=1)
Set the marker style.
Definition: TAttMarker.h:40
A Graph is a graphics object made of two arrays X and Y with npoints each.
Definition: TGraph.h:41
virtual void SetTitle(const char *title="")
Set graph title.
Definition: TGraph.cxx:2232
virtual void Draw(Option_t *chopt="")
Draw this graph with its current attributes.
Definition: TGraph.cxx:747
void SetOptTitle(Int_t tit=1)
Definition: TStyle.h:312
void SetPalette(Int_t ncolors=kBird, Int_t *colors=0, Float_t alpha=1.)
See TColor::SetPalette.
Definition: TStyle.cxx:1637
Double_t x[n]
Definition: legend1.C:17
Author
Olivier Couet

Definition in file graphpalettecolor.C.