void rf708_bphysics()
{
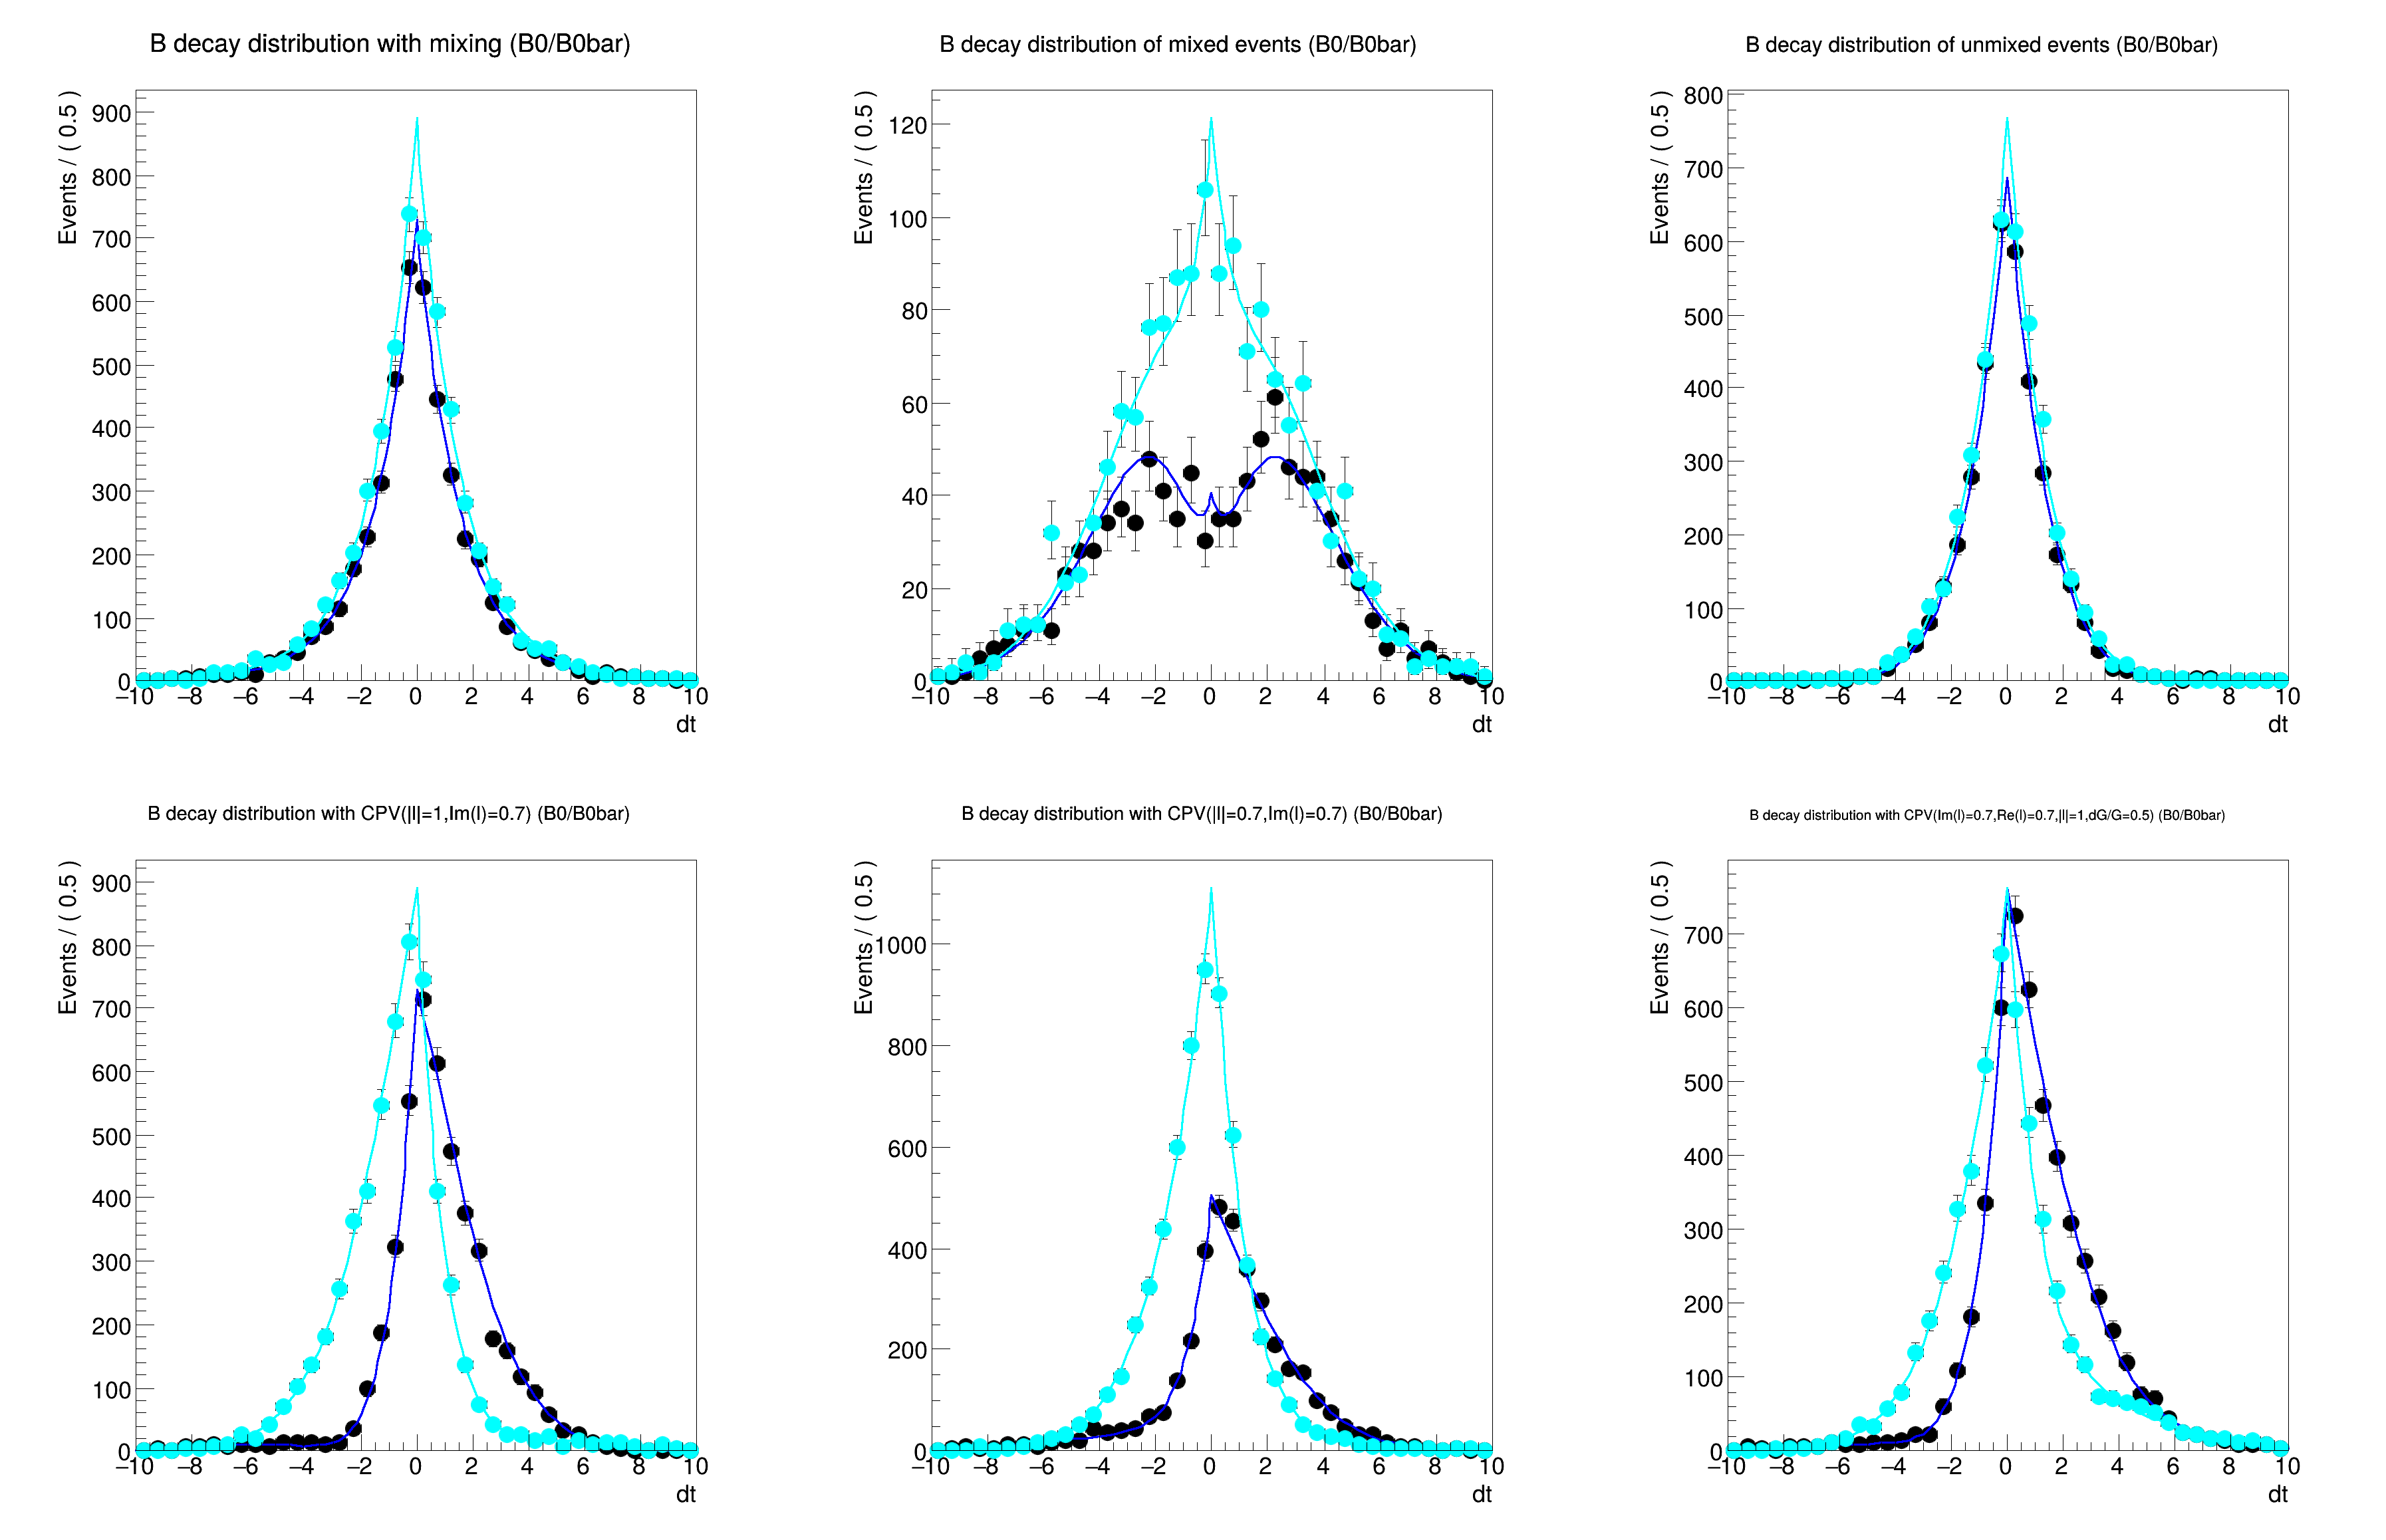
RooBMixDecay bmix(
"bmix",
"decay",
dt,
mixState,
tagFlav, tau, dm,
w,
dw,
truthModel,
RooBMixDecay::DoubleSided);
data->plotOn(
frame2,
Cut(
"mixState==mixState::mixed&&tagFlav==tagFlav::B0"));
data->plotOn(
frame3,
Cut(
"mixState==mixState::unmixed&&tagFlav==tagFlav::B0"));
RooBCPEffDecay bcp(
"bcp",
"bcp",
dt,
tagFlav, tau, dm,
w,
CPeigen,
absLambda,
argLambda,
effR,
dw,
truthModel,
RooBDecay bcpg(
"bcpg",
"bcpg",
dt, tau,
DG,
RooConst(1),
fsinh,
fcos,
fsin, dm,
truthModel,
RooBDecay::DoubleSided);
RooPlot *
frame6 =
dt.frame(
Title(
"B decay distribution with CPV(Im(l)=0.7,Re(l)=0.7,|l|=1,dG/G=0.5) (B0/B0bar)"));
gPad->SetLeftMargin(0.15);
frame1->GetYaxis()->SetTitleOffset(1.6);
gPad->SetLeftMargin(0.15);
frame2->GetYaxis()->SetTitleOffset(1.6);
gPad->SetLeftMargin(0.15);
frame3->GetYaxis()->SetTitleOffset(1.6);
gPad->SetLeftMargin(0.15);
frame4->GetYaxis()->SetTitleOffset(1.6);
gPad->SetLeftMargin(0.15);
frame5->GetYaxis()->SetTitleOffset(1.6);
gPad->SetLeftMargin(0.15);
frame6->GetYaxis()->SetTitleOffset(1.6);
}
ROOT::Detail::TRangeCast< T, true > TRangeDynCast
TRangeDynCast is an adapter class that allows the typed iteration through a TCollection.
Option_t Option_t TPoint TPoint const char GetTextMagnitude GetFillStyle GetLineColor GetLineWidth GetMarkerStyle GetTextAlign GetTextColor GetTextSize void data
RooArgList is a container object that can hold multiple RooAbsArg objects.
PDF describing decay time distribution of B meson including effects of standard model CP violation.
Most general description of B decay time distribution with effects of CP violation,...
Class RooBMixDecay is a RooAbsAnaConvPdf implementation that describes the decay of B mesons with the...
Object to represent discrete states.
Plot frame and a container for graphics objects within that frame.
Variable that can be changed from the outside.
Implements a RooResolution model that corresponds to a delta function.
RooConstVar & RooConst(double val)
RooCmdArg LineColor(TColorNumber color)
RooCmdArg MarkerColor(TColorNumber color)
RooCmdArg Cut(const char *cutSpec)
T Slice(const T &histo, std::vector< Int_t > &args)
Creates a sliced copy of the given histogram.
The namespace RooFit contains mostly switches that change the behaviour of functions of PDFs (or othe...
[#1] INFO:Plotting -- RooTreeData::plotOn: plotting 4542 events out of 10000 total events
[#1] INFO:Plotting -- RooAbsReal::plotOn(bmix) plot on dt represents a slice in (tagFlav)
[#1] INFO:Plotting -- RooAbsReal::plotOn(bmix) plot on dt integrates over variables (mixState)
[#1] INFO:Plotting -- RooTreeData::plotOn: plotting 5458 events out of 10000 total events
[#1] INFO:Plotting -- RooAbsReal::plotOn(bmix) plot on dt represents a slice in (tagFlav)
[#1] INFO:Plotting -- RooAbsReal::plotOn(bmix) plot on dt integrates over variables (mixState)
[#1] INFO:Plotting -- RooTreeData::plotOn: plotting 933 events out of 10000 total events
[#1] INFO:Plotting -- RooAbsReal::plotOn(bmix) plot on dt represents a slice in (mixState,tagFlav)
[#1] INFO:Plotting -- RooTreeData::plotOn: plotting 1461 events out of 10000 total events
[#1] INFO:Plotting -- RooAbsReal::plotOn(bmix) plot on dt represents a slice in (mixState,tagFlav)
[#1] INFO:Plotting -- RooTreeData::plotOn: plotting 3609 events out of 10000 total events
[#1] INFO:Plotting -- RooAbsReal::plotOn(bmix) plot on dt represents a slice in (mixState,tagFlav)
[#1] INFO:Plotting -- RooTreeData::plotOn: plotting 3997 events out of 10000 total events
[#1] INFO:Plotting -- RooAbsReal::plotOn(bmix) plot on dt represents a slice in (mixState,tagFlav)
[#1] INFO:Plotting -- RooTreeData::plotOn: plotting 4495 events out of 10000 total events
[#1] INFO:Plotting -- RooAbsReal::plotOn(bcp) plot on dt represents a slice in (tagFlav)
[#1] INFO:Plotting -- RooTreeData::plotOn: plotting 5505 events out of 10000 total events
[#1] INFO:Plotting -- RooAbsReal::plotOn(bcp) plot on dt represents a slice in (tagFlav)
[#1] INFO:Plotting -- RooTreeData::plotOn: plotting 3617 events out of 10000 total events
[#1] INFO:Plotting -- RooAbsReal::plotOn(bcp) plot on dt represents a slice in (tagFlav)
[#1] INFO:Plotting -- RooTreeData::plotOn: plotting 6383 events out of 10000 total events
[#1] INFO:Plotting -- RooAbsReal::plotOn(bcp) plot on dt represents a slice in (tagFlav)
[#1] INFO:Plotting -- RooTreeData::plotOn: plotting 4991 events out of 10000 total events
[#1] INFO:Plotting -- RooAbsReal::plotOn(bcpg) plot on dt represents a slice in (tagFlav)
[#1] INFO:Plotting -- RooTreeData::plotOn: plotting 5009 events out of 10000 total events
[#1] INFO:Plotting -- RooAbsReal::plotOn(bcpg) plot on dt represents a slice in (tagFlav)