Logo ROOT  
Reference Guide
 
Loading...
Searching...
No Matches
rf701_efficiencyfit.py File Reference

Detailed Description

View in nbviewer Open in SWAN
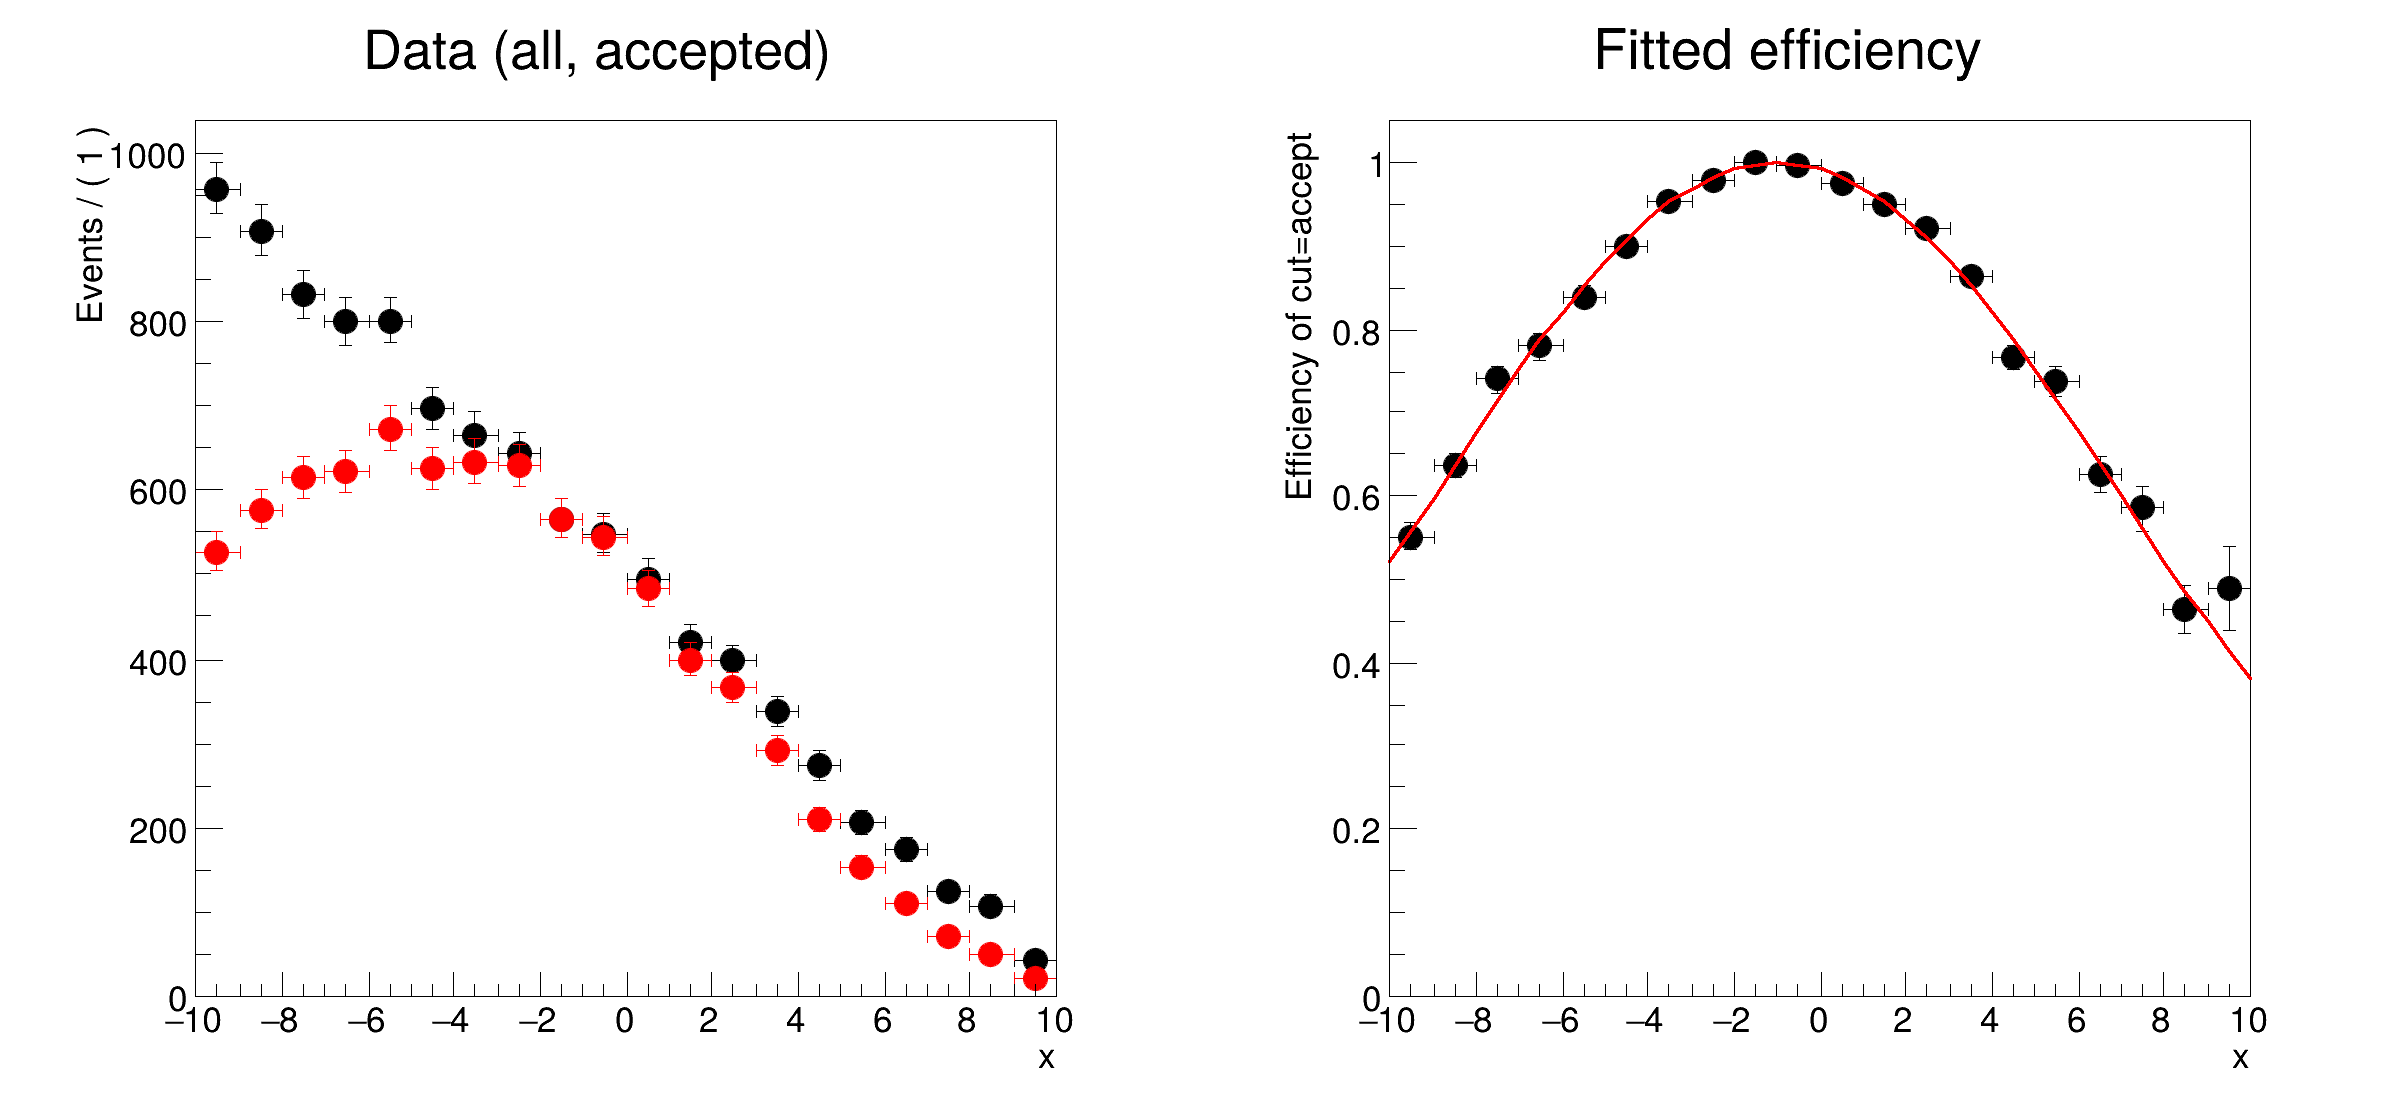
Special pdf's: unbinned maximum likelihood fit of an efficiency eff(x) function to a dataset D(x,cut), cut is a category encoding a selection, which the efficiency as function of x should be described by eff(x)

import ROOT
# Construct efficiency function e(x)
# -------------------------------------------------------------------
# Declare variables x,mean, with associated name, title, value and allowed
# range
x = ROOT.RooRealVar("x", "x", -10, 10)
# Efficiency function eff(x;a,b)
a = ROOT.RooRealVar("a", "a", 0.4, 0, 1)
b = ROOT.RooRealVar("b", "b", 5)
c = ROOT.RooRealVar("c", "c", -1, -10, 10)
effFunc = ROOT.RooFormulaVar("effFunc", "(1-a)+a*cos((x-c)/b)", [a, b, c, x])
# Construct conditional efficiency pdf E(cut|x)
# ------------------------------------------------------------------------------------------
# Acceptance state cut (1 or 0)
cut = ROOT.RooCategory("cut", "cutr", {"accept": 1, "reject": 0})
# Construct efficiency pdf eff(cut|x)
effPdf = ROOT.RooEfficiency("effPdf", "effPdf", effFunc, cut, "accept")
# Generate data (x, cut) from a toy model
# -----------------------------------------------------------------------------
# Construct global shape pdf shape(x) and product model(x,cut) = eff(cut|x)*shape(x)
# (These are _only_ needed to generate some toy MC here to be used later)
shapePdf = ROOT.RooPolynomial("shapePdf", "shapePdf", x, [-0.095])
model = ROOT.RooProdPdf("model", "model", {shapePdf}, Conditional=({effPdf}, {cut}))
# Generate some toy data from model
data = model.generate({x, cut}, 10000)
# Fit conditional efficiency pdf to data
# --------------------------------------------------------------------------
# Fit conditional efficiency pdf to data
effPdf.fitTo(data, ConditionalObservables={x}, PrintLevel=-1)
# Plot fitted, data efficiency
# --------------------------------------------------------
# Plot distribution of all events and accepted fraction of events on frame
frame1 = x.frame(Bins=20, Title="Data (all, accepted)")
data.plotOn(frame1)
data.plotOn(frame1, Cut="cut==cut::accept", MarkerColor="r", LineColor="r")
# Plot accept/reject efficiency on data overlay fitted efficiency curve
frame2 = x.frame(Bins=20, Title="Fitted efficiency")
data.plotOn(frame2, Efficiency=cut) # needs ROOT version >= 5.21
effFunc.plotOn(frame2, LineColor="r")
# Draw all frames on a canvas
ca = ROOT.TCanvas("rf701_efficiency", "rf701_efficiency", 800, 400)
ca.Divide(2)
ca.cd(1)
ROOT.gPad.SetLeftMargin(0.15)
frame1.GetYaxis().SetTitleOffset(1.6)
frame1.Draw()
ca.cd(2)
ROOT.gPad.SetLeftMargin(0.15)
frame2.GetYaxis().SetTitleOffset(1.4)
frame2.Draw()
ca.SaveAs("rf701_efficiencyfit.png")
[#1] INFO:Fitting -- RooAbsPdf::fitTo(effPdf_over_effPdf_Int[cut]) fixing normalization set for coefficient determination to observables in data
[#1] INFO:Fitting -- using CPU computation library compiled with -mavx2
[#1] INFO:Fitting -- RooAddition::defaultErrorLevel(nll_effPdf_over_effPdf_Int[cut]_modelData) Summation contains a RooNLLVar, using its error level
[#1] INFO:Minimization -- RooAbsMinimizerFcn::setOptimizeConst: activating const optimization
[#1] INFO:Minimization -- RooAbsMinimizerFcn::setOptimizeConst: deactivating const optimization
[#1] INFO:Plotting -- RooTreeData::plotOn: plotting 8176 events out of 10000 total events
Date
February 2018
Authors
Clemens Lange, Wouter Verkerke (C++ version)

Definition in file rf701_efficiencyfit.py.