Logo ROOT  
Reference Guide
 
Loading...
Searching...
No Matches
rf316_llratioplot.C File Reference

Detailed Description

View in nbviewer Open in SWAN
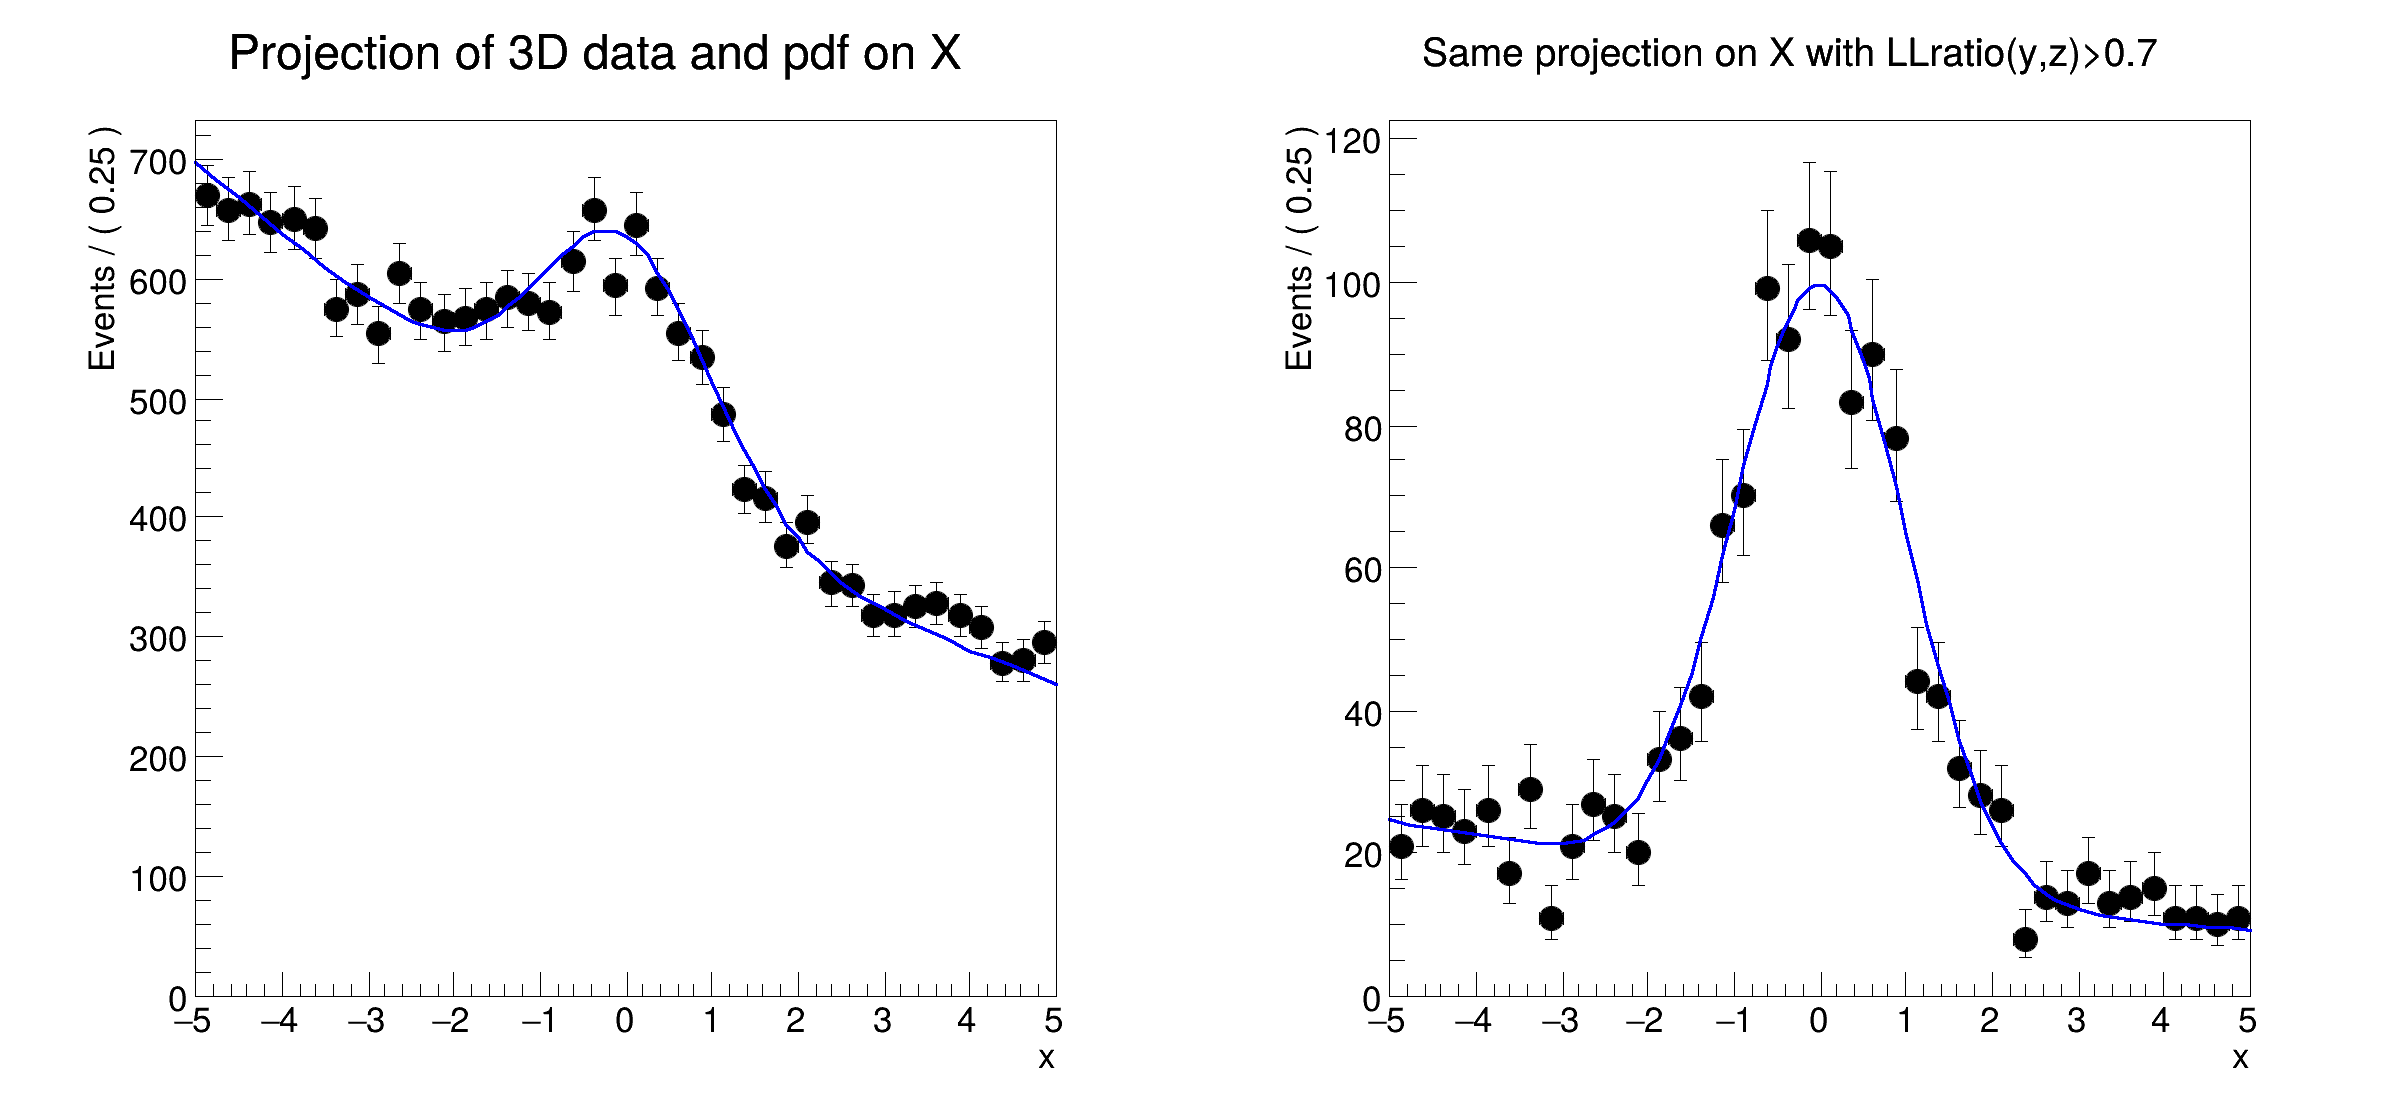
Multidimensional models: using the likelihood ratio technique to construct a signal enhanced one-dimensional projection of a multi-dimensional pdf

#include "RooRealVar.h"
#include "RooDataSet.h"
#include "RooGaussian.h"
#include "RooPolynomial.h"
#include "RooAddPdf.h"
#include "RooProdPdf.h"
#include "TCanvas.h"
#include "TAxis.h"
#include "RooPlot.h"
using namespace RooFit;
{
// C r e a t e 3 D p d f a n d d a t a
// -------------------------------------------
// Create observables
RooRealVar x("x", "x", -5, 5);
RooRealVar y("y", "y", -5, 5);
RooRealVar z("z", "z", -5, 5);
// Create signal pdf gauss(x)*gauss(y)*gauss(z)
RooGaussian gx("gx", "gx", x, 0.0, 1.0);
RooGaussian gy("gy", "gy", y, 0.0, 1.0);
RooGaussian gz("gz", "gz", z, 0.0, 1.0);
RooProdPdf sig("sig", "sig", RooArgSet(gx, gy, gz));
// Create background pdf poly(x)*poly(y)*poly(z)
RooPolynomial px("px", "px", x, RooArgSet(-0.1, 0.004));
RooPolynomial py("py", "py", y, RooArgSet(0.1, -0.004));
RooPolynomial pz("pz", "pz", z);
RooProdPdf bkg("bkg", "bkg", RooArgSet(px, py, pz));
// Create composite pdf sig+bkg
RooRealVar fsig("fsig", "signal fraction", 0.1, 0., 1.);
RooAddPdf model("model", "model", RooArgList(sig, bkg), fsig);
std::unique_ptr<RooDataSet> data{model.generate({x, y, z}, 20000)};
// P r o j e c t p d f a n d d a t a o n x
// -------------------------------------------------
// Make plain projection of data and pdf on x observable
RooPlot *frame = x.frame(Title("Projection of 3D data and pdf on X"), Bins(40));
data->plotOn(frame);
model.plotOn(frame);
// D e f i n e p r o j e c t e d s i g n a l l i k e l i h o o d r a t i o
// ----------------------------------------------------------------------------------
// Calculate projection of signal and total likelihood on (y,z) observables
// i.e. integrate signal and composite model over x
RooAbsPdf *sigyz = sig.createProjection(x);
RooAbsPdf *totyz = model.createProjection(x);
// Construct the log of the signal / signal+background probability
RooFormulaVar llratio_func("llratio", "log10(@0)-log10(@1)", RooArgList(*sigyz, *totyz));
// P l o t d a t a w i t h a L L r a t i o c u t
// -------------------------------------------------------
// Calculate the llratio value for each event in the dataset
data->addColumn(llratio_func);
// Extract the subset of data with large signal likelihood
std::unique_ptr<RooAbsData> dataSel{data->reduce(Cut("llratio>0.7"))};
// Make plot frame
RooPlot *frame2 = x.frame(Title("Same projection on X with LLratio(y,z)>0.7"), Bins(40));
// Plot select data on frame
dataSel->plotOn(frame2);
// M a k e M C p r o j e c t i o n o f p d f w i t h s a m e L L r a t i o c u t
// ---------------------------------------------------------------------------------------------
// Generate large number of events for MC integration of pdf projection
std::unique_ptr<RooDataSet> mcprojData{model.generate({x, y, z}, 10000)};
// Calculate LL ratio for each generated event and select MC events with llratio)0.7
mcprojData->addColumn(llratio_func);
std::unique_ptr<RooAbsData> mcprojDataSel{mcprojData->reduce(Cut("llratio>0.7"))};
// Project model on x, integrating projected observables (y,z) with Monte Carlo technique
// on set of events with the same llratio cut as was applied to data
model.plotOn(frame2, ProjWData(*mcprojDataSel));
TCanvas *c = new TCanvas("rf316_llratioplot", "rf316_llratioplot", 800, 400);
c->Divide(2);
c->cd(1);
gPad->SetLeftMargin(0.15);
frame->GetYaxis()->SetTitleOffset(1.4);
frame->Draw();
c->cd(2);
gPad->SetLeftMargin(0.15);
frame2->GetYaxis()->SetTitleOffset(1.4);
frame2->Draw();
}
#define c(i)
Definition RSha256.hxx:101
Option_t Option_t TPoint TPoint const char GetTextMagnitude GetFillStyle GetLineColor GetLineWidth GetMarkerStyle GetTextAlign GetTextColor GetTextSize void data
#define gPad
Abstract interface for all probability density functions.
Definition RooAbsPdf.h:40
virtual RooAbsPdf * createProjection(const RooArgSet &iset)
Return a p.d.f that represent a projection of this p.d.f integrated over given observables.
Efficient implementation of a sum of PDFs of the form.
Definition RooAddPdf.h:33
RooArgList is a container object that can hold multiple RooAbsArg objects.
Definition RooArgList.h:22
RooArgSet is a container object that can hold multiple RooAbsArg objects.
Definition RooArgSet.h:55
A RooFormulaVar is a generic implementation of a real-valued object, which takes a RooArgList of serv...
Plain Gaussian p.d.f.
Definition RooGaussian.h:24
Plot frame and a container for graphics objects within that frame.
Definition RooPlot.h:43
static RooPlot * frame(const RooAbsRealLValue &var, double xmin, double xmax, Int_t nBins)
Create a new frame for a given variable in x.
Definition RooPlot.cxx:237
TAxis * GetYaxis() const
Definition RooPlot.cxx:1276
void Draw(Option_t *options=nullptr) override
Draw this plot and all of the elements it contains.
Definition RooPlot.cxx:649
RooPolynomial implements a polynomial p.d.f of the form.
Efficient implementation of a product of PDFs of the form.
Definition RooProdPdf.h:33
Variable that can be changed from the outside.
Definition RooRealVar.h:37
virtual void SetTitleOffset(Float_t offset=1)
Set distance between the axis and the axis title.
Definition TAttAxis.cxx:298
The Canvas class.
Definition TCanvas.h:23
RooCmdArg Bins(Int_t nbin)
RooCmdArg ProjWData(const RooAbsData &projData, bool binData=false)
RooCmdArg Cut(const char *cutSpec)
Double_t y[n]
Definition legend1.C:17
Double_t x[n]
Definition legend1.C:17
The namespace RooFit contains mostly switches that change the behaviour of functions of PDFs (or othe...
Definition JSONIO.h:26
const char * Title
Definition TXMLSetup.cxx:68
[#1] INFO:Plotting -- RooAbsReal::plotOn(model) plot on x integrates over variables (y,z)
[#1] INFO:InputArguments -- The formula llratio>0.7 claims to use the variables (x,y,z,llratio) but only (llratio) seem to be in use.
inputs: llratio>0.7
[#1] INFO:InputArguments -- The formula llratio>0.7 claims to use the variables (x,y,z,llratio) but only (llratio) seem to be in use.
inputs: llratio>0.7
[#1] INFO:Plotting -- RooAbsReal::plotOn(model) plot on x averages using data variables (y,z)
[#1] INFO:Plotting -- RooAbsReal::plotOn(model) only the following components of the projection data will be used: (y,z)
[#1] INFO:Fitting -- using CPU computation library compiled with -mavx2
Date
July 2008
Author
Wouter Verkerke

Definition in file rf316_llratioplot.C.