Logo ROOT  
Reference Guide
 
Loading...
Searching...
No Matches
rf305_condcorrprod.py File Reference

Detailed Description

View in nbviewer Open in SWAN
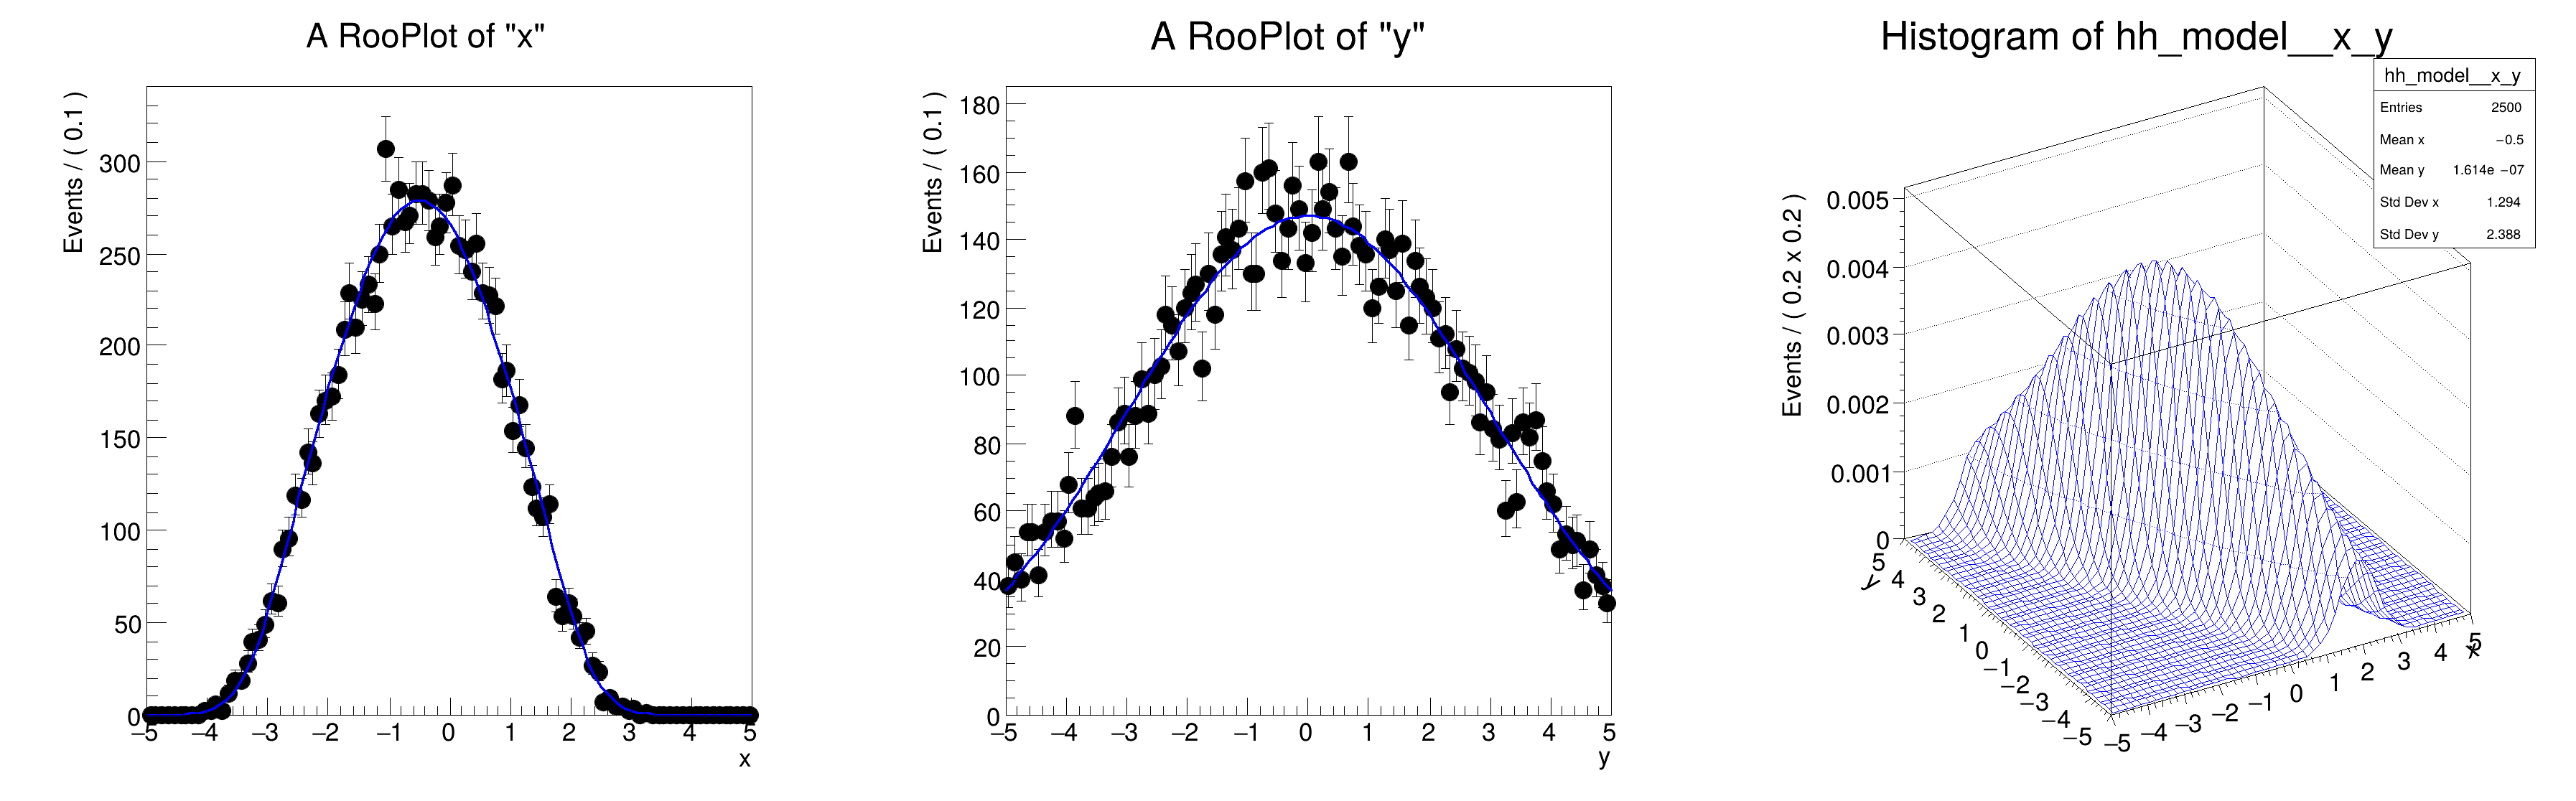
Multidimensional models: multi-dimensional pdfs with conditional pdfs in product

pdf = gauss(x,f(y),sx | y ) * gauss(y,ms,sx) with f(y) = a0 + a1*y

import ROOT
# Create conditional pdf gx(x|y)
# -----------------------------------------------------------
# Create observables
x = ROOT.RooRealVar("x", "x", -5, 5)
y = ROOT.RooRealVar("y", "y", -5, 5)
# Create function f(y) = a0 + a1*y
a0 = ROOT.RooRealVar("a0", "a0", -0.5, -5, 5)
a1 = ROOT.RooRealVar("a1", "a1", -0.5, -1, 1)
fy = ROOT.RooPolyVar("fy", "fy", y, [a0, a1])
# Create gaussx(x,f(y),sx)
sigmax = ROOT.RooRealVar("sigma", "width of gaussian", 0.5)
gaussx = ROOT.RooGaussian("gaussx", "Gaussian in x with shifting mean in y", x, fy, sigmax)
# Create pdf gy(y)
# -----------------------------------------------------------
# Create gaussy(y,0,5)
gaussy = ROOT.RooGaussian("gaussy", "Gaussian in y", y, 0.0, 3.0)
# Create product gx(x|y)*gy(y)
# -------------------------------------------------------
# Create gaussx(x,sx|y) * gaussy(y)
model = ROOT.RooProdPdf("model", "gaussx(x|y)*gaussy(y)", {gaussy}, Conditional=({gaussx}, {x}))
# Sample, fit and plot product pdf
# ---------------------------------------------------------------
# Generate 1000 events in x and y from model
data = model.generate({x, y}, 10000)
# Plot x distribution of data and projection of model x = Int(dy)
# model(x,y)
xframe = x.frame()
data.plotOn(xframe)
model.plotOn(xframe)
# Plot x distribution of data and projection of model y = Int(dx)
# model(x,y)
yframe = y.frame()
data.plotOn(yframe)
model.plotOn(yframe)
# Make two-dimensional plot in x vs y
hh_model = model.createHistogram("hh_model", x, ROOT.RooFit.Binning(50), ROOT.RooFit.YVar(y, ROOT.RooFit.Binning(50)))
hh_model.SetLineColor(ROOT.kBlue)
# Make canvas and draw ROOT.RooPlots
c = ROOT.TCanvas("rf305_condcorrprod", "rf05_condcorrprod", 1200, 400)
c.Divide(3)
c.cd(1)
ROOT.gPad.SetLeftMargin(0.15)
xframe.GetYaxis().SetTitleOffset(1.6)
xframe.Draw()
c.cd(2)
ROOT.gPad.SetLeftMargin(0.15)
yframe.GetYaxis().SetTitleOffset(1.6)
yframe.Draw()
c.cd(3)
ROOT.gPad.SetLeftMargin(0.20)
hh_model.GetZaxis().SetTitleOffset(2.5)
hh_model.Draw("surf")
c.SaveAs("rf305_condcorrprod.png")
[#0] WARNING:InputArguments -- The parameter 'sigma' with range [-inf, inf] of the RooGaussian 'gaussx' exceeds the safe range of (0, inf). Advise to limit its range.
[#1] INFO:Plotting -- RooAbsReal::plotOn(model) plot on x integrates over variables (y)
[#1] INFO:NumericIntegration -- RooRealIntegral::init([gaussy_NORM[y]_X_gaussx_NORM[x]]_Int[y]) using numeric integrator RooIntegrator1D to calculate Int(y)
[#1] INFO:Plotting -- RooAbsReal::plotOn(model) plot on y integrates over variables (x)
Date
February 2018
Authors
Clemens Lange, Wouter Verkerke (C++ version)

Definition in file rf305_condcorrprod.py.