Logo ROOT  
Reference Guide
 
Loading...
Searching...
No Matches
rf205_compplot.py File Reference

Detailed Description

View in nbviewer Open in SWAN
Addition and convolution: options for plotting components of composite pdfs.

import ROOT
# Set up composite pdf
# --------------------------------------
# Declare observable x
x = ROOT.RooRealVar("x", "x", 0, 10)
# Create two Gaussian PDFs g1(x,mean1,sigma) anf g2(x,mean2,sigma) and
# their parameters
mean = ROOT.RooRealVar("mean", "mean of gaussians", 5)
sigma1 = ROOT.RooRealVar("sigma1", "width of gaussians", 0.5)
sigma2 = ROOT.RooRealVar("sigma2", "width of gaussians", 1)
sig1 = ROOT.RooGaussian("sig1", "Signal component 1", x, mean, sigma1)
sig2 = ROOT.RooGaussian("sig2", "Signal component 2", x, mean, sigma2)
# Sum the signal components into a composite signal pdf
sig1frac = ROOT.RooRealVar("sig1frac", "fraction of component 1 in signal", 0.8, 0.0, 1.0)
sig = ROOT.RooAddPdf("sig", "Signal", [sig1, sig2], [sig1frac])
# Build Chebychev polynomial pdf
a0 = ROOT.RooRealVar("a0", "a0", 0.5, 0.0, 1.0)
a1 = ROOT.RooRealVar("a1", "a1", -0.2, 0.0, 1.0)
bkg1 = ROOT.RooChebychev("bkg1", "Background 1", x, [a0, a1])
# Build expontential pdf
alpha = ROOT.RooRealVar("alpha", "alpha", -1)
bkg2 = ROOT.RooExponential("bkg2", "Background 2", x, alpha)
# Sum the background components into a composite background pdf
bkg1frac = ROOT.RooRealVar("bkg1frac", "fraction of component 1 in background", 0.8, 0.0, 1.0)
bkg = ROOT.RooAddPdf("bkg", "Total background", [bkg1, bkg2], [bkg1frac])
# Sum the composite signal and background
bkgfrac = ROOT.RooRealVar("bkgfrac", "fraction of background", 0.5, 0.0, 1.0)
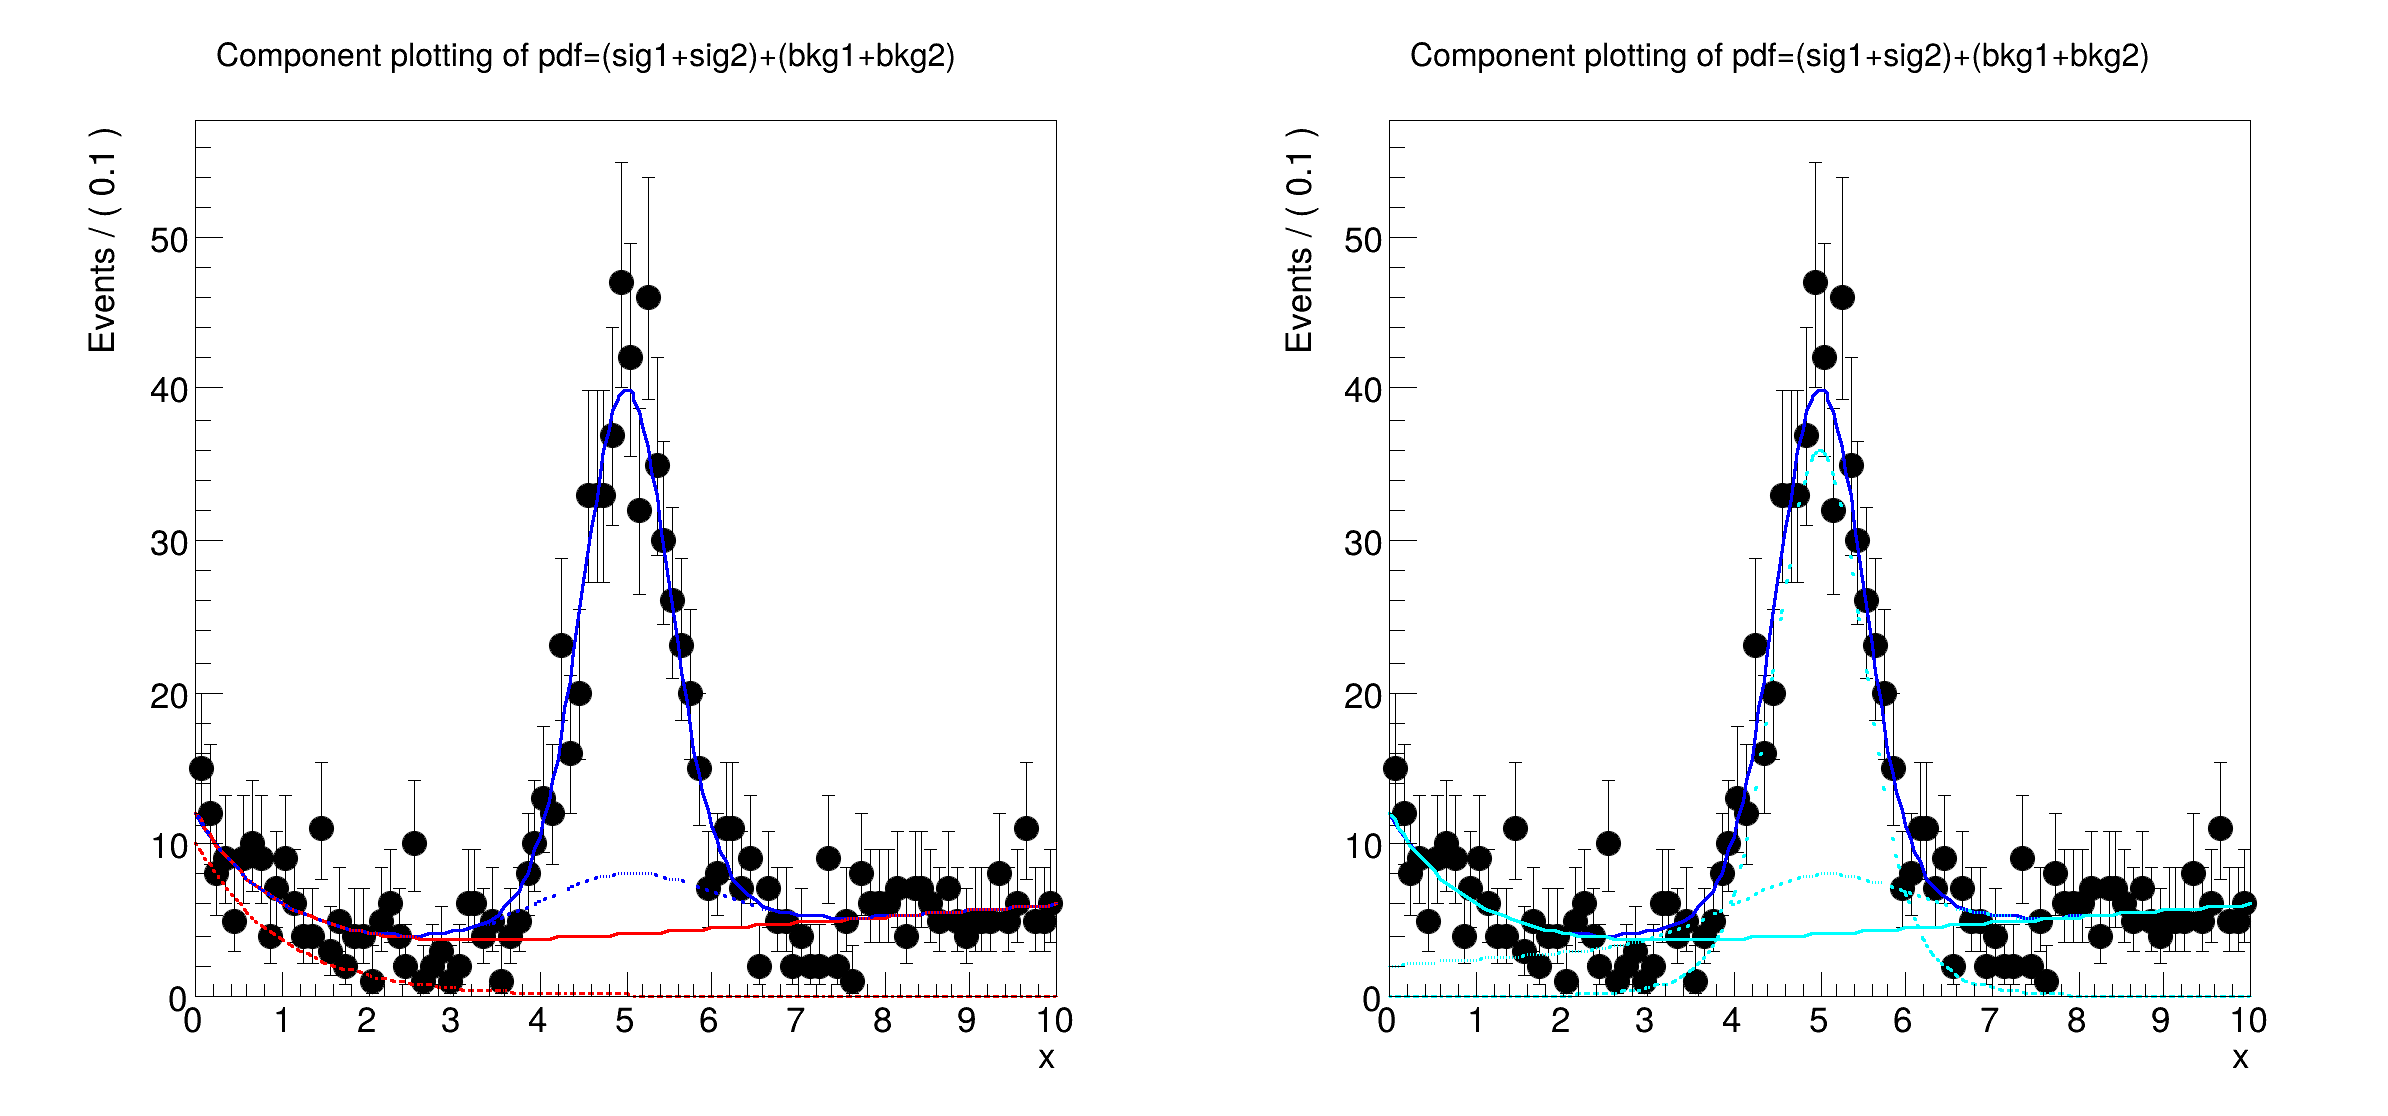
model = ROOT.RooAddPdf("model", "g1+g2+a", [bkg, sig], [bkgfrac])
# Set up basic plot with data and full pdf
# ------------------------------------------------------------------------------
# Generate a data sample of 1000 events in x from model
data = model.generate({x}, 1000)
# Plot data and complete PDF overlaid
xframe = x.frame(Title="Component plotting of pdf=(sig1+sig2)+(bkg1+bkg2)")
data.plotOn(xframe)
model.plotOn(xframe)
# Clone xframe for use below
xframe2 = xframe.Clone("xframe2")
# Make component by object reference
# --------------------------------------------------------------------
# Plot single background component specified by object reference
ras_bkg = {bkg}
model.plotOn(xframe, Components=ras_bkg, LineColor="r")
# Plot single background component specified by object reference
ras_bkg2 = {bkg2}
model.plotOn(xframe, Components=ras_bkg2, LineStyle="--", LineColor="r")
# Plot multiple background components specified by object reference
# Note that specified components may occur at any level in object tree
# (e.g bkg is component of 'model' and 'sig2' is component 'sig')
ras_bkg_sig2 = {bkg, sig2}
model.plotOn(xframe, Components=ras_bkg_sig2, LineStyle=":")
# Make component by name/regexp
# ------------------------------------------------------------
# Plot single background component specified by name
model.plotOn(xframe2, Components="bkg", LineColor="c")
# Plot multiple background components specified by name
model.plotOn(xframe2, Components="bkg1,sig2", LineStyle=":", LineColor="c")
# Plot multiple background components specified by regular expression on
# name
model.plotOn(xframe2, Components="sig*", LineStyle="--", LineColor="c")
# Plot multiple background components specified by multiple regular
# expressions on name
model.plotOn(xframe2, Invisible=True, Components="bkg1,sig*", LineStyle="--", LineColor="y")
# Draw the frame on the canvas
c = ROOT.TCanvas("rf205_compplot", "rf205_compplot", 800, 400)
c.Divide(2)
c.cd(1)
ROOT.gPad.SetLeftMargin(0.15)
xframe.GetYaxis().SetTitleOffset(1.4)
xframe.Draw()
c.cd(2)
ROOT.gPad.SetLeftMargin(0.15)
xframe2.GetYaxis().SetTitleOffset(1.4)
xframe2.Draw()
c.SaveAs("rf205_compplot.png")
[#0] WARNING:InputArguments -- The parameter 'sigma1' with range [-inf, inf] of the RooGaussian 'sig1' exceeds the safe range of (0, inf). Advise to limit its range.
[#0] WARNING:InputArguments -- The parameter 'sigma2' with range [-inf, inf] of the RooGaussian 'sig2' exceeds the safe range of (0, inf). Advise to limit its range.
[#1] INFO:Plotting -- RooAbsPdf::plotOn(model) directly selected PDF components: (bkg)
[#1] INFO:Plotting -- RooAbsPdf::plotOn(model) indirectly selected PDF components: (bkg1,bkg2)
[#1] INFO:Plotting -- RooAbsPdf::plotOn(model) directly selected PDF components: (bkg2)
[#1] INFO:Plotting -- RooAbsPdf::plotOn(model) indirectly selected PDF components: (bkg)
[#1] INFO:Plotting -- RooAbsPdf::plotOn(model) directly selected PDF components: (bkg,sig2)
[#1] INFO:Plotting -- RooAbsPdf::plotOn(model) indirectly selected PDF components: (bkg1,bkg2,sig)
[#1] INFO:Plotting -- RooAbsPdf::plotOn(model) directly selected PDF components: (bkg)
[#1] INFO:Plotting -- RooAbsPdf::plotOn(model) indirectly selected PDF components: (bkg1,bkg2)
[#1] INFO:Plotting -- RooAbsPdf::plotOn(model) directly selected PDF components: (bkg1,sig2)
[#1] INFO:Plotting -- RooAbsPdf::plotOn(model) indirectly selected PDF components: (bkg,sig)
[#1] INFO:Plotting -- RooAbsPdf::plotOn(model) directly selected PDF components: (sig,sig1,sig2)
[#1] INFO:Plotting -- RooAbsPdf::plotOn(model) indirectly selected PDF components: ()
[#1] INFO:Plotting -- RooAbsPdf::plotOn(model) directly selected PDF components: (bkg1,sig,sig1,sig2)
[#1] INFO:Plotting -- RooAbsPdf::plotOn(model) indirectly selected PDF components: (bkg)
Date
February 2018
Authors
Clemens Lange, Wouter Verkerke (C++ version)

Definition in file rf205_compplot.py.