void rf203_ranges()
{
std::unique_ptr<RooDataSet>
modelData{model.generate(
x, 10000)};
std::unique_ptr<RooFitResult>
r_full{model.fitTo(*
modelData, Save(
true), PrintLevel(-1))};
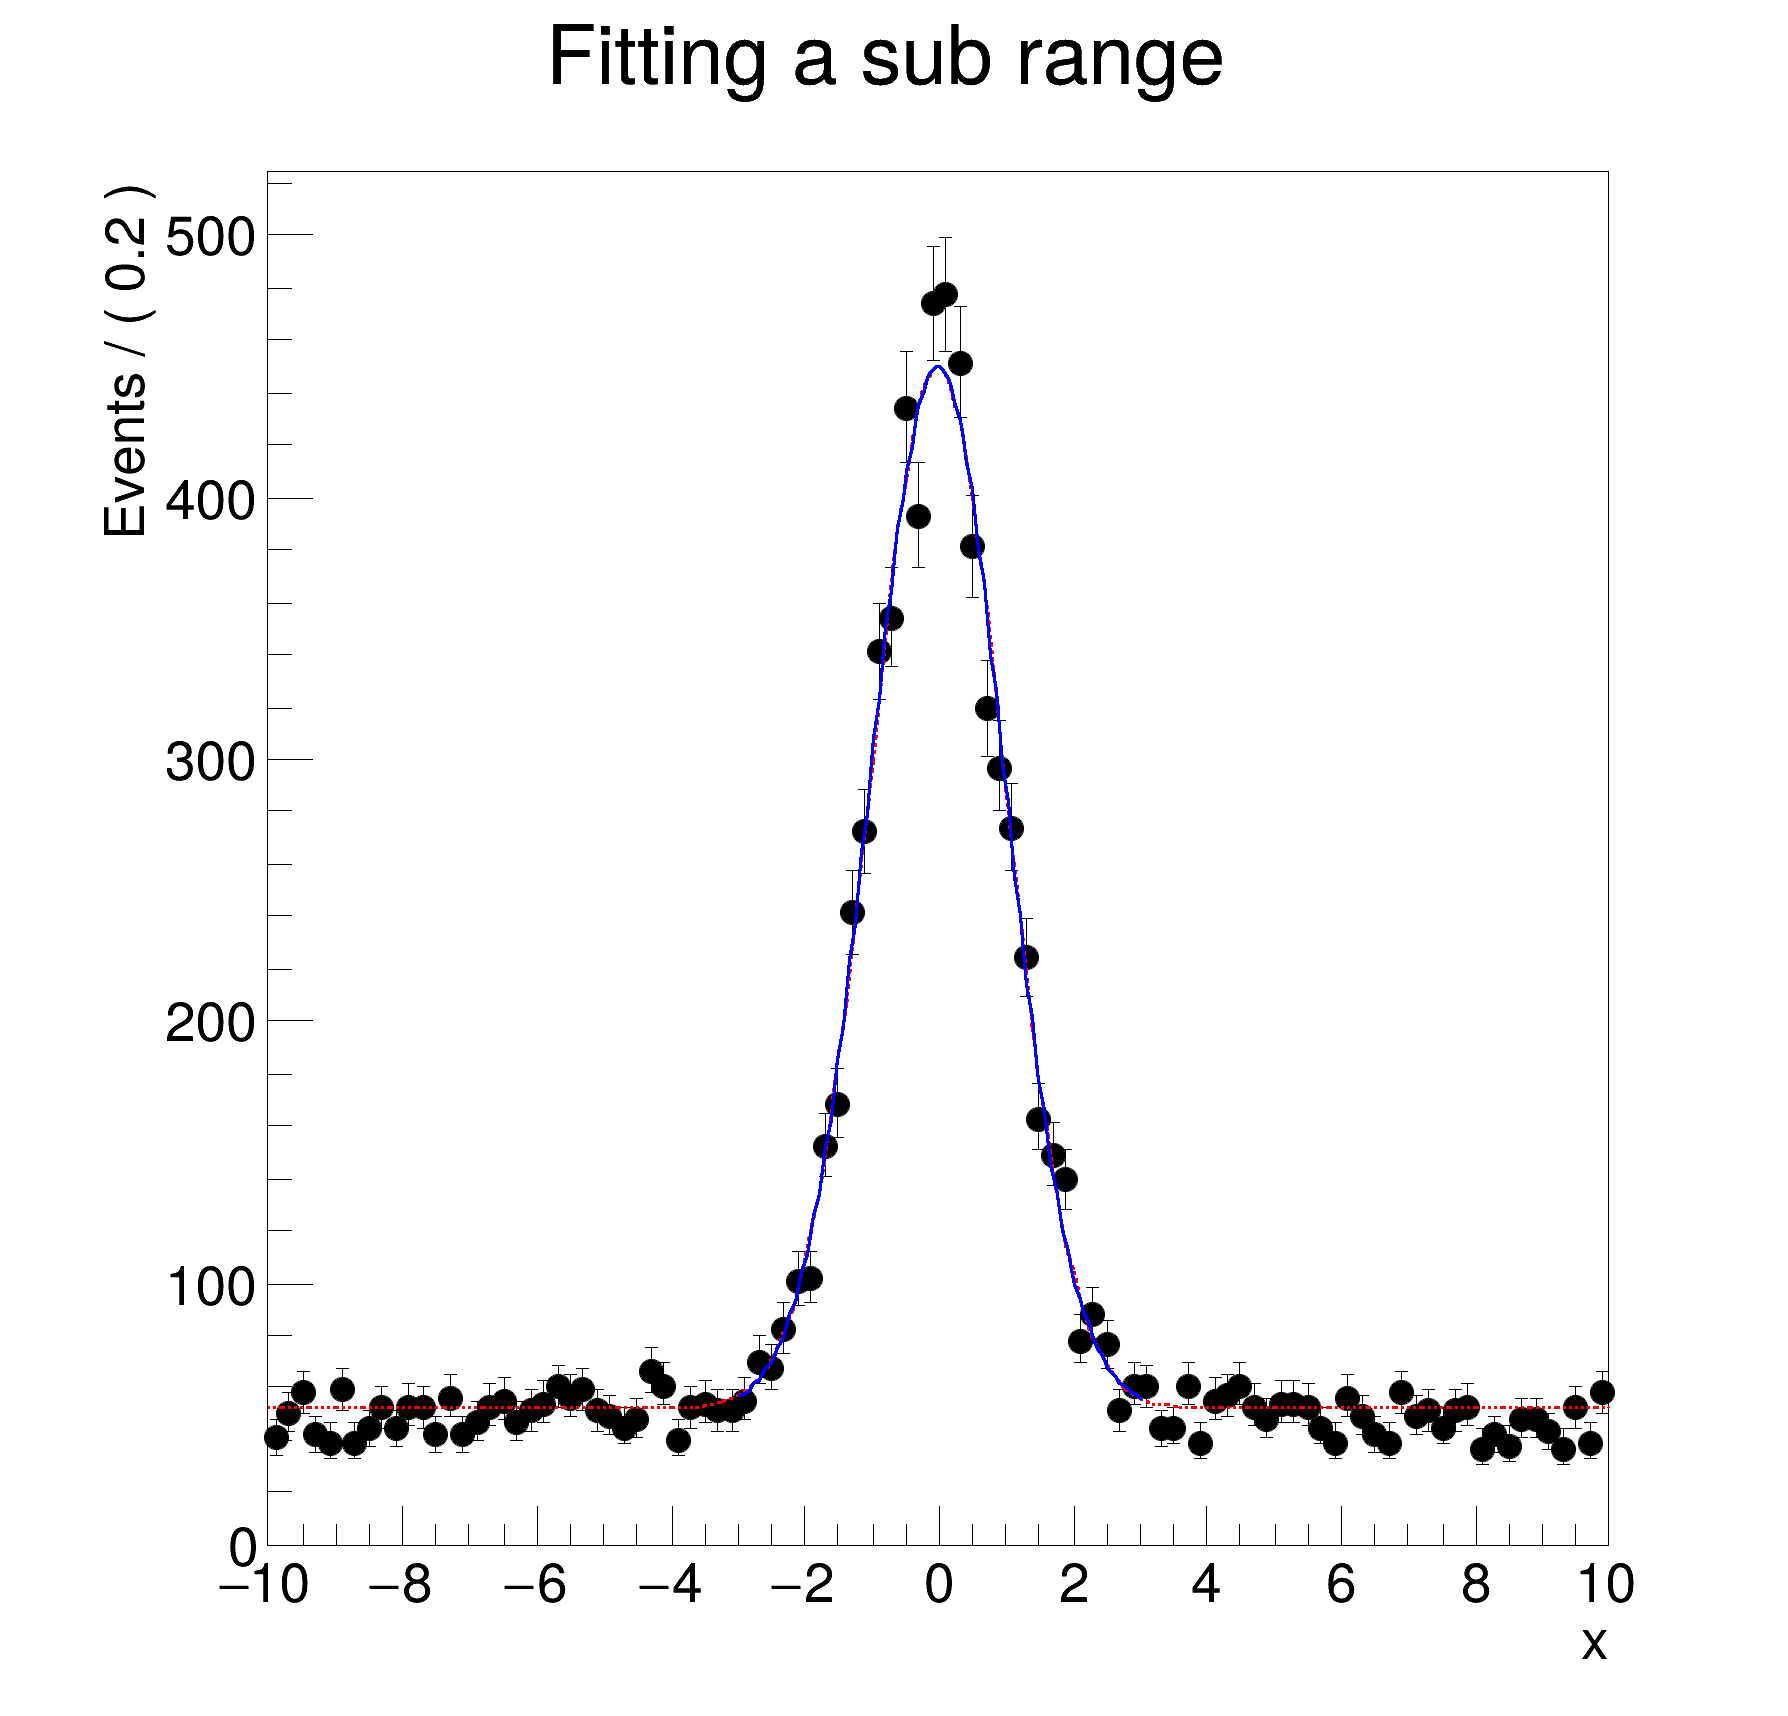
x.setRange(
"signal", -3, 3);
model.plotOn(frame);
cout << "result of fit on all data " << endl;
cout << "result of fit in in signal region (note increased error on signal fraction)" << endl;
new TCanvas(
"rf203_ranges",
"rf203_ranges", 600, 600);
gPad->SetLeftMargin(0.15);
return;
}
ROOT::Detail::TRangeCast< T, true > TRangeDynCast
TRangeDynCast is an adapter class that allows the typed iteration through a TCollection.
Option_t Option_t TPoint TPoint const char GetTextMagnitude GetFillStyle GetLineColor GetLineWidth GetMarkerStyle GetTextAlign GetTextColor GetTextSize void char Point_t Rectangle_t WindowAttributes_t Float_t Float_t Float_t Int_t Int_t UInt_t UInt_t Rectangle_t Int_t Int_t Window_t TString Int_t GCValues_t GetPrimarySelectionOwner GetDisplay GetScreen GetColormap GetNativeEvent const char const char dpyName wid window const char font_name cursor keysym reg const char only_if_exist regb h Point_t winding char text const char depth char const char mx
Efficient implementation of a sum of PDFs of the form.
RooArgList is a container object that can hold multiple RooAbsArg objects.
Plot frame and a container for graphics objects within that frame.
static RooPlot * frame(const RooAbsRealLValue &var, double xmin, double xmax, Int_t nBins)
Create a new frame for a given variable in x.
void Draw(Option_t *options=nullptr) override
Draw this plot and all of the elements it contains.
RooPolynomial implements a polynomial p.d.f of the form.
Variable that can be changed from the outside.
virtual void SetTitleOffset(Float_t offset=1)
Set distance between the axis and the axis title.
RooCmdArg Save(bool flag=true)
RooCmdArg PrintLevel(Int_t code)
RooCmdArg LineColor(TColorNumber color)
RooCmdArg LineStyle(Style_t style)
The namespace RooFit contains mostly switches that change the behaviour of functions of PDFs (or othe...
[#1] INFO:Fitting -- RooAbsPdf::fitTo(model) fixing normalization set for coefficient determination to observables in data
[#1] INFO:Fitting -- using generic CPU library compiled with no vectorizations
[#1] INFO:Fitting -- Creation of NLL object took 592.294 μs
[#1] INFO:Fitting -- RooAddition::defaultErrorLevel(nll_model_modelData) Summation contains a RooNLLVar, using its error level
[#1] INFO:Minimization -- [fitFCN] No discrete parameters, performing continuous minimization only
[#1] INFO:Eval -- RooRealVar::setRange(x) new range named 'signal' created with bounds [-3,3]
[#1] INFO:Eval -- RooRealVar::setRange(x) new range named 'fit_nll_model_modelData' created with bounds [-3,3]
[#1] INFO:Fitting -- RooAbsPdf::fitTo(model) fixing normalization set for coefficient determination to observables in data
[#1] INFO:Fitting -- Creation of NLL object took 364.292 μs
[#1] INFO:Fitting -- RooAddition::defaultErrorLevel(nll_model_modelData) Summation contains a RooNLLVar, using its error level
[#1] INFO:Minimization -- [fitFCN] No discrete parameters, performing continuous minimization only
[#1] INFO:Plotting -- RooAbsPdf::plotOn(model) p.d.f was fitted in a subrange and no explicit NormRange() was specified. Plotting / normalising in fit range. To override, do one of the following
- Clear the automatic fit range attribute: <pdf>.removeStringAttribute("fitrange");
- Explicitly specify the plotting range: Range("<rangeName>").
- Explicitly specify where to compute the normalisation: NormRange("<rangeName>").
The default (full) range can be denoted with Range("") / NormRange("").
[#1] INFO:Plotting -- RooAbsPdf::plotOn(model) only plotting range ''
[#1] INFO:Plotting -- RooAbsPdf::plotOn(model) p.d.f. curve is normalized using explicit choice of ranges 'fit_nll_model_modelData'
[#1] INFO:Plotting -- RooAbsPdf::plotOn(model) p.d.f was fitted in a subrange and no explicit Range() and NormRange() was specified. Plotting / normalising in fit range. To override, do one of the following
- Clear the automatic fit range attribute: <pdf>.removeStringAttribute("fitrange");
- Explicitly specify the plotting range: Range("<rangeName>").
- Explicitly specify where to compute the normalisation: NormRange("<rangeName>").
The default (full) range can be denoted with Range("") / NormRange("").
[#1] INFO:Plotting -- RooAbsPdf::plotOn(model) only plotting range 'fit_nll_model_modelData'
[#1] INFO:Plotting -- RooAbsPdf::plotOn(model) p.d.f. curve is normalized using explicit choice of ranges 'fit_nll_model_modelData'
result of fit on all data
RooFitResult: minimized FCN value: 25939.4, estimated distance to minimum: 3.77183e-06
covariance matrix quality: Full, accurate covariance matrix
Status : MINIMIZE=0 HESSE=0
Floating Parameter FinalValue +/- Error
-------------------- --------------------------
f 5.0441e-01 +/- 6.32e-03
mx -2.1605e-02 +/- 1.77e-02
result of fit in in signal region (note increased error on signal fraction)
RooFitResult: minimized FCN value: 10339.5, estimated distance to minimum: 0.000279216
covariance matrix quality: Full, accurate covariance matrix
Status : MINIMIZE=0 HESSE=0
Floating Parameter FinalValue +/- Error
-------------------- --------------------------
f 4.8979e-01 +/- 1.62e-02
mx -2.1518e-02 +/- 1.79e-02