Logo ROOT  
Reference Guide
 
Loading...
Searching...
No Matches
rf107_plotstyles.C File Reference

Detailed Description

View in nbviewer Open in SWAN
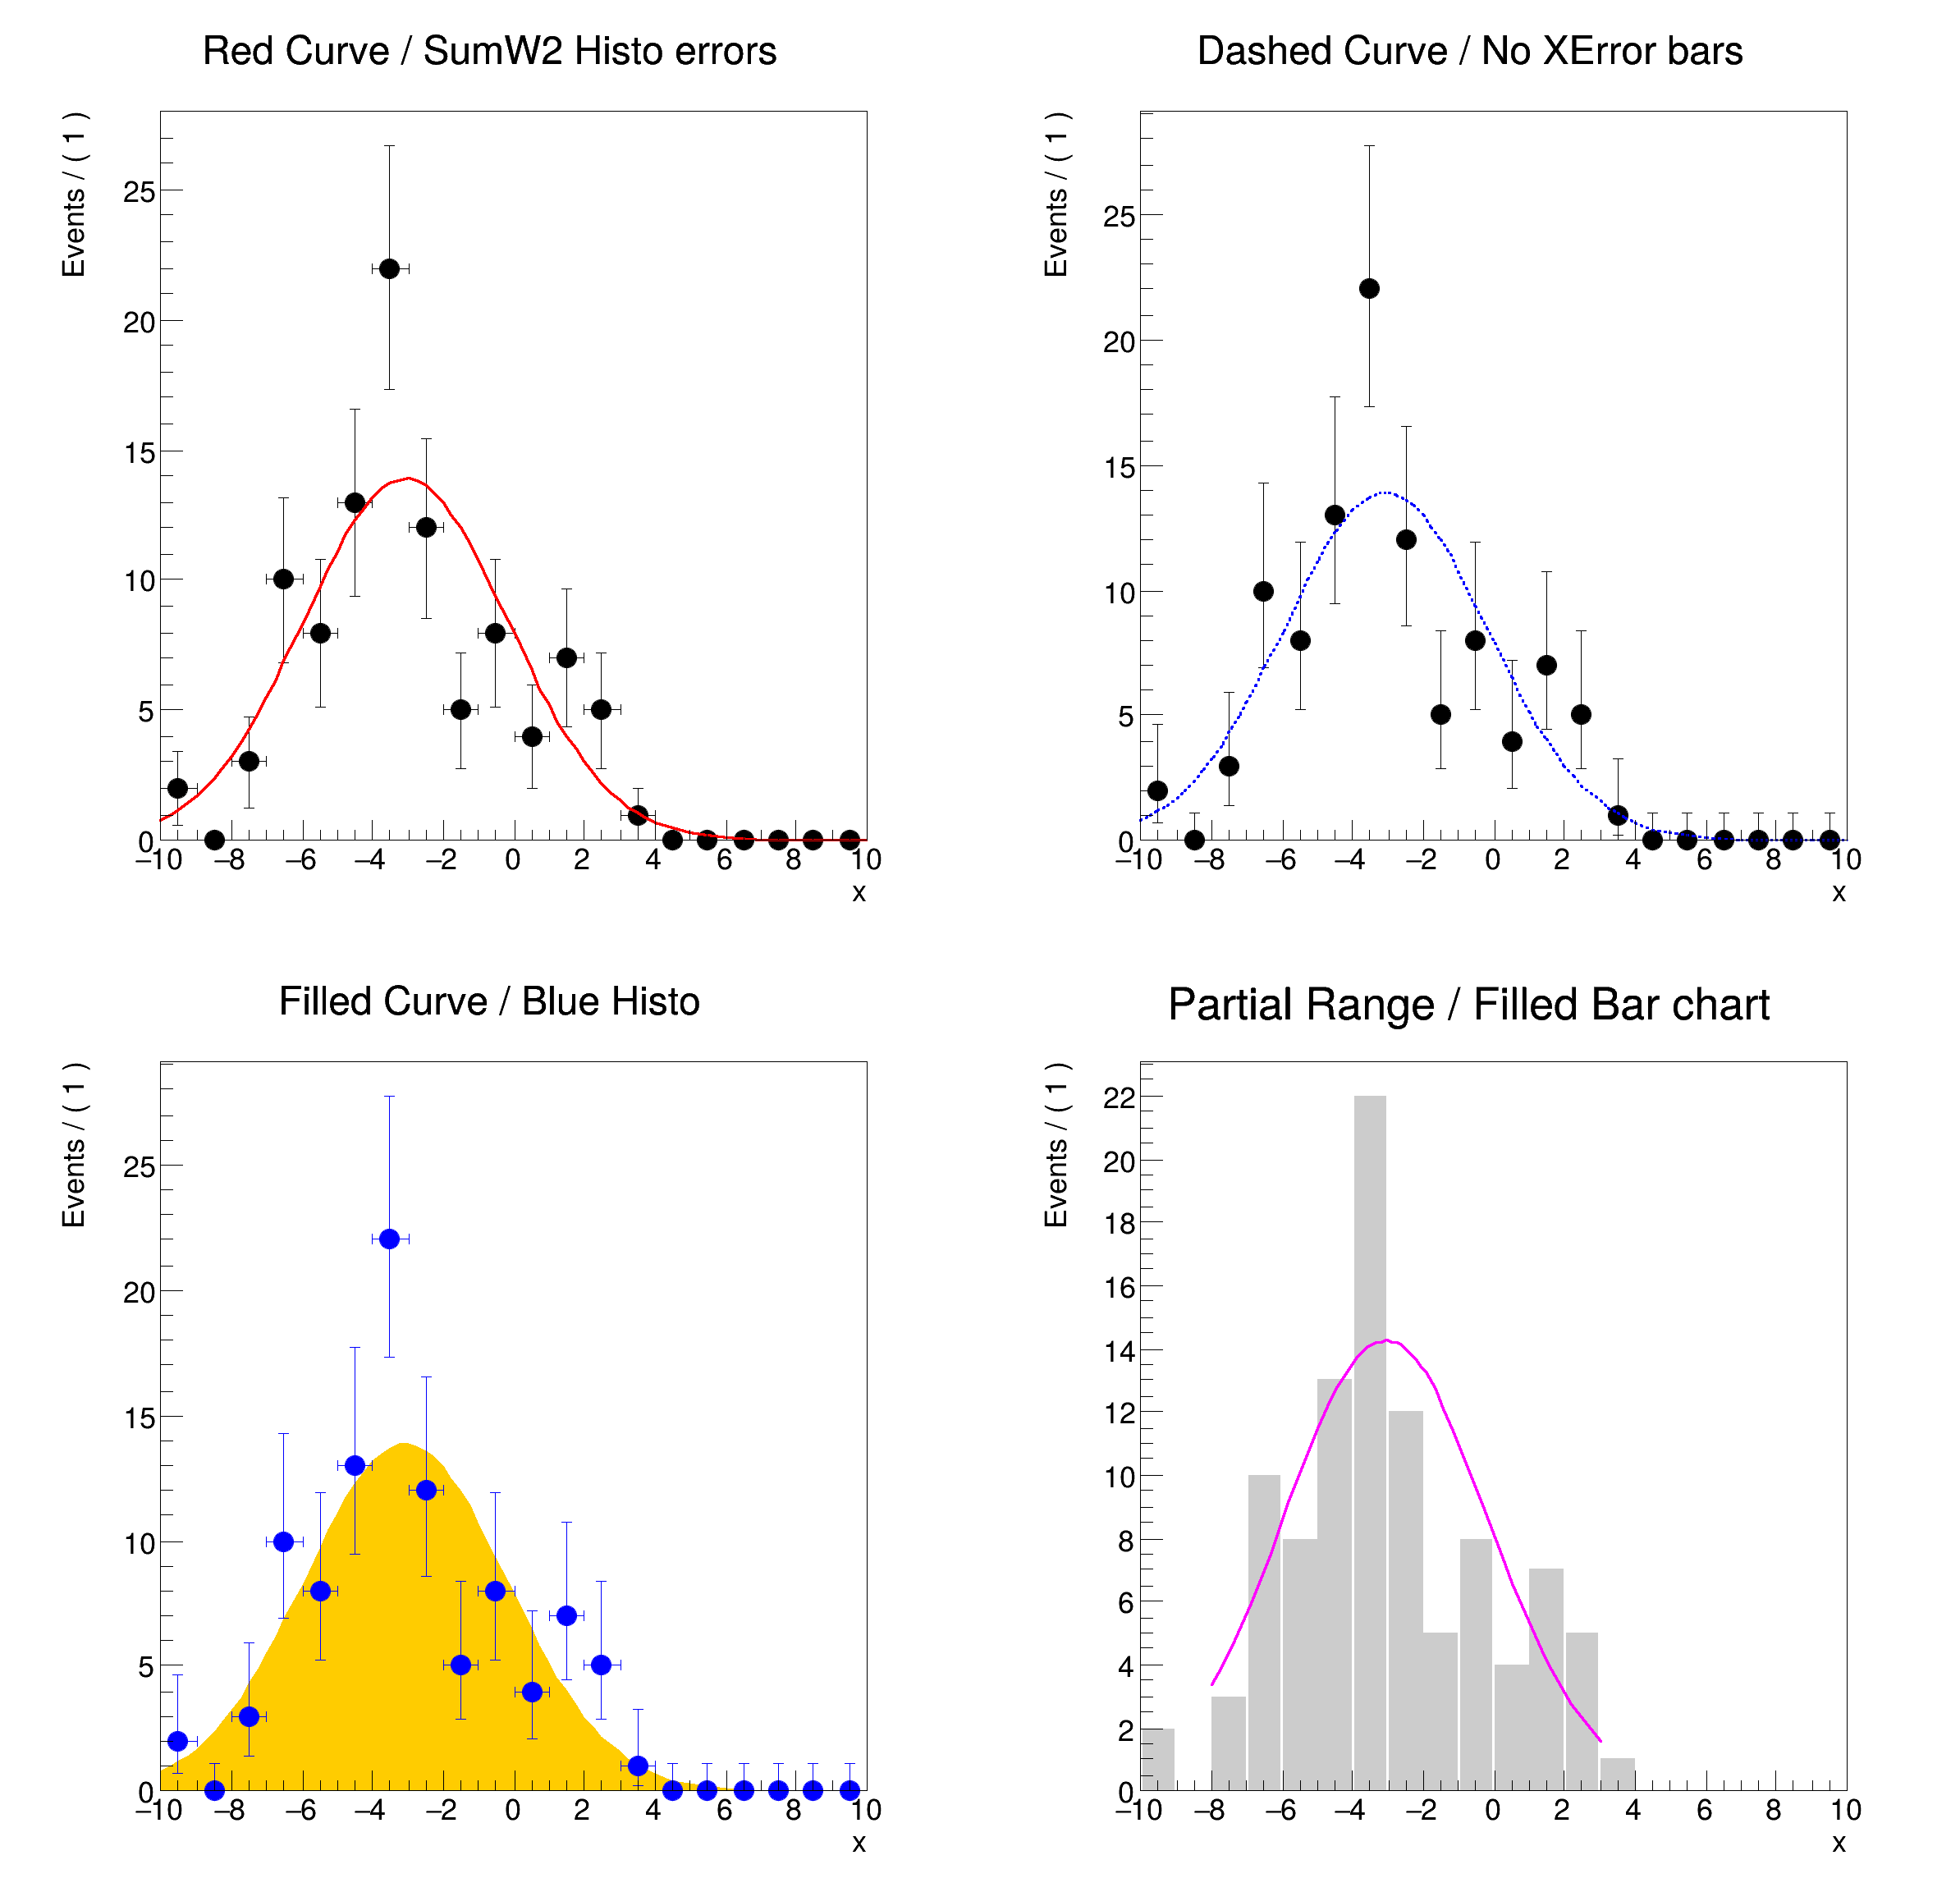
Basic functionality: various plotting styles of data, functions in a RooPlot

#include "RooRealVar.h"
#include "RooDataSet.h"
#include "RooGaussian.h"
#include "TCanvas.h"
#include "TAxis.h"
#include "RooPlot.h"
using namespace RooFit;
{
// S e t u p m o d e l
// ---------------------
// Create observables
RooRealVar x("x", "x", -10, 10);
// Create Gaussian
RooRealVar sigma("sigma", "sigma", 3, 0.1, 10);
RooRealVar mean("mean", "mean", -3, -10, 10);
RooGaussian gauss("gauss", "gauss", x, mean, sigma);
// Generate a sample of 100 events with sigma=3
std::unique_ptr<RooDataSet> data{gauss.generate(x, 100)};
// Fit pdf to data
gauss.fitTo(*data, PrintLevel(-1));
// M a k e p l o t f r a m e s
// -------------------------------
// Make four plot frames to demonstrate various plotting features
RooPlot *frame1 = x.frame(Name("xframe"), Title("Red Curve / SumW2 Histo errors"), Bins(20));
RooPlot *frame2 = x.frame(Name("xframe"), Title("Dashed Curve / No XError bars"), Bins(20));
RooPlot *frame3 = x.frame(Name("xframe"), Title("Filled Curve / Blue Histo"), Bins(20));
RooPlot *frame4 = x.frame(Name("xframe"), Title("Partial Range / Filled Bar chart"), Bins(20));
// D a t a p l o t t i n g s t y l e s
// ---------------------------------------
// Use sqrt(sum(weights^2)) error instead of Poisson errors
data->plotOn(frame1, DataError(RooAbsData::SumW2));
// Remove horizontal error bars
data->plotOn(frame2, XErrorSize(0));
// Blue markers and error bors
data->plotOn(frame3, MarkerColor(kBlue), LineColor(kBlue));
// Filled bar chart
data->plotOn(frame4, DrawOption("B"), DataError(RooAbsData::None), XErrorSize(0), FillColor(kGray));
// F u n c t i o n p l o t t i n g s t y l e s
// -----------------------------------------------
// Change line color to red
gauss.plotOn(frame1, LineColor(kRed));
// Change line style to dashed
gauss.plotOn(frame2, LineStyle(kDashed));
// Filled shapes in green color
gauss.plotOn(frame3, DrawOption("F"), FillColor(kOrange), MoveToBack());
//
gauss.plotOn(frame4, Range(-8, 3), LineColor(kMagenta));
TCanvas *c = new TCanvas("rf107_plotstyles", "rf107_plotstyles", 800, 800);
c->Divide(2, 2);
c->cd(1);
gPad->SetLeftMargin(0.15);
frame1->GetYaxis()->SetTitleOffset(1.6);
frame1->Draw();
c->cd(2);
gPad->SetLeftMargin(0.15);
frame2->GetYaxis()->SetTitleOffset(1.6);
frame2->Draw();
c->cd(3);
gPad->SetLeftMargin(0.15);
frame3->GetYaxis()->SetTitleOffset(1.6);
frame3->Draw();
c->cd(4);
gPad->SetLeftMargin(0.15);
frame4->GetYaxis()->SetTitleOffset(1.6);
frame4->Draw();
}
#define c(i)
Definition RSha256.hxx:101
@ kGray
Definition Rtypes.h:65
@ kRed
Definition Rtypes.h:66
@ kOrange
Definition Rtypes.h:67
@ kMagenta
Definition Rtypes.h:66
@ kBlue
Definition Rtypes.h:66
@ kDashed
Definition TAttLine.h:48
Option_t Option_t TPoint TPoint const char GetTextMagnitude GetFillStyle GetLineColor GetLineWidth GetMarkerStyle GetTextAlign GetTextColor GetTextSize void data
#define gPad
Plain Gaussian p.d.f.
Definition RooGaussian.h:24
Plot frame and a container for graphics objects within that frame.
Definition RooPlot.h:43
static RooPlot * frame(const RooAbsRealLValue &var, double xmin, double xmax, Int_t nBins)
Create a new frame for a given variable in x.
Definition RooPlot.cxx:237
TAxis * GetYaxis() const
Definition RooPlot.cxx:1276
void Draw(Option_t *options=nullptr) override
Draw this plot and all of the elements it contains.
Definition RooPlot.cxx:649
Variable that can be changed from the outside.
Definition RooRealVar.h:37
virtual void SetTitleOffset(Float_t offset=1)
Set distance between the axis and the axis title.
Definition TAttAxis.cxx:298
The Canvas class.
Definition TCanvas.h:23
const Double_t sigma
Double_t x[n]
Definition legend1.C:17
The namespace RooFit contains mostly switches that change the behaviour of functions of PDFs (or othe...
Definition JSONIO.h:26
Ta Range(0, 0, 1, 1)
[#1] INFO:Fitting -- RooAbsPdf::fitTo(gauss_over_gauss_Int[x]) fixing normalization set for coefficient determination to observables in data
[#1] INFO:Fitting -- using CPU computation library compiled with -mavx2
[#1] INFO:Fitting -- RooAddition::defaultErrorLevel(nll_gauss_over_gauss_Int[x]_gaussData) Summation contains a RooNLLVar, using its error level
[#1] INFO:Minimization -- RooAbsMinimizerFcn::setOptimizeConst: activating const optimization
[#1] INFO:Minimization -- RooAbsMinimizerFcn::setOptimizeConst: deactivating const optimization
[#1] INFO:Plotting -- RooAbsPdf::plotOn(gauss) only plotting range [-8,3], curve is normalized to data in given range
[#1] INFO:Eval -- RooRealVar::setRange(x) new range named 'plotRange' created with bounds [-8,3]
Date
July 2008
Author
Wouter Verkerke

Definition in file rf107_plotstyles.C.