Logo ROOT  
Reference Guide
 
Loading...
Searching...
No Matches
ratioplot4.py File Reference

Detailed Description

View in nbviewer Open in SWAN
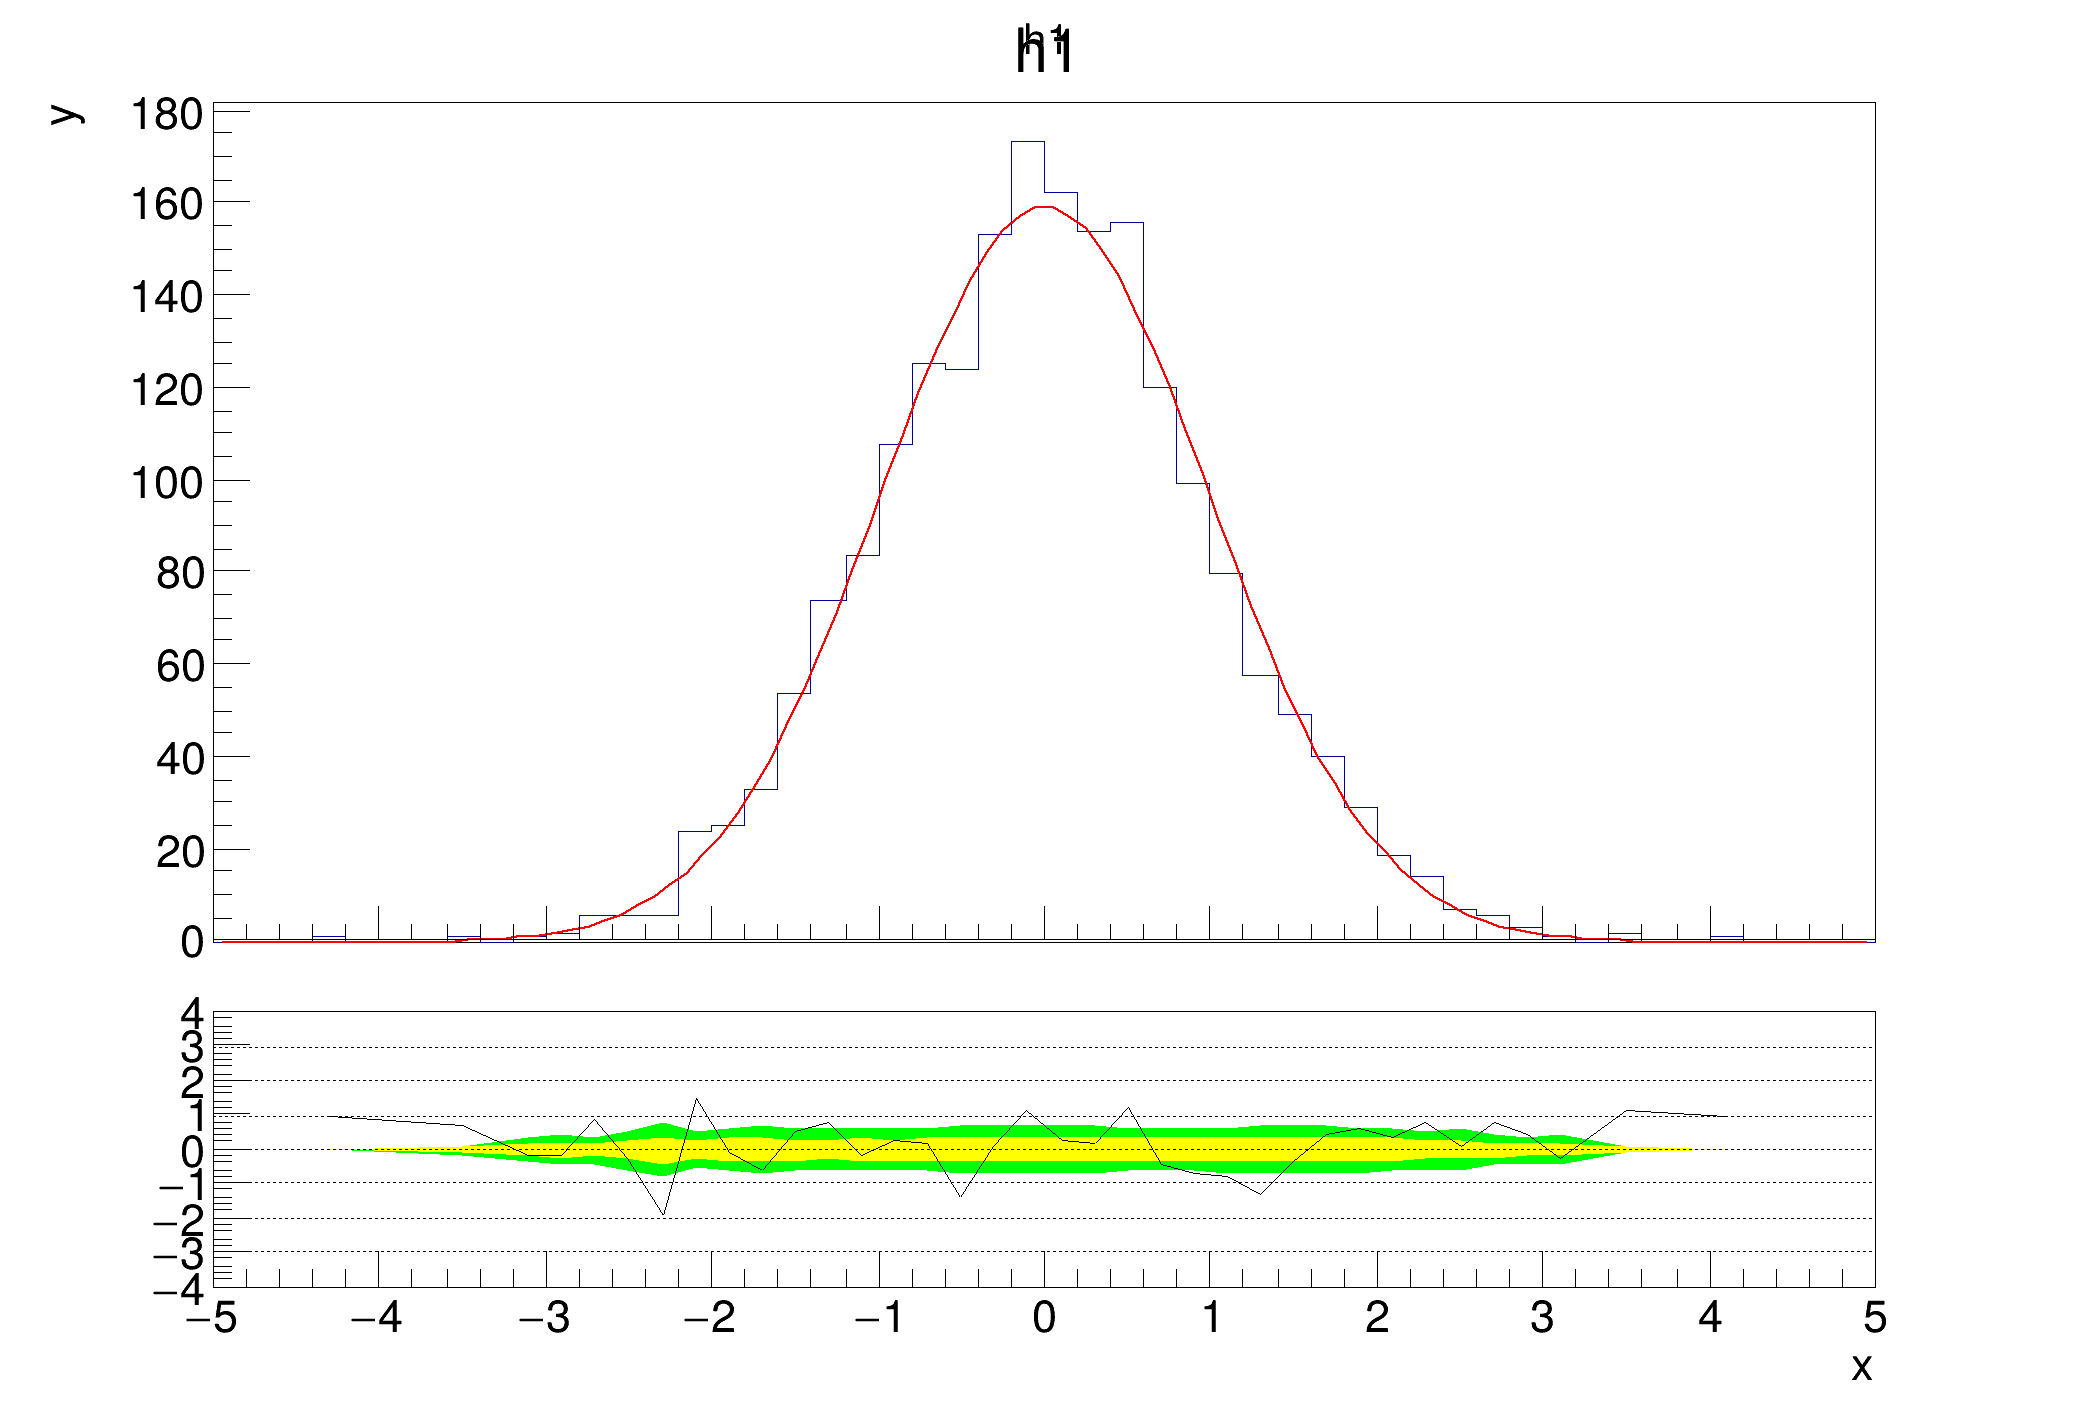
Example that shows custom dashed lines on the lower plot, specified by a vector of floats.

By default, dashed lines are drawn at certain points. You can either disable them, or specify where you want them to appear. Inspired by the tutorial of Paul Gessinger.

import ROOT
ROOT.gStyle.SetOptStat(0)
c1 = ROOT.TCanvas("c1", "fit residual simple")
h1 = ROOT.TH1D("h1", "h1", 50, -5, 5)
h1.FillRandom("gaus", 2000)
h1.Fit("gaus")
h1.GetXaxis().SetTitle("x")
h1.GetYaxis().SetTitle("y")
rp1 = ROOT.TRatioPlot(h1)
lines = ROOT.std.vector('double')()
for i in range(-3,4):lines.push_back(i)
rp1.SetGridlines(lines)
rp1.Draw()
rp1.GetLowerRefGraph().SetMinimum(-4)
rp1.GetLowerRefGraph().SetMaximum(4)
c1.Update()
Author
Alberto Ferro

Definition in file ratioplot4.py.