Logo ROOT  
Reference Guide
 
Loading...
Searching...
No Matches
hist003_TH1_draw.py File Reference

Detailed Description

View in nbviewer Open in SWAN
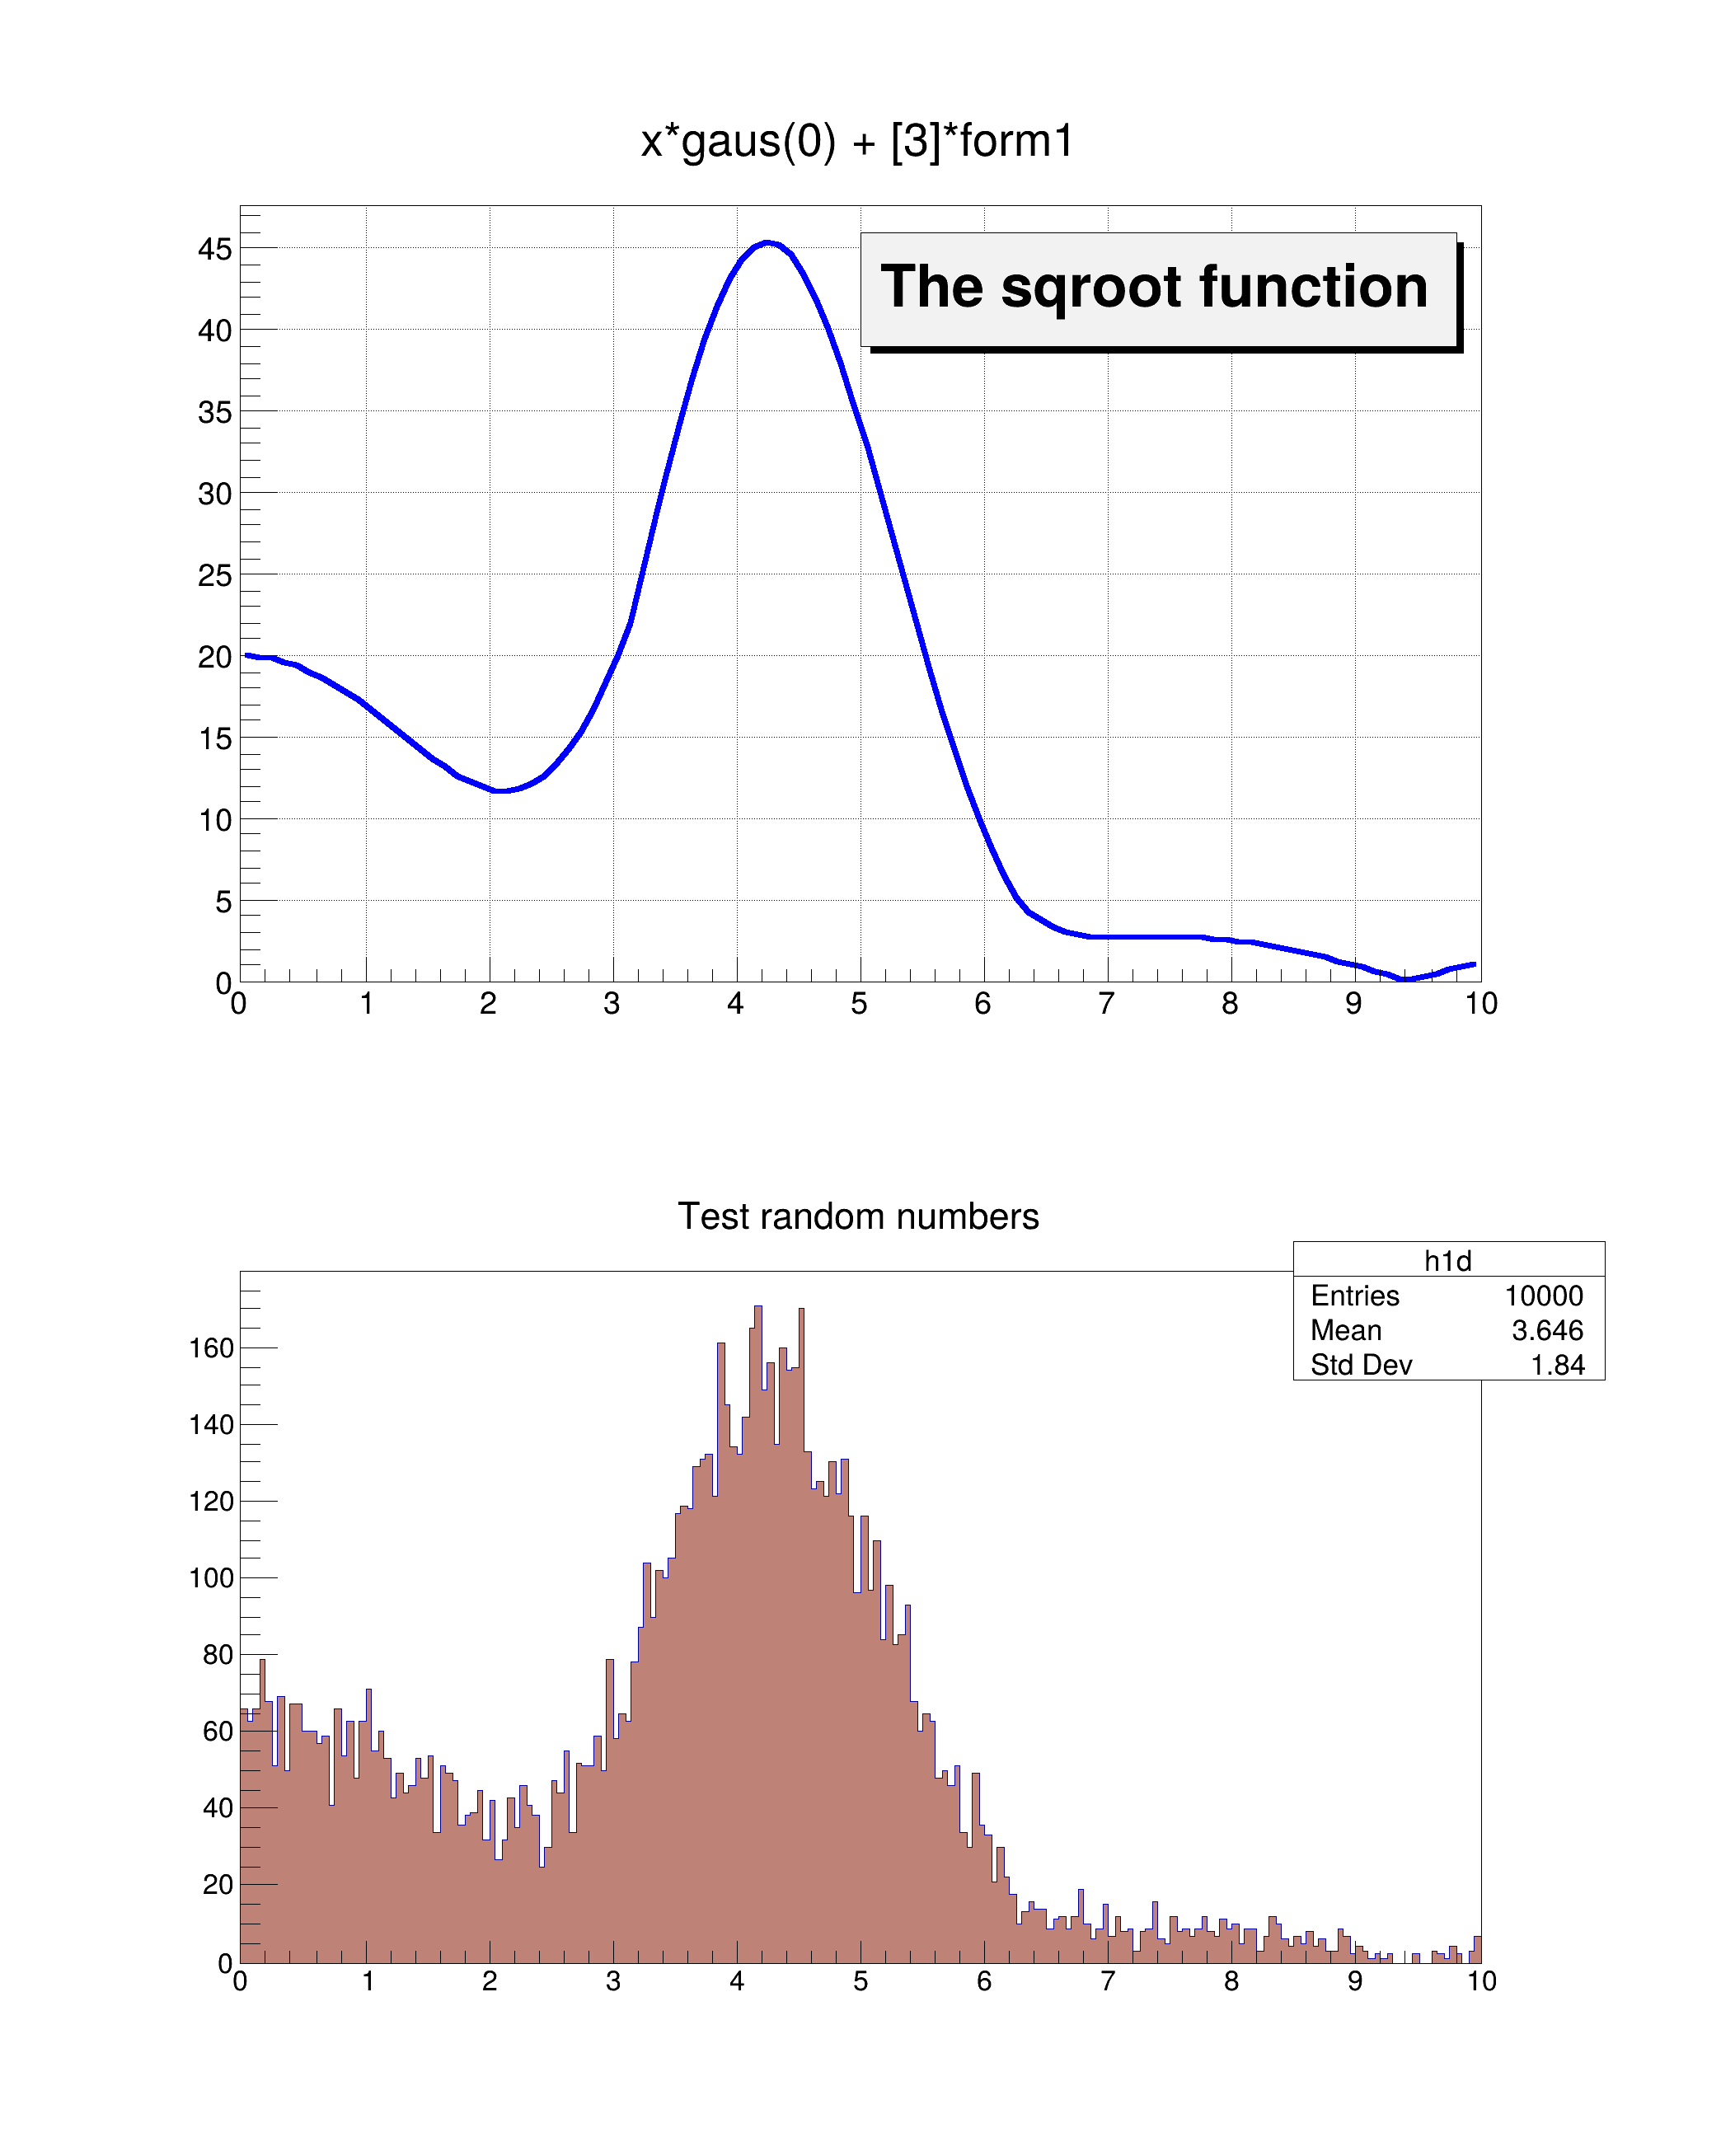
Draw a 1D histogram to a canvas.

Note
When using graphics inside a ROOT macro the objects must be created with new.
import ROOT
# Create and fill the histogram.
# See hist002_TH1_fillrandom_userfunc.C for more information about this section.
form1 = ROOT.TFormula("form1", "abs(sin(x)/x)")
rangeMin = 0.0
rangeMax = 10.0
sqroot = ROOT.TF1("sqroot", "x*gaus(0) + [3]*form1", rangeMin, rangeMax)
sqroot.SetLineColor(4)
sqroot.SetLineWidth(6)
sqroot.SetParameters(10.0, 4.0, 1.0, 20.0)
nBins = 200
h1d = ROOT.TH1D("h1d", "Test random numbers", nBins, rangeMin, rangeMax)
h1d.FillRandom("sqroot", 10000)
# Create a canvas and draw the histogram
topX = 200
topY = 10
width = 700
height = 900
c1 = ROOT.TCanvas("c1", "The FillRandom example", topX, topY, width, height)
# Split the canvas into two sections to plot both the function and the histogram
# The TPad's constructor accepts the relative coordinates (0 to 1) of the pad's boundaries
pad1 = ROOT.TPad("pad1", "The pad with the function", 0.05, 0.50, 0.95, 0.95)
pad2 = ROOT.TPad("pad2", "The pad with the histogram", 0.05, 0.05, 0.95, 0.45)
# Draw the two pads
pad1.Draw()
pad2.Draw()
# Select pad1 to draw the next objects into
pad1.cd()
pad1.SetGridx()
pad1.SetGridy()
pad1.GetFrame().SetBorderMode(-1)
pad1.GetFrame().SetBorderSize(5)
# Draw the function in pad1
sqroot.Draw()
# Add a label to the function.
# TPaveLabel's constructor accepts the pixel coordinates and the label string.
lfunction = ROOT.TPaveLabel(5, 39, 9.8, 46, "The sqroot function")
lfunction.Draw()
c1.Update()
# Select pad2 to draw the next objects into
pad2.cd()
pad2.GetFrame().SetBorderMode(-1)
pad2.GetFrame().SetBorderSize(5)
h1d.SetFillColor(45)
h1d.Draw()
c1.Update()
c SetBorderSize(2)
Date
November 2024
Author
Rene Brun, Giacomo Parolini

Definition in file hist003_TH1_draw.py.