

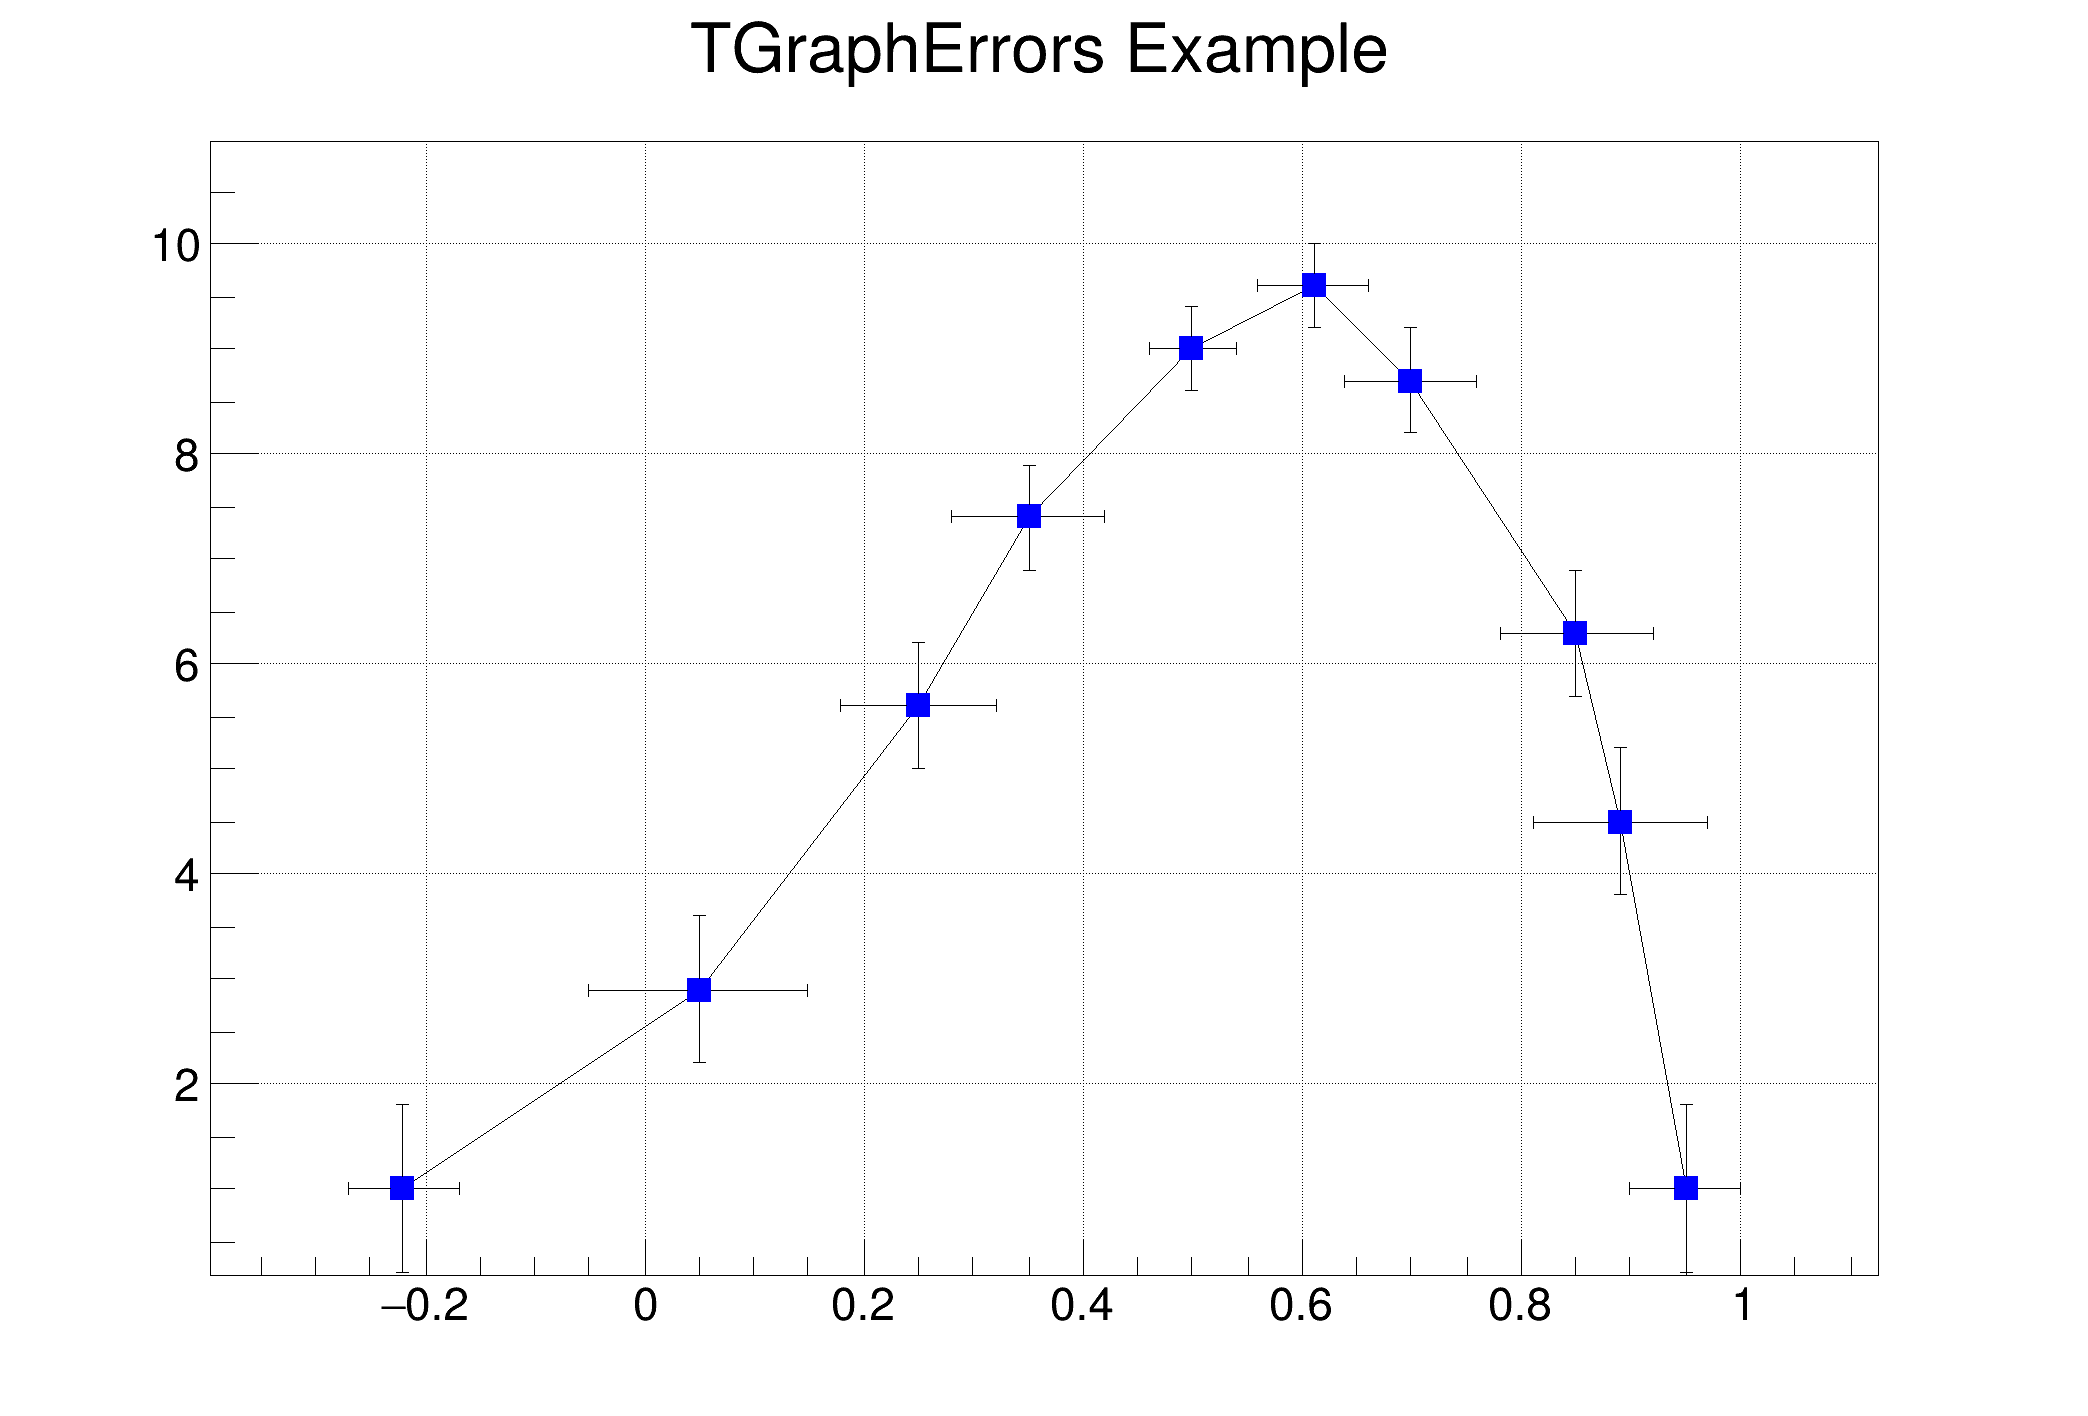
 Create and draw a graph with error bars.
If more graphs are needed, see the gr03_err2gr.C tutorial
See the TGraphErrors documentation
void gr002_errors() {
TCanvas *
c1 =
new TCanvas(
"c1",
"A Simple Graph with error bars",200,10,700,500);
c1->GetFrame()->SetBorderSize(12);
Float_t x[
n] = {-0.22, 0.05, 0.25, 0.35, 0.5, 0.61,0.7,0.85,0.89,0.95};
Float_t y[
n] = {1,2.9,5.6,7.4,9,9.6,8.7,6.3,4.5,1};
Float_t ex[
n] = {.05,.1,.07,.07,.04,.05,.06,.07,.08,.05};
}
virtual void SetMarkerColor(Color_t mcolor=1)
Set the marker color.
virtual void SetMarkerStyle(Style_t mstyle=1)
Set the marker style.
A TGraphErrors is a TGraph with error bars.
void Draw(Option_t *chopt="") override
Draw this graph with its current attributes.
void SetTitle(const char *title="") override
Change (i.e.
- Author
- Rene Brun
Definition in file gr002_errors.C.