 |
ROOT
Reference Guide |

|
| |
ROOT
Reference Guide |
|
Files | |
| hist000_TH1_first.C | |
| Hello World example for TH1. | |
| hist000_TH1_first.py | |
| Hello World example for TH1. | |
| hist001_TH1_fillrandom.C | |
 Fill a 1D histogram with random values using predefined functions. | |
| hist001_TH1_fillrandom.py | |
| Fill a 1D histogram with random values using predefined functions. | |
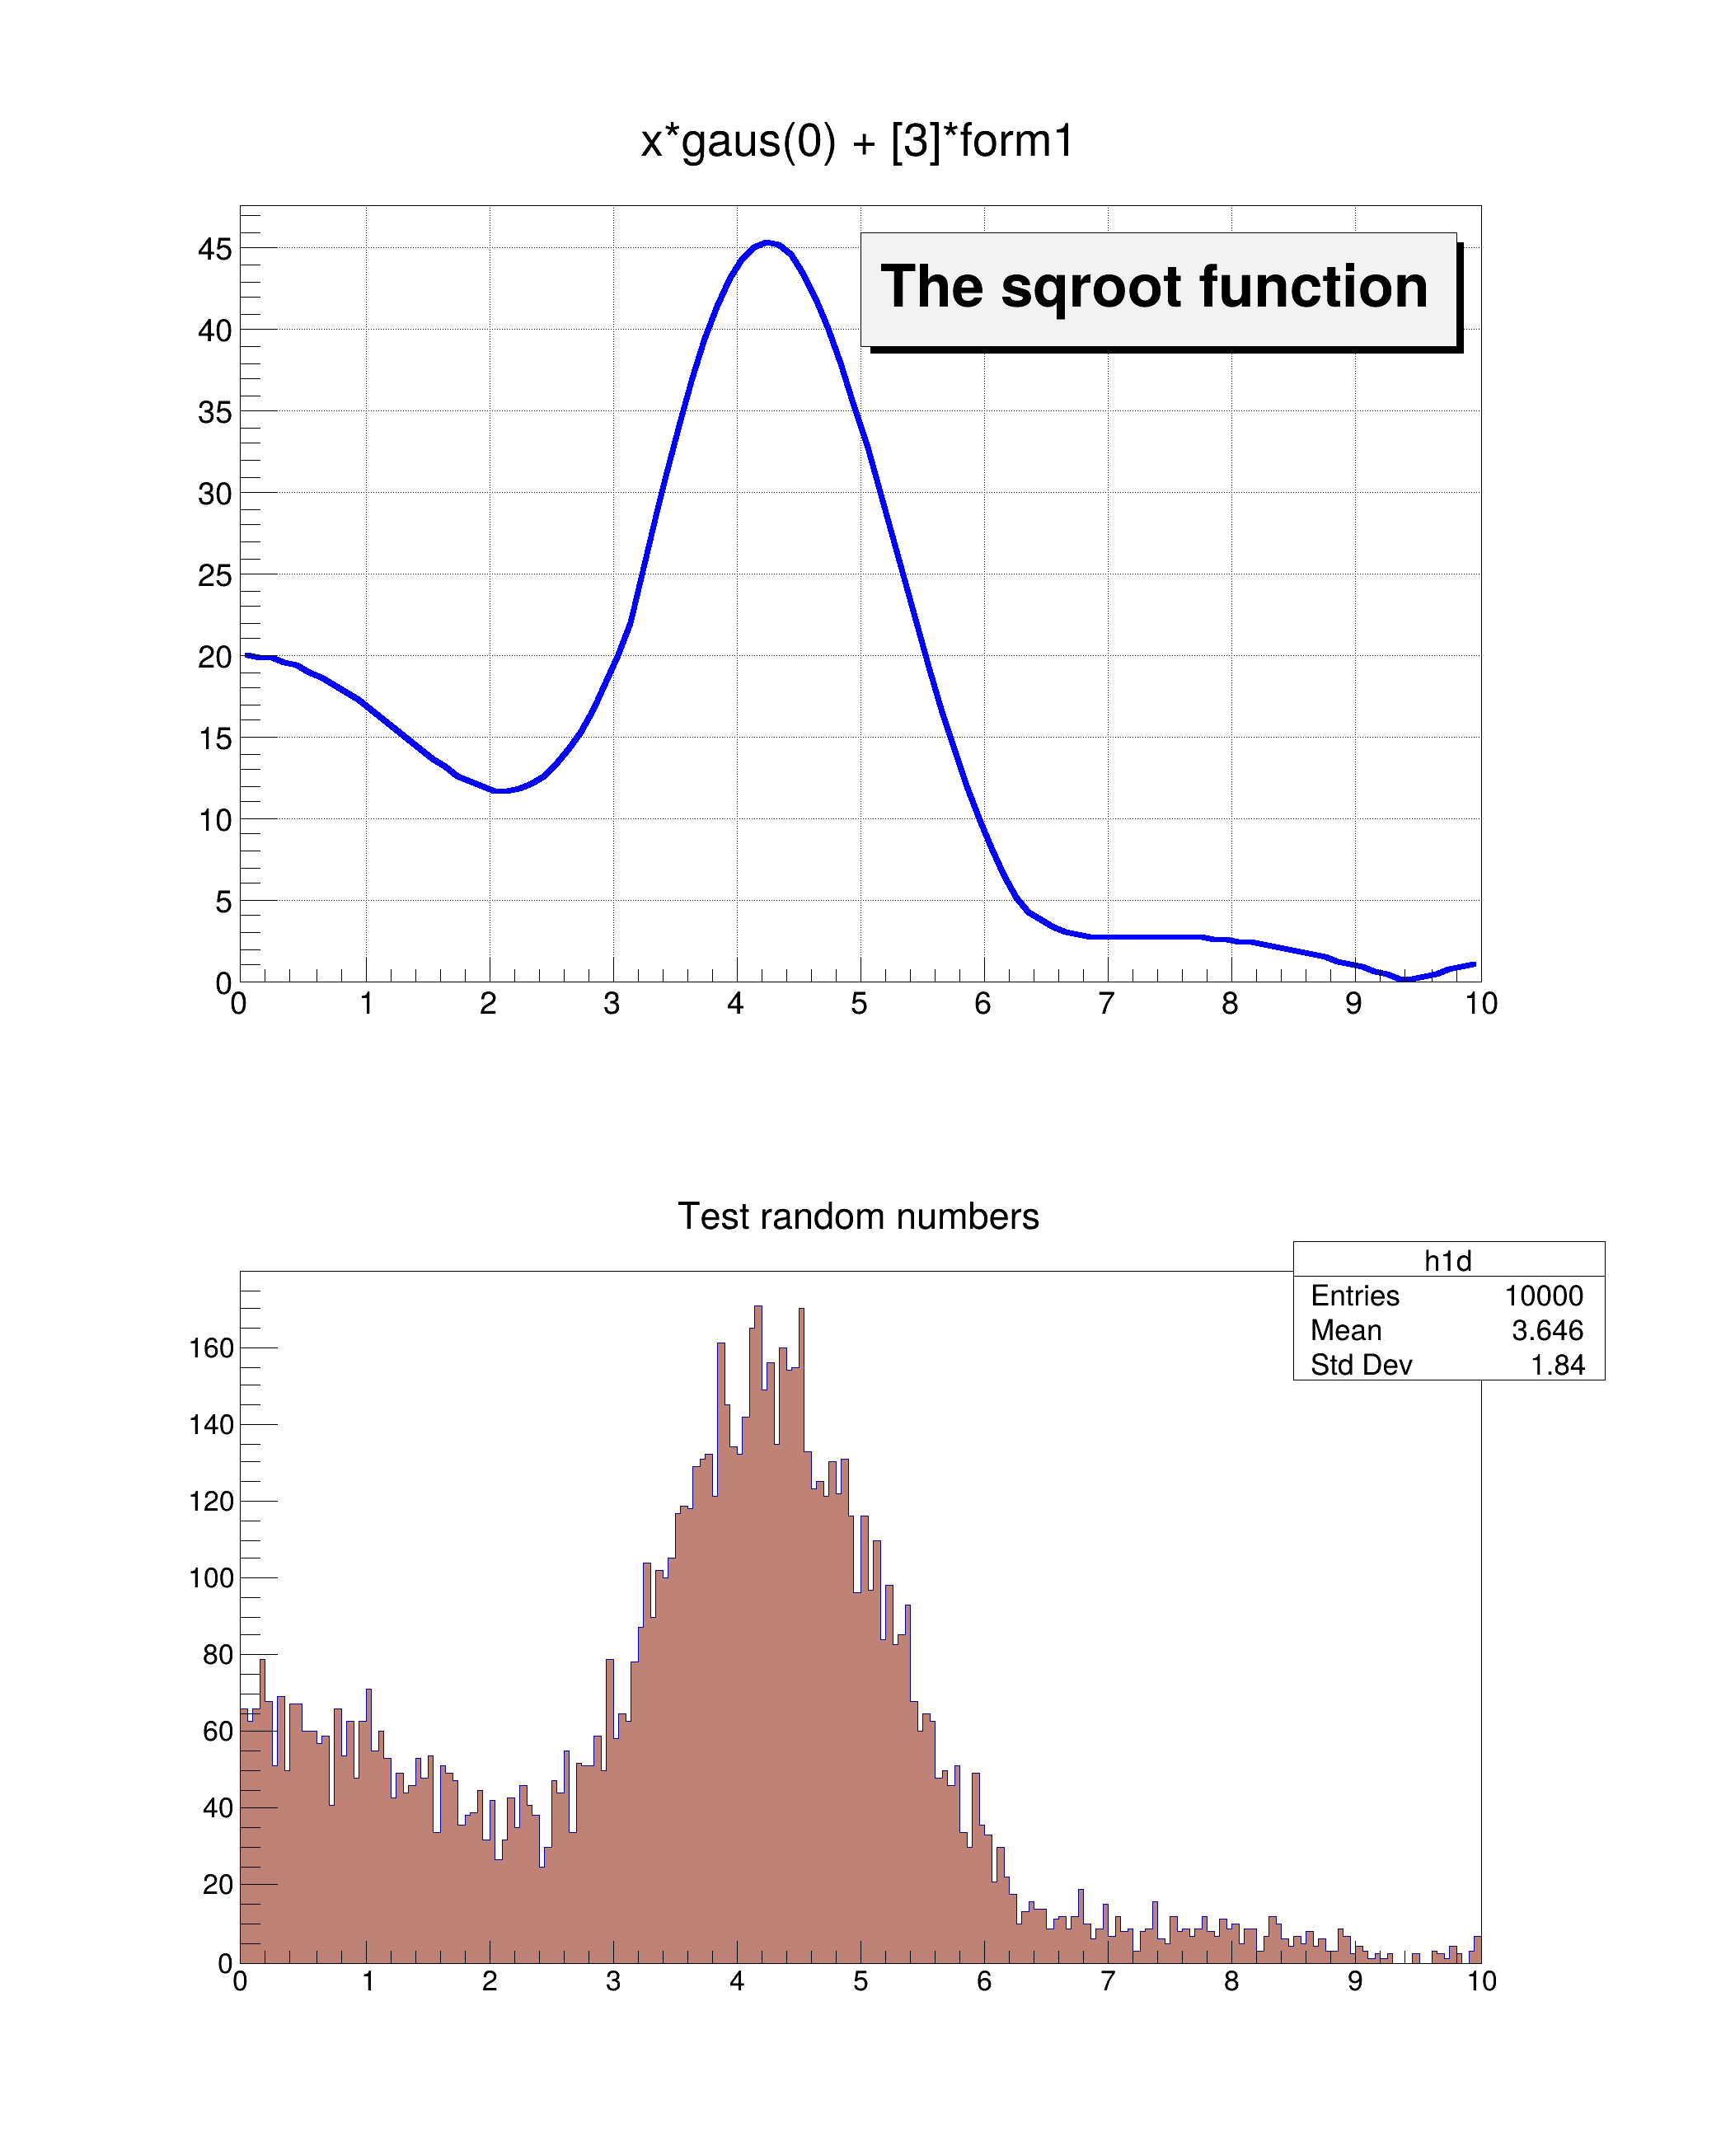
| hist002_TH1_fillrandom_userfunc.C | |
| Fill a 1D histogram from a user-defined parametric function. | |
| hist002_TH1_fillrandom_userfunc.py | |
| Fill a 1D histogram from a user-defined parametric function. | |
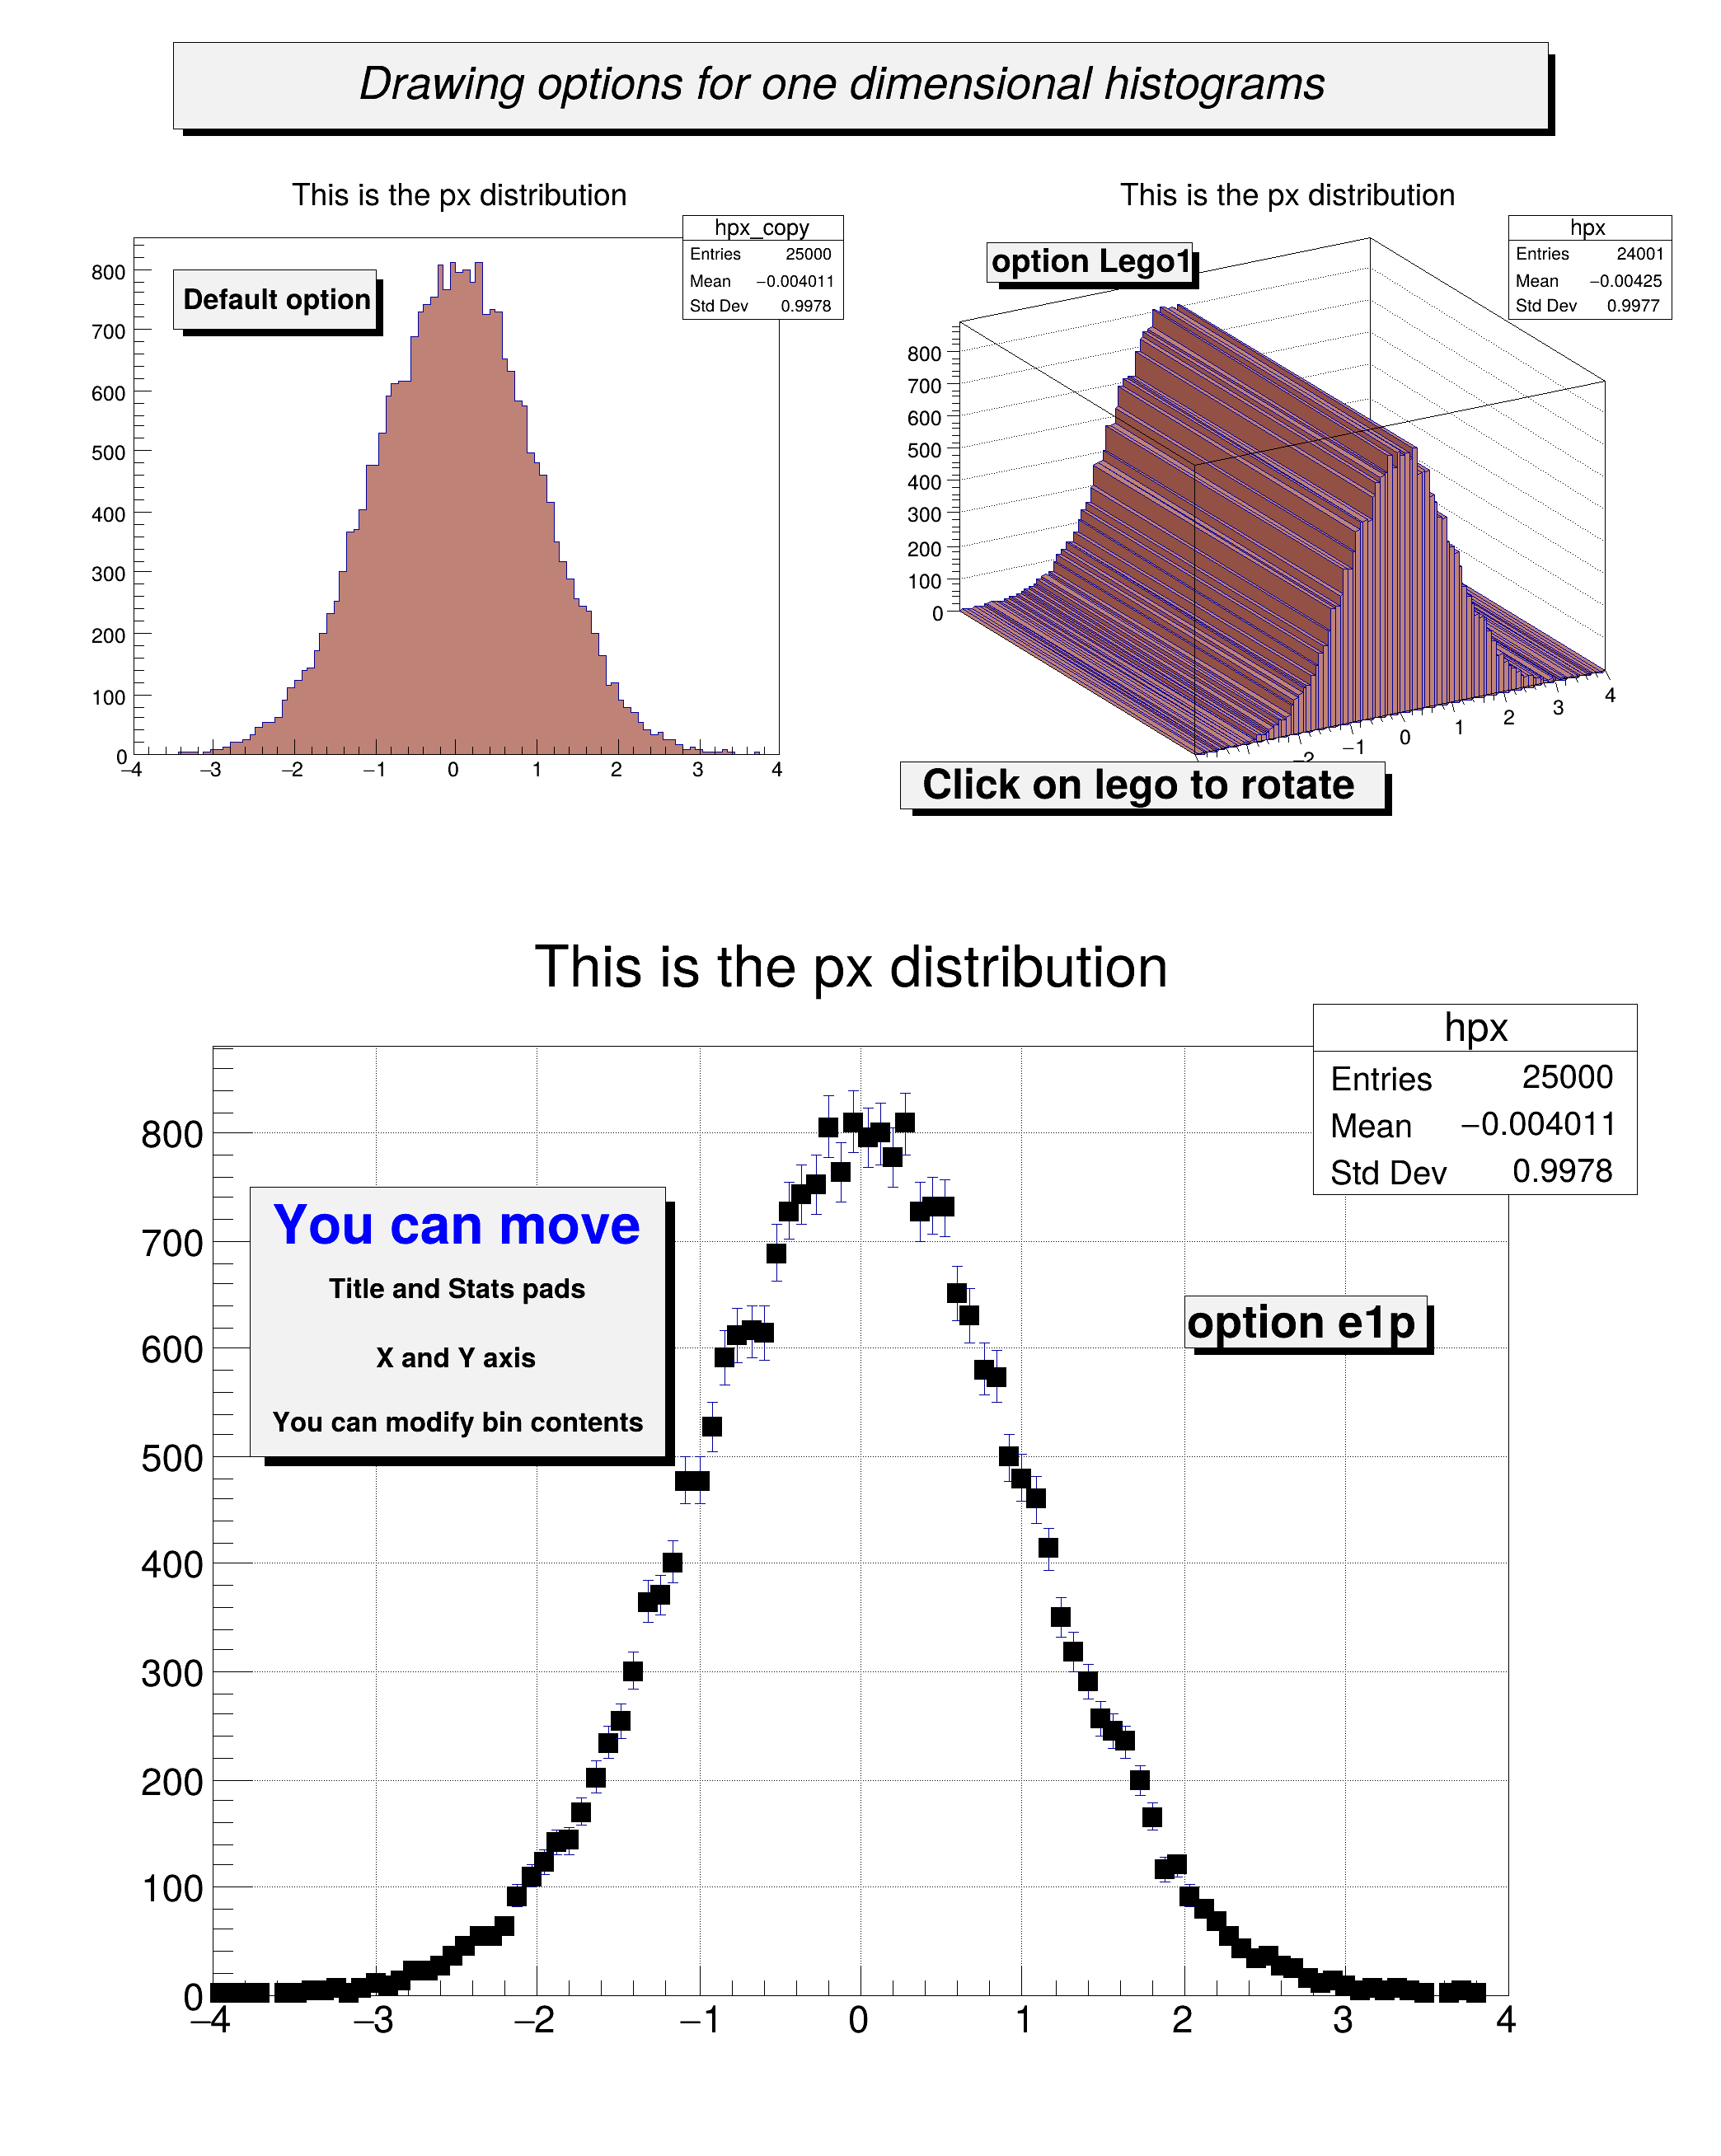
| hist003_TH1_draw.C | |
 Draw a 1D histogram to a canvas. Draw a 1D histogram to a canvas. | |
| hist003_TH1_draw.py | |
| Draw a 1D histogram to a canvas. | |
| hist004_TH1_labels.C | |
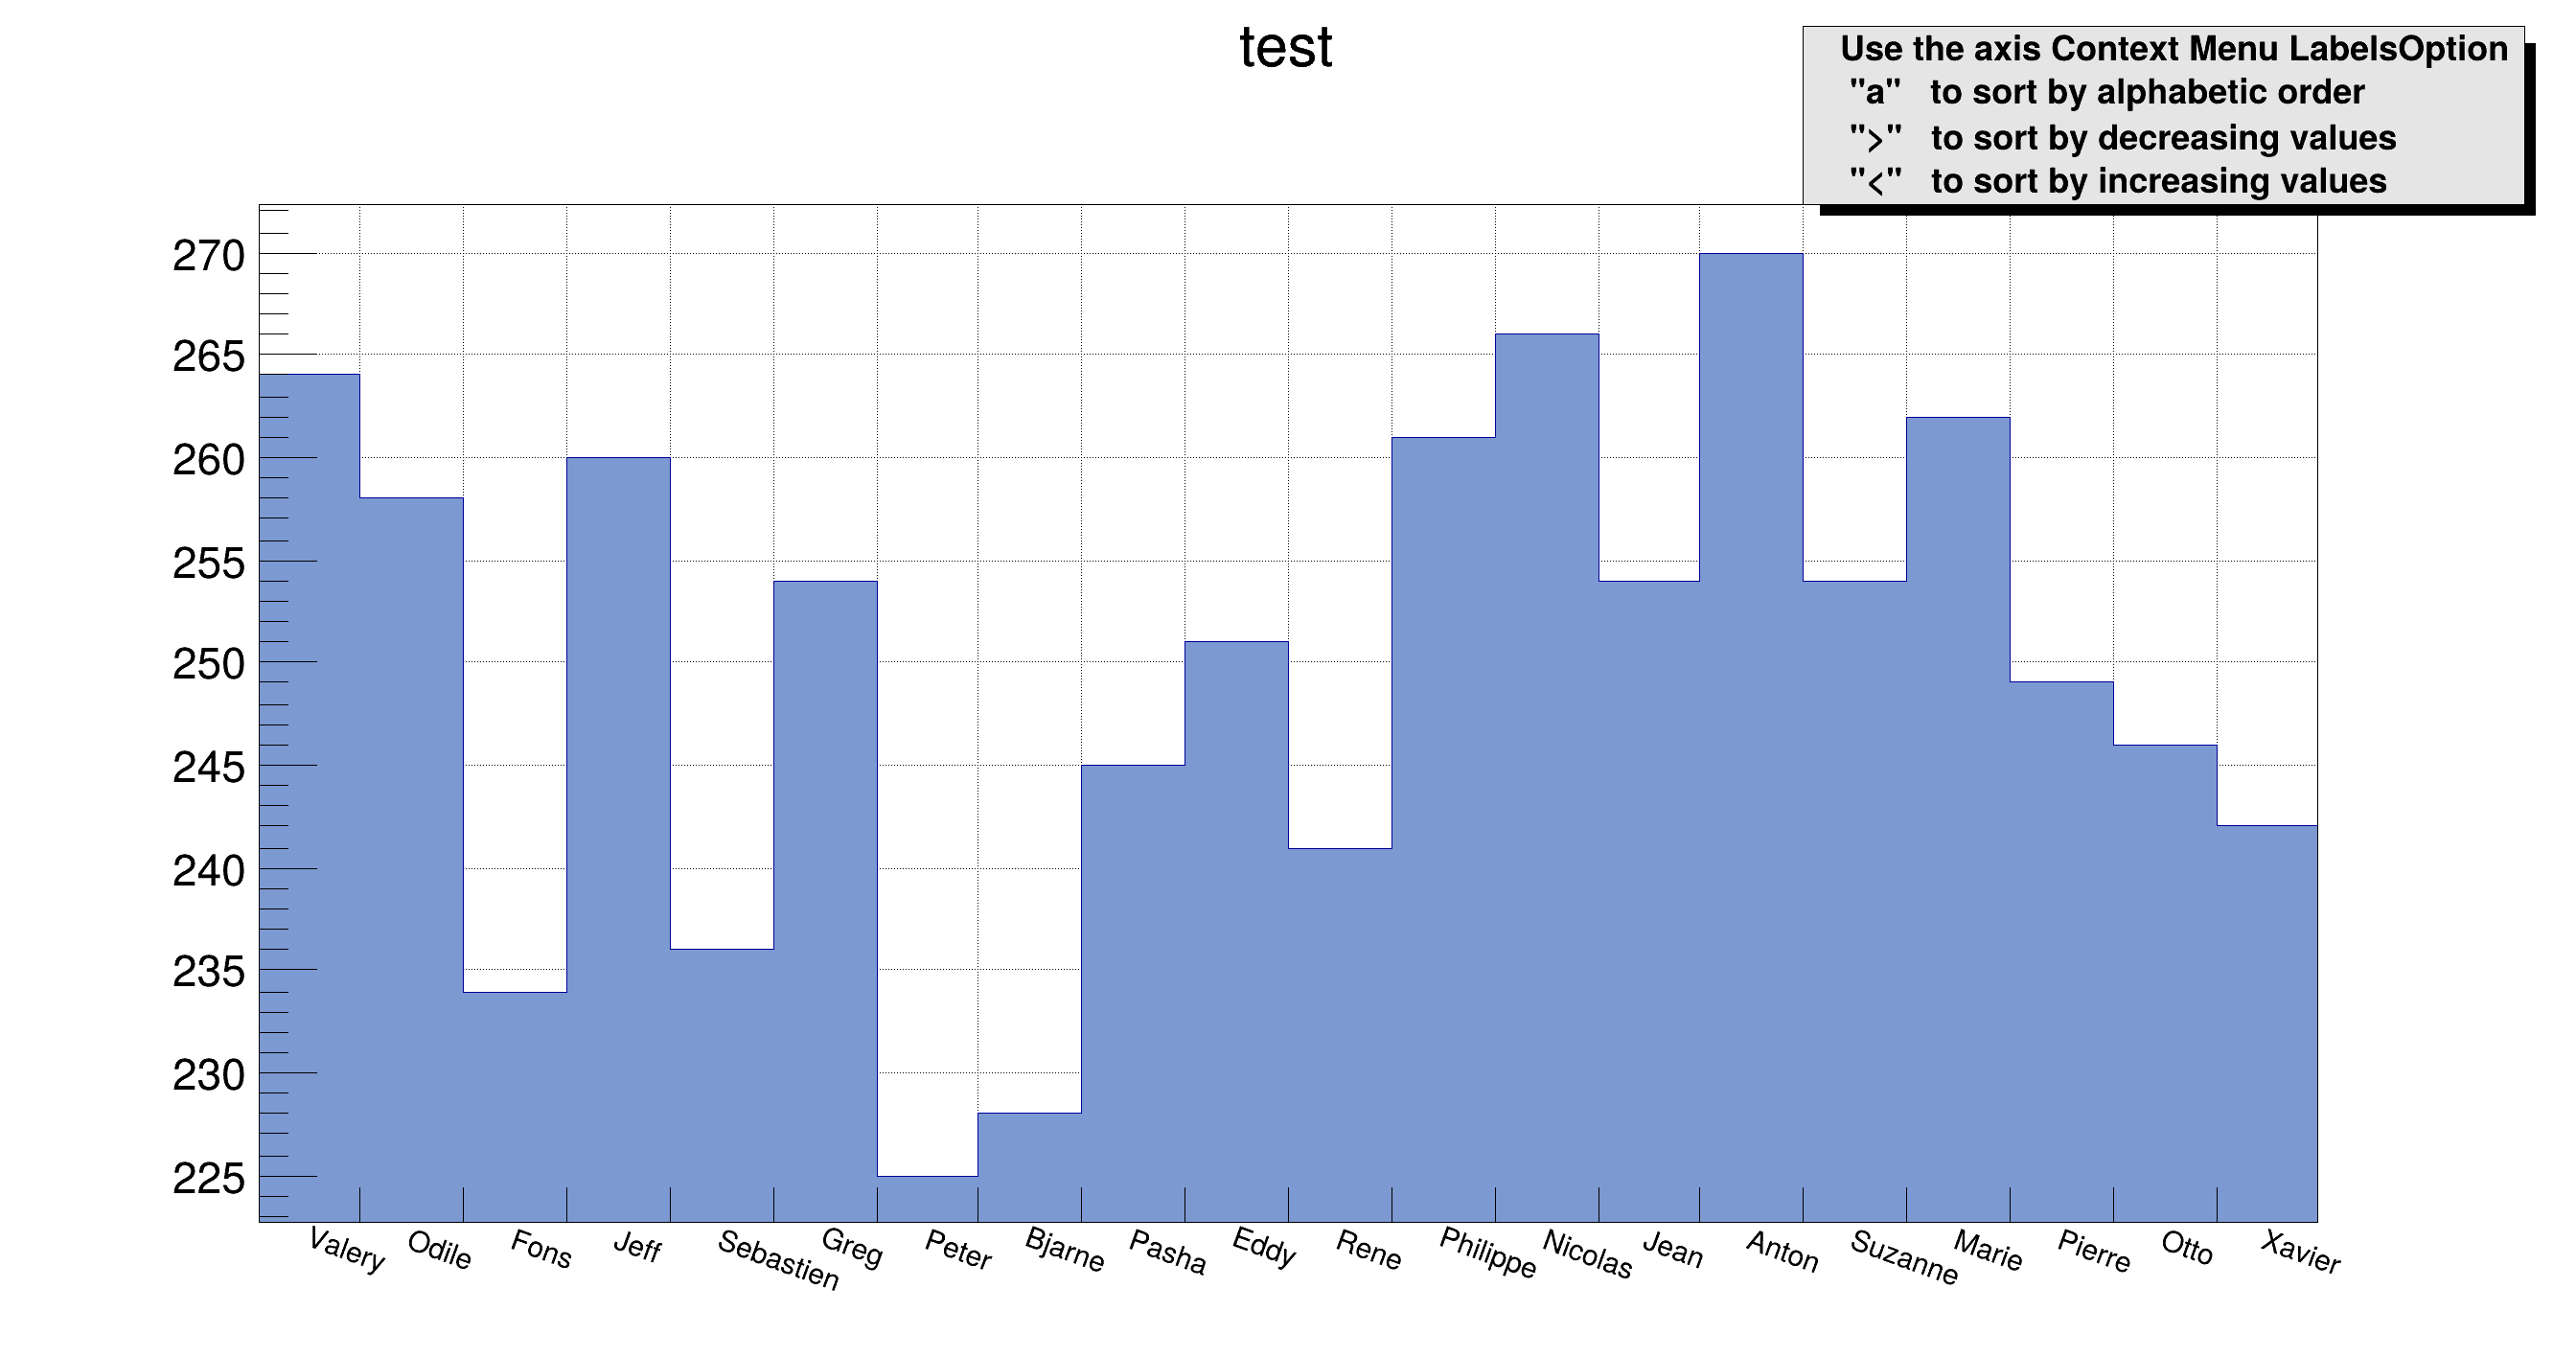 1D histograms with alphanumeric labels. 1D histograms with alphanumeric labels. | |
| hist005_TH1_palettecolor.C | |
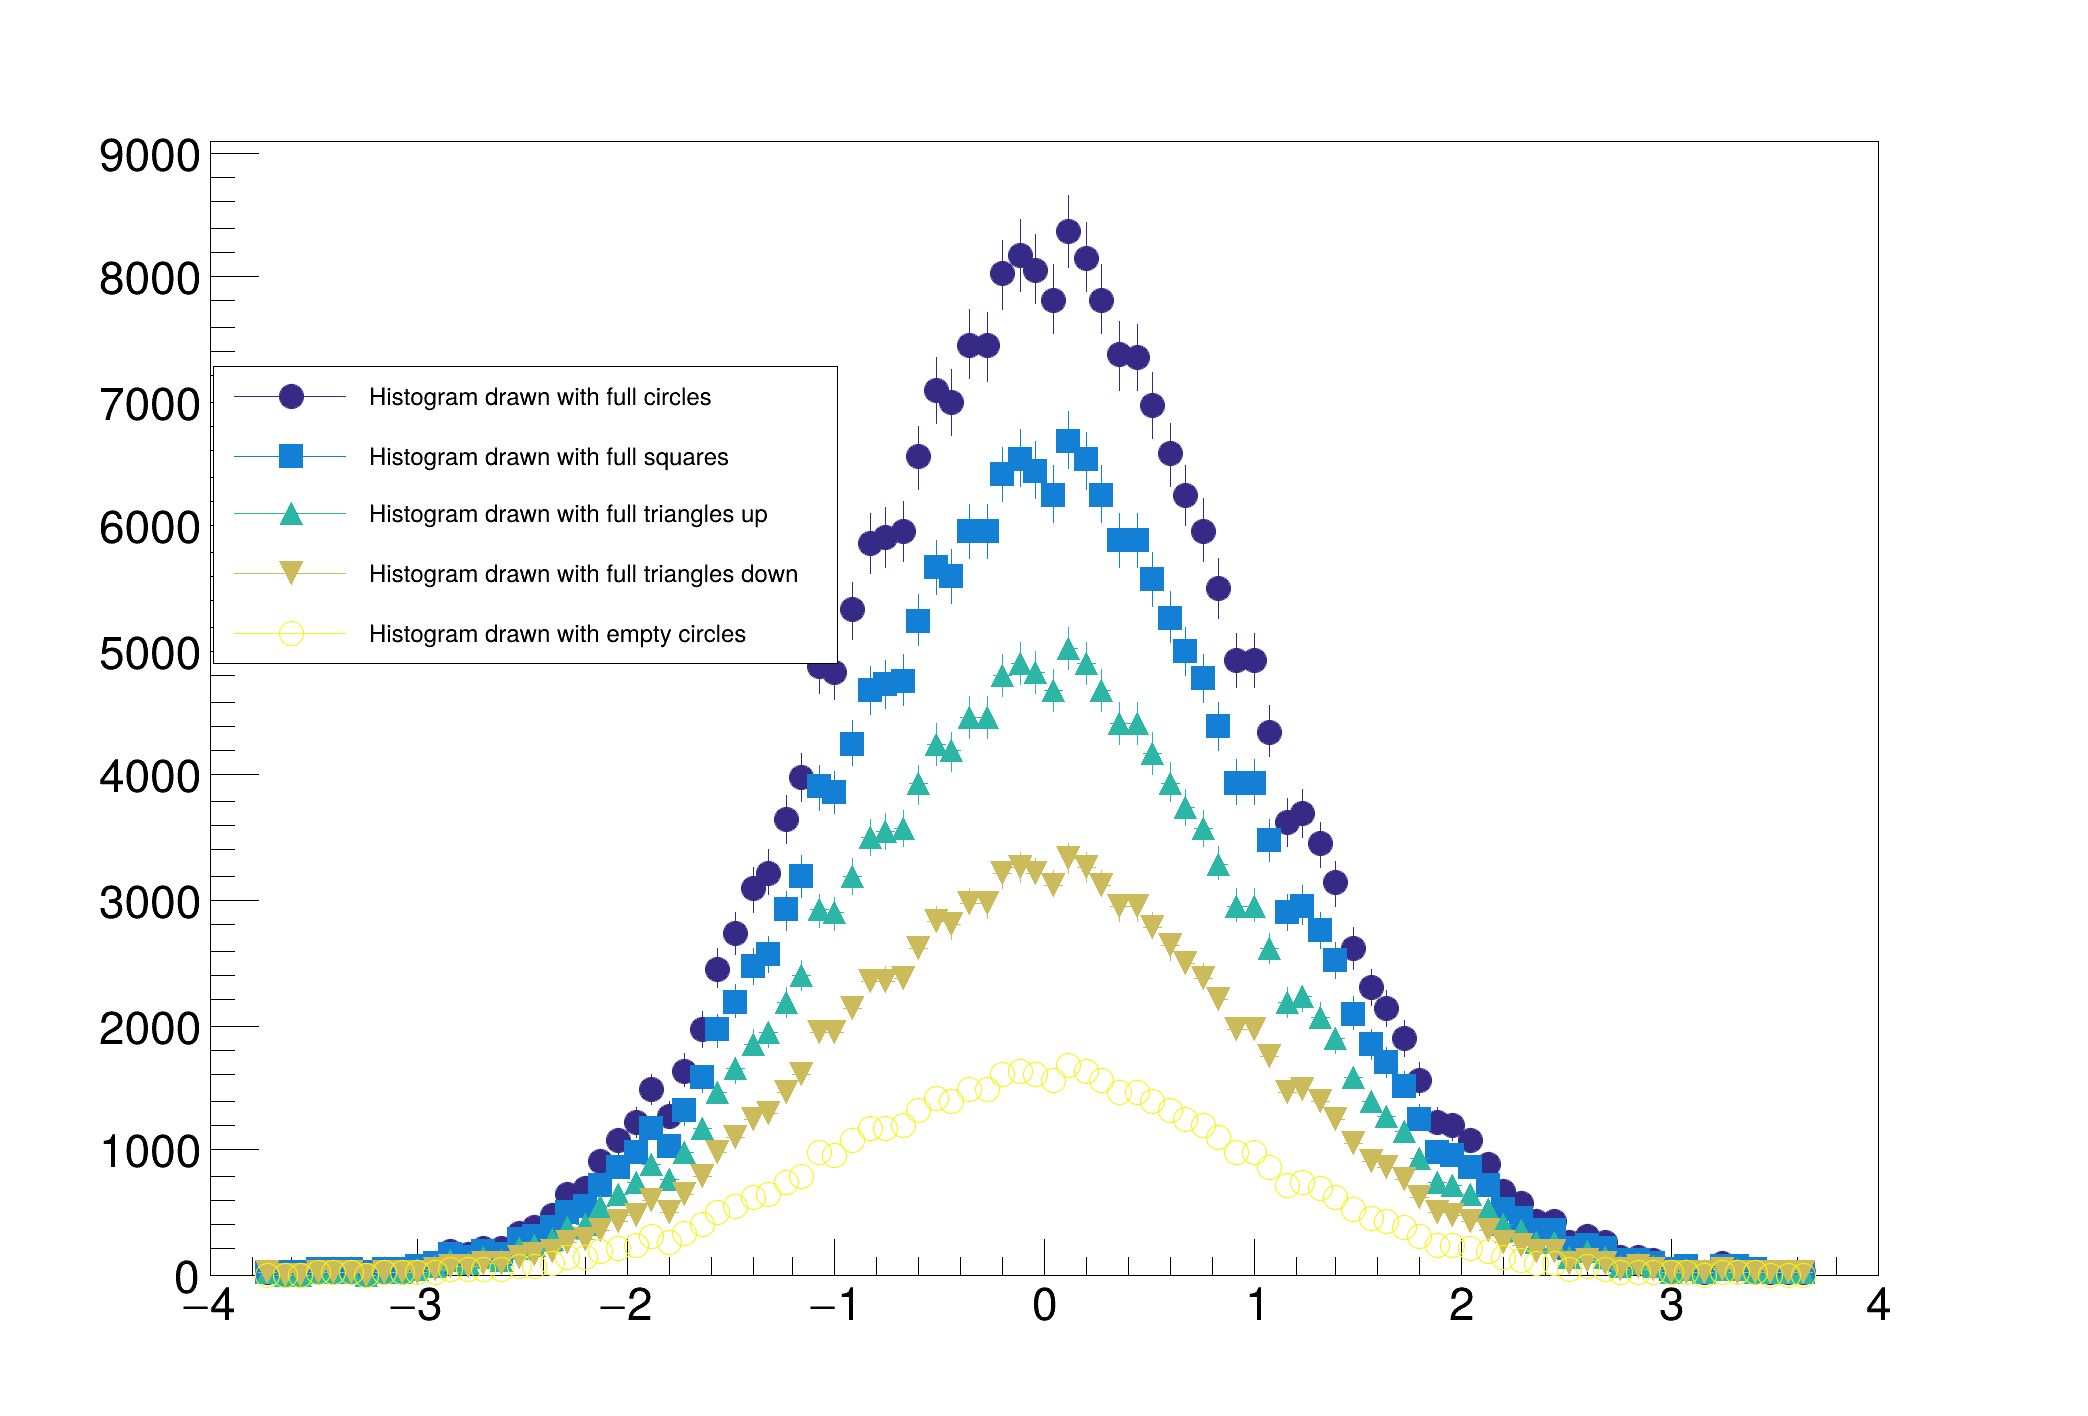 Palette coloring for TH1. Palette coloring for TH1. | |
| hist006_TH1_bar_charts.C | |
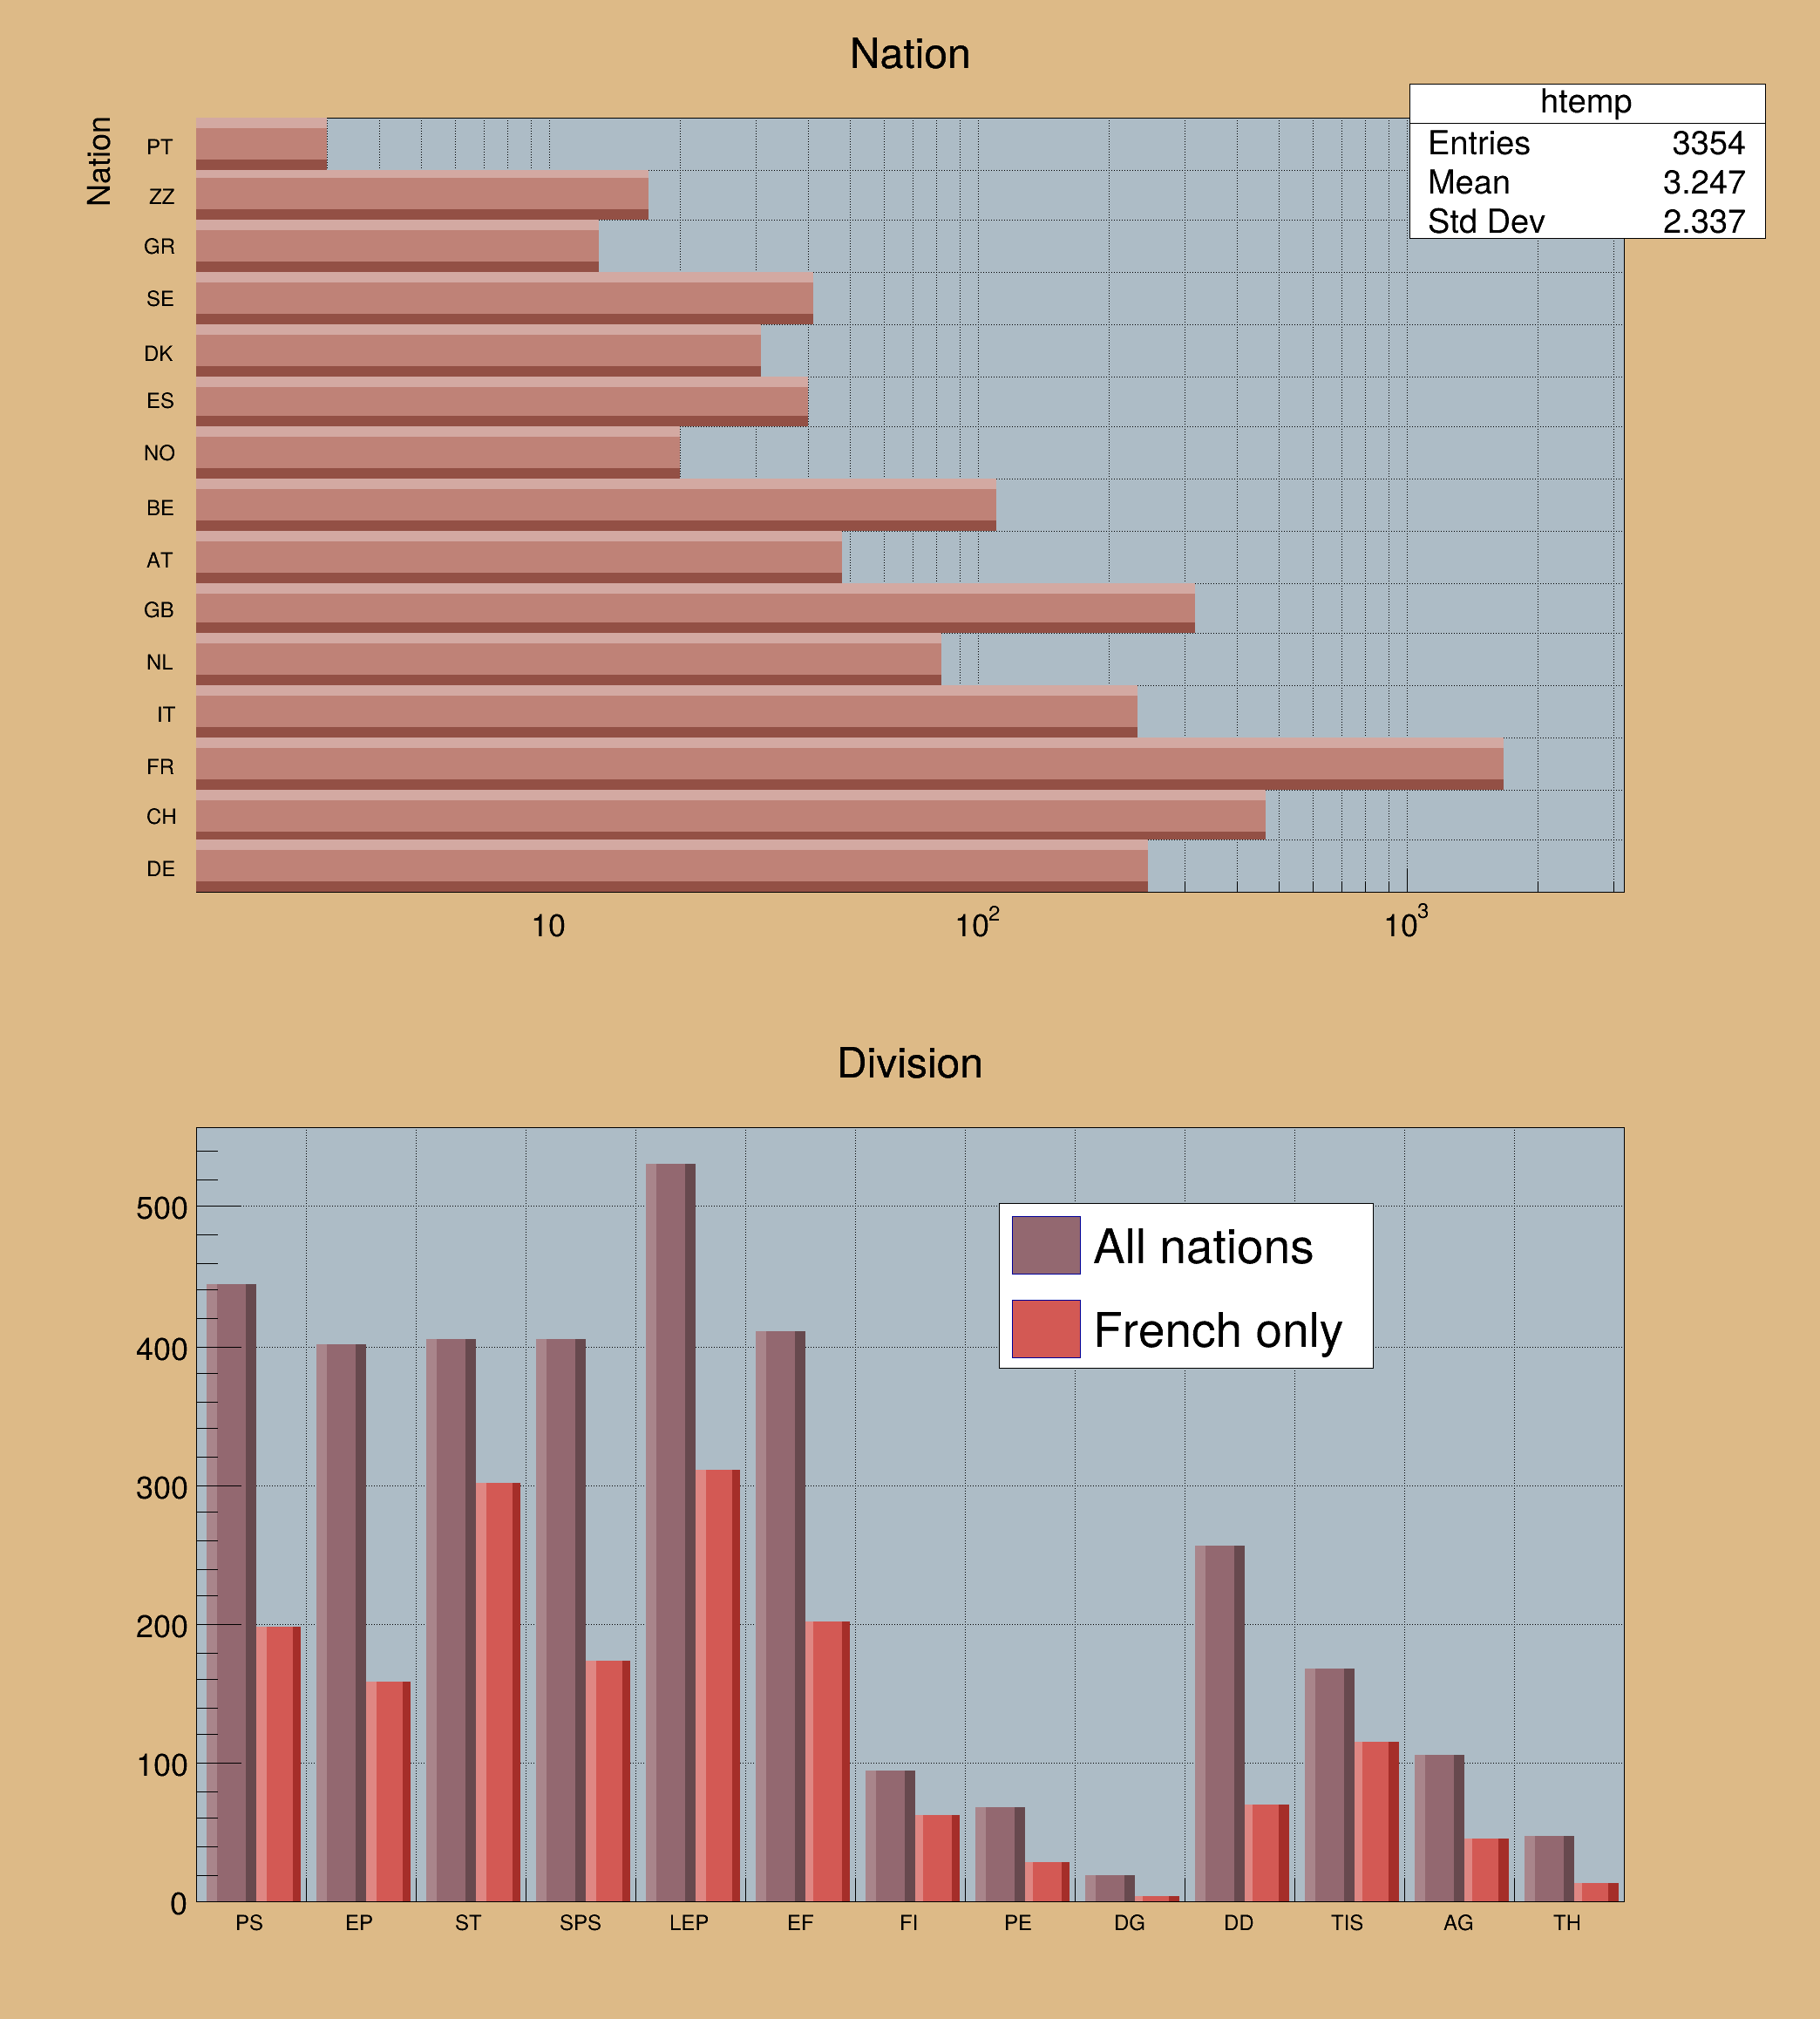 Draw 1D histograms as bar charts. Draw 1D histograms as bar charts. | |
| hist007_TH1_liveupdate.C | |
 Histograms filled and drawn in a loop. Histograms filled and drawn in a loop. | |
| hist007_TH1_liveupdate.py | |
| Simple example illustrating how to use the C++ interpreter. | |
| hist008_TH1_zoom.C | |
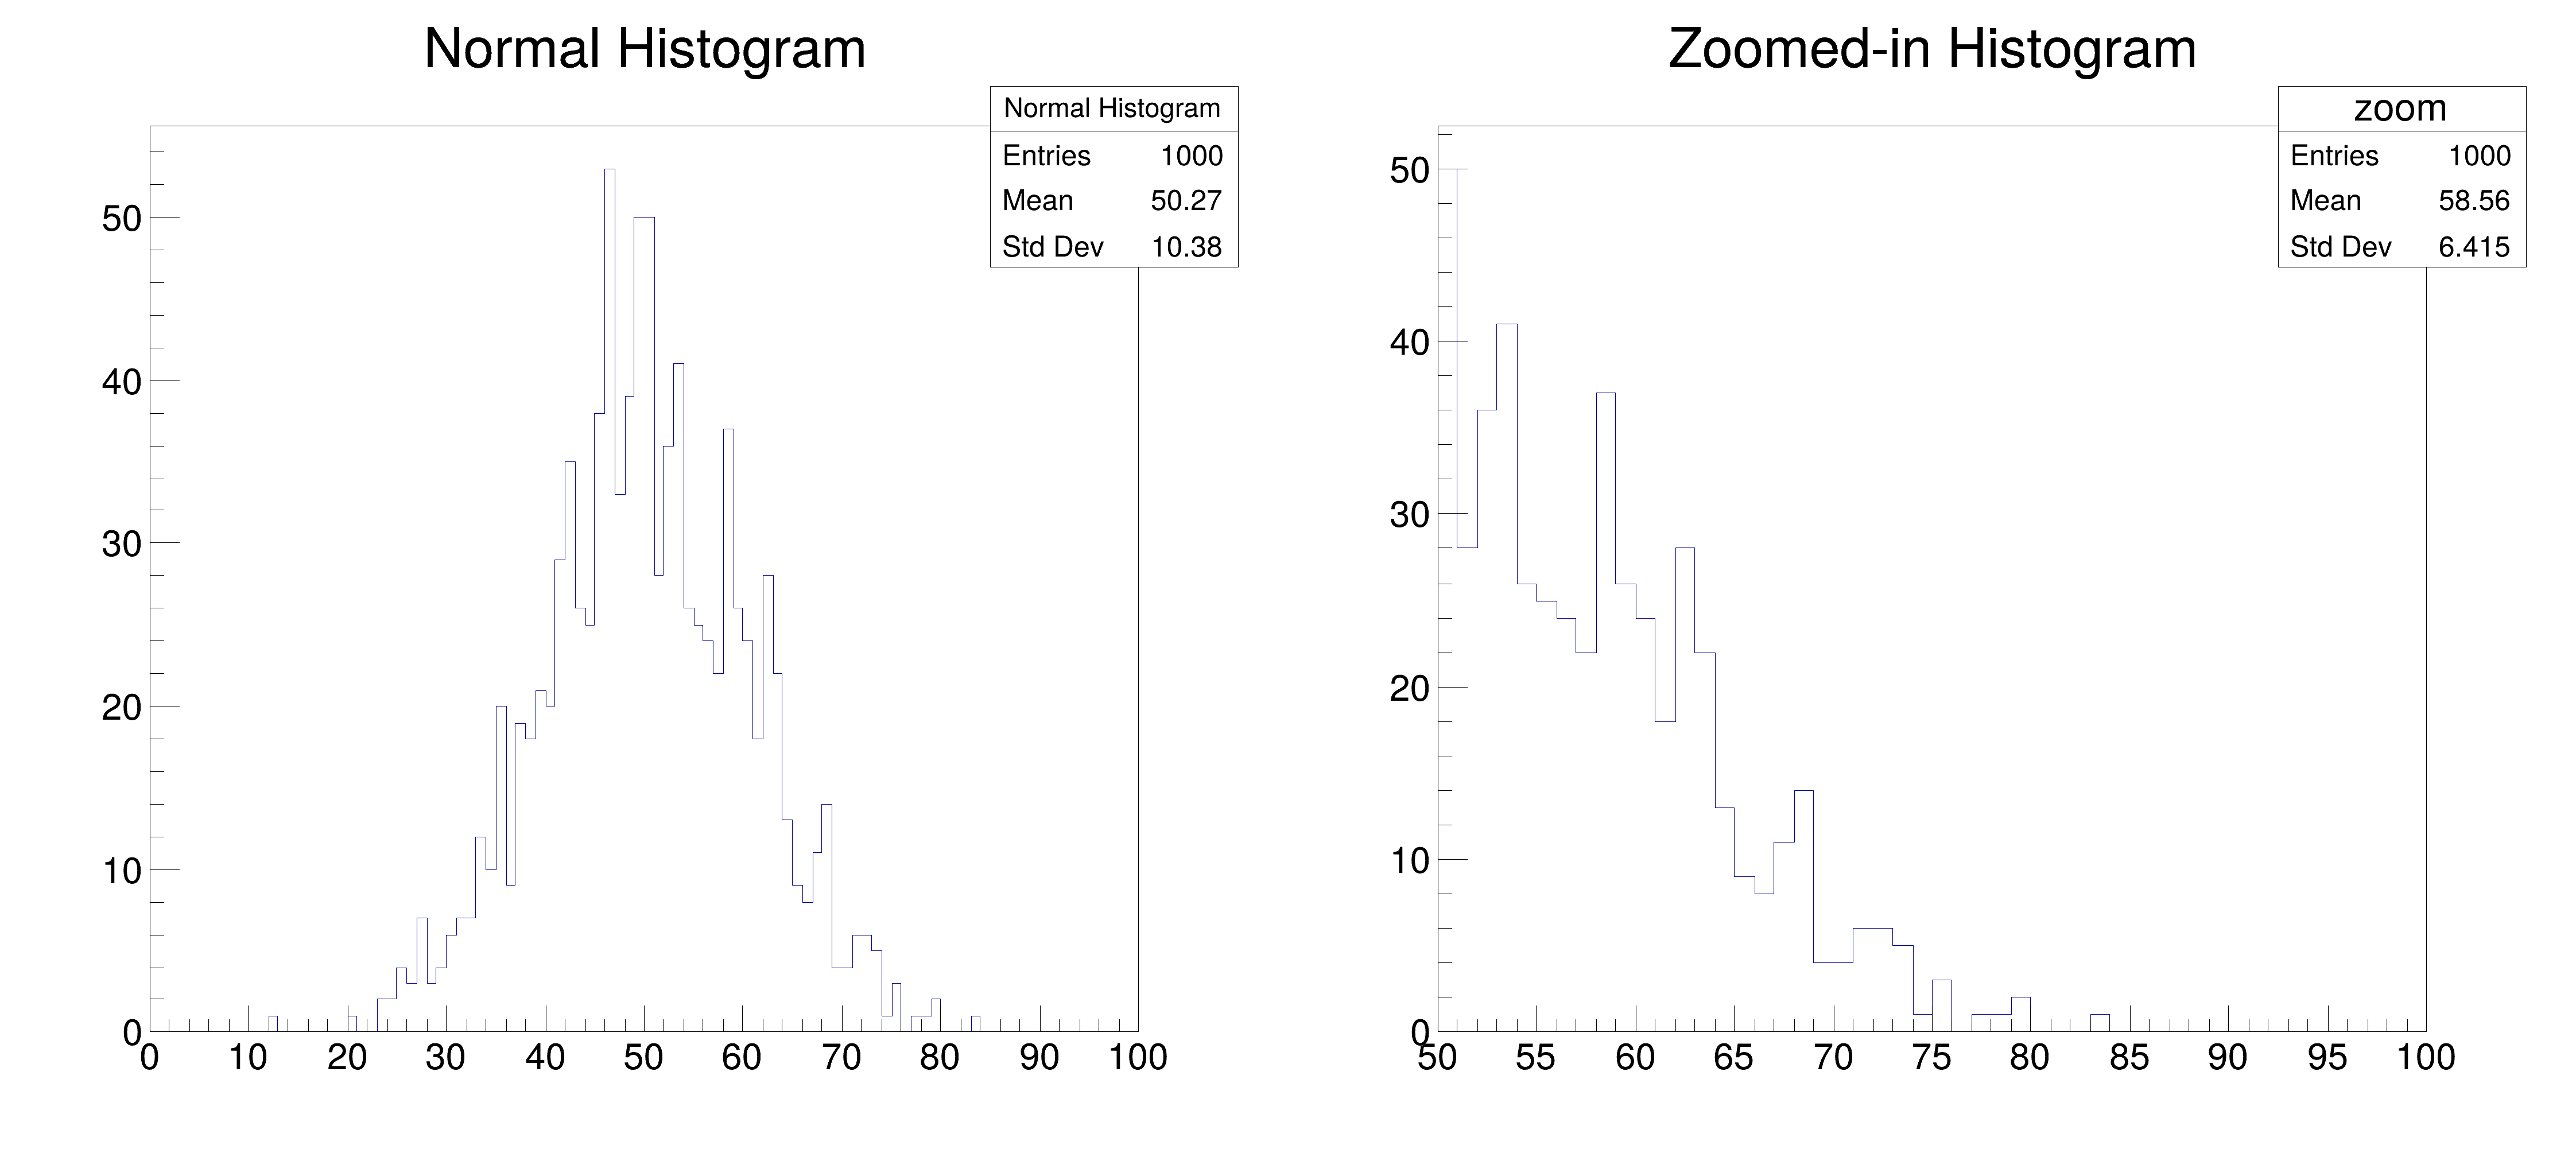 Changing the Range on the X-Axis of a Histogram. Changing the Range on the X-Axis of a Histogram. | |
| hist009_TH1_normalize.C | |
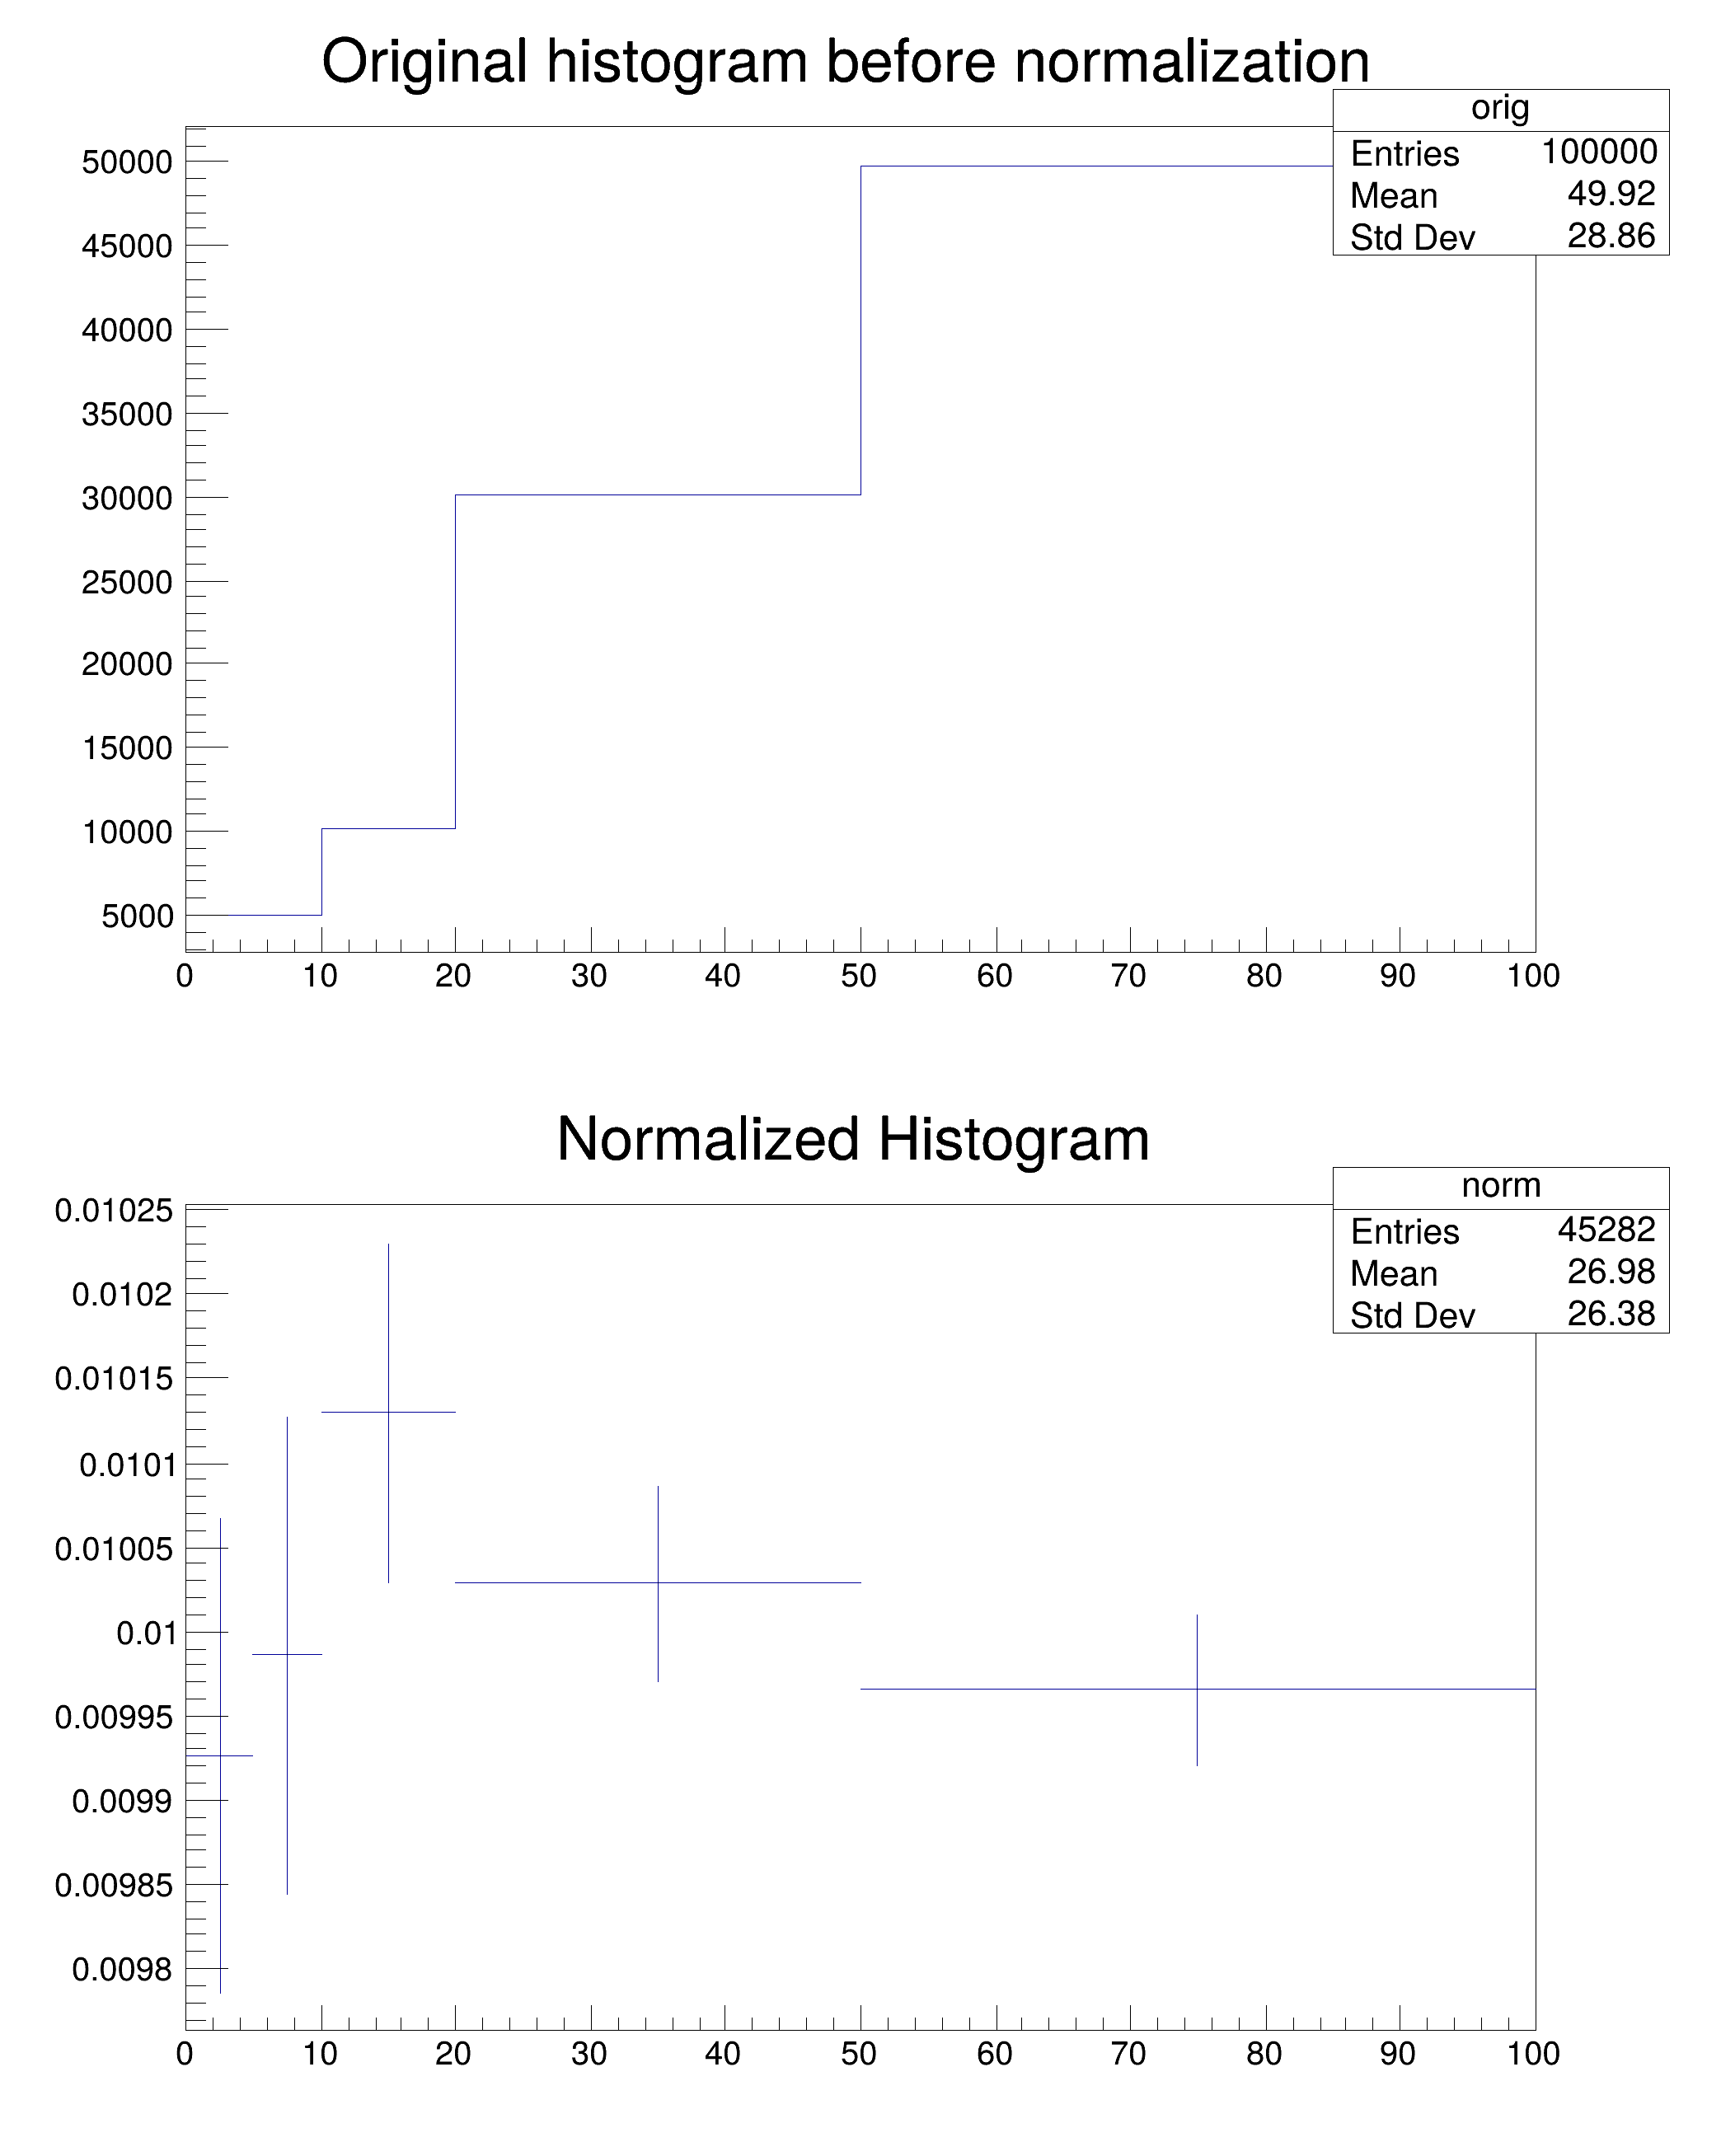 Normalizing a Histogram. Normalizing a Histogram. | |
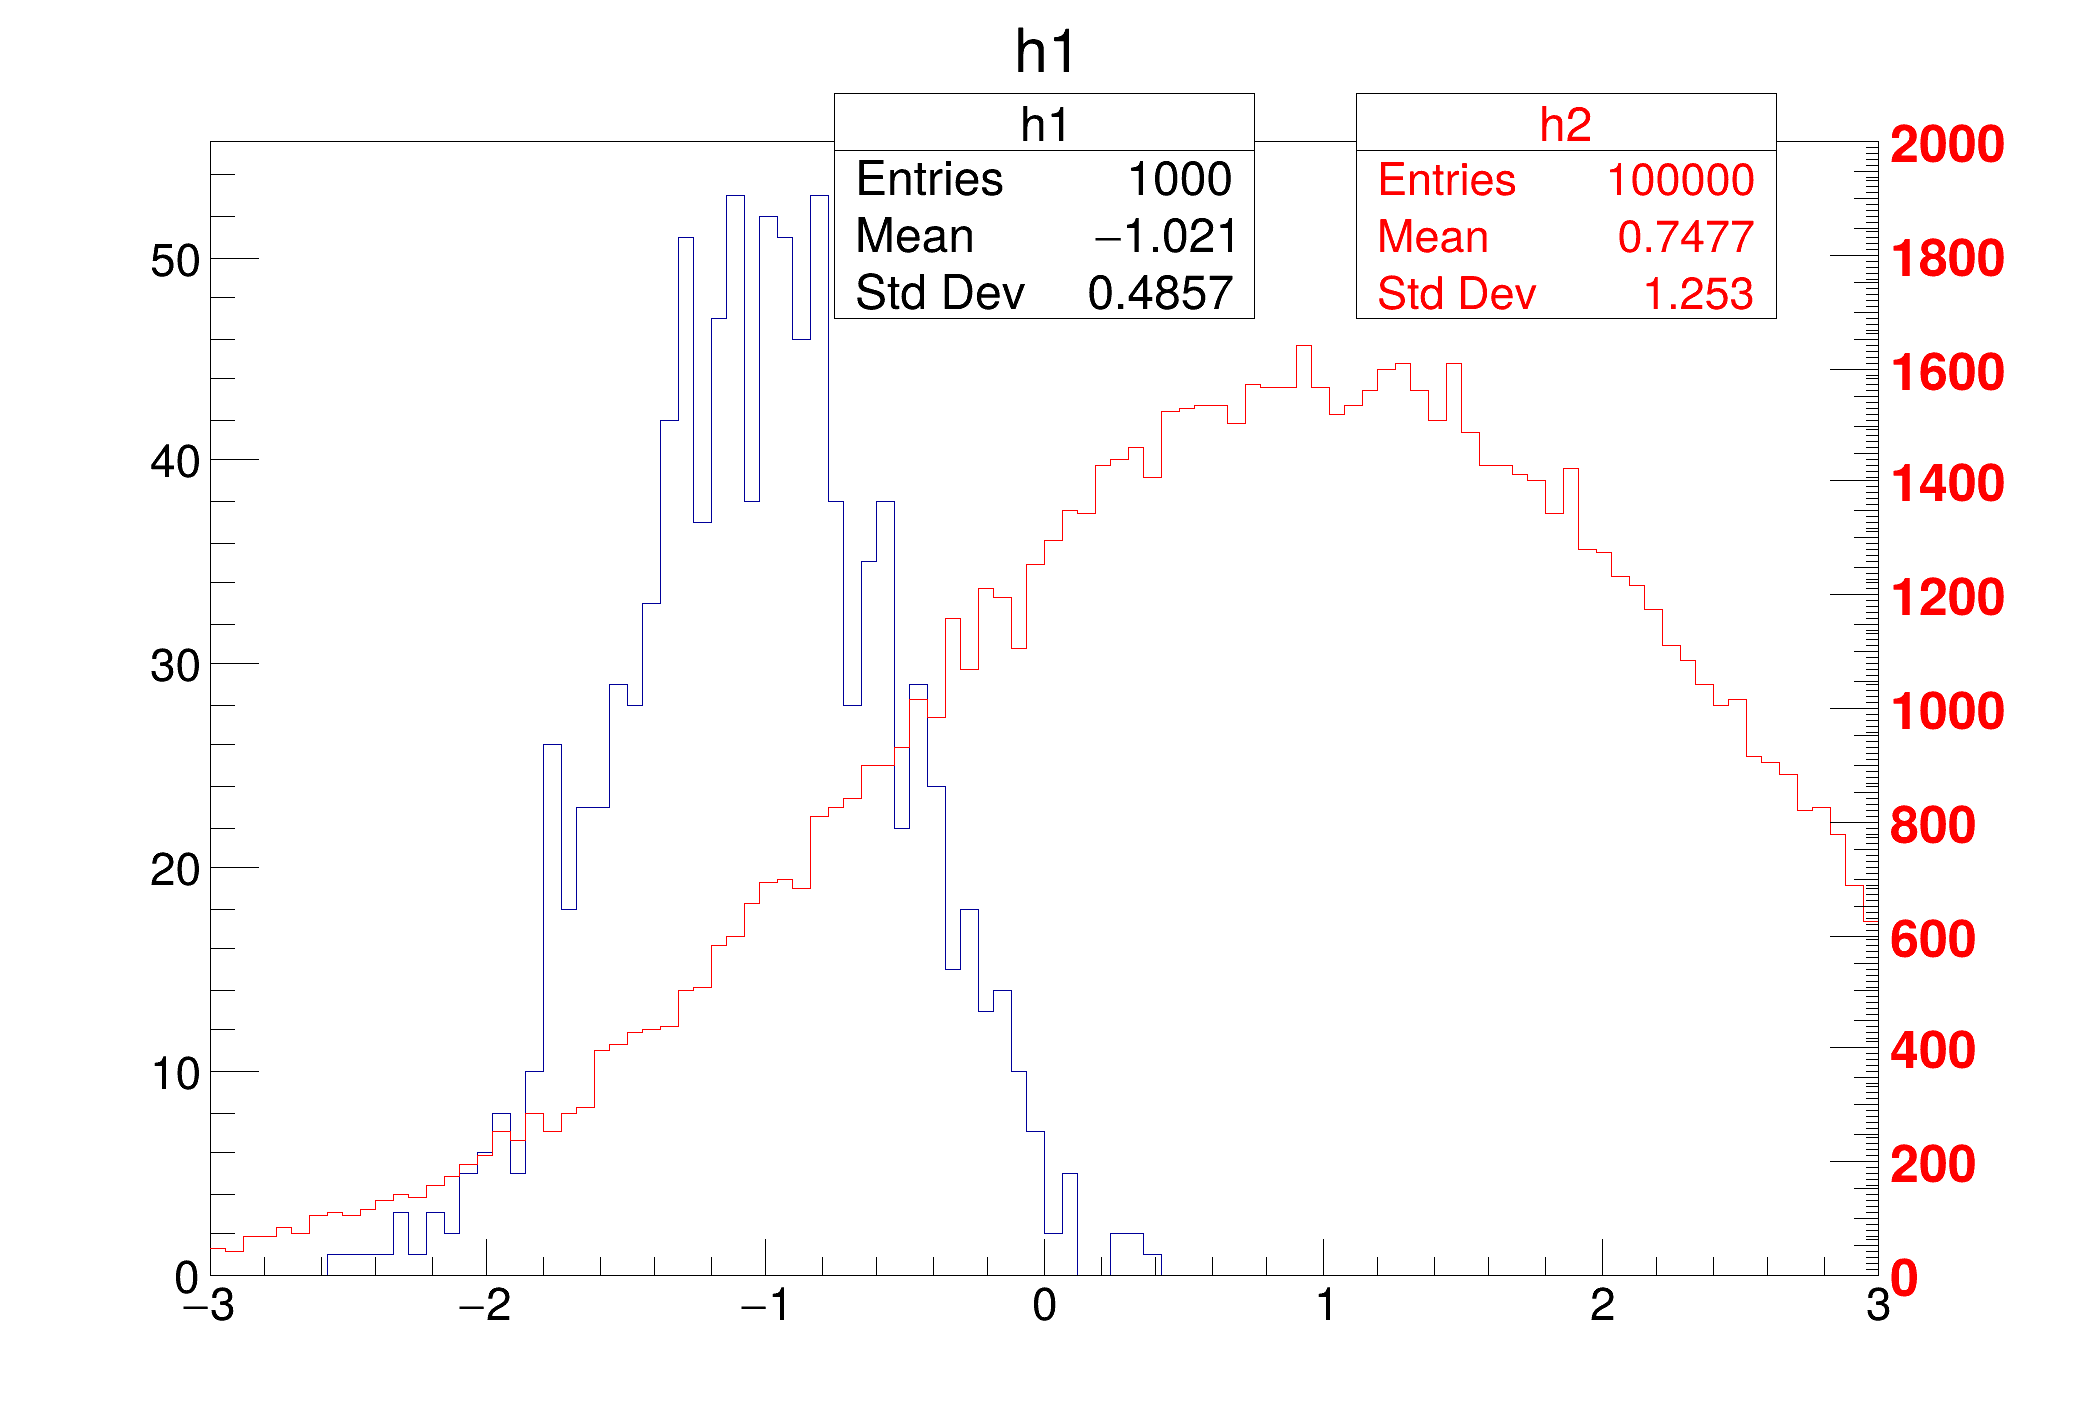
| hist010_TH1_two_scales.C | |
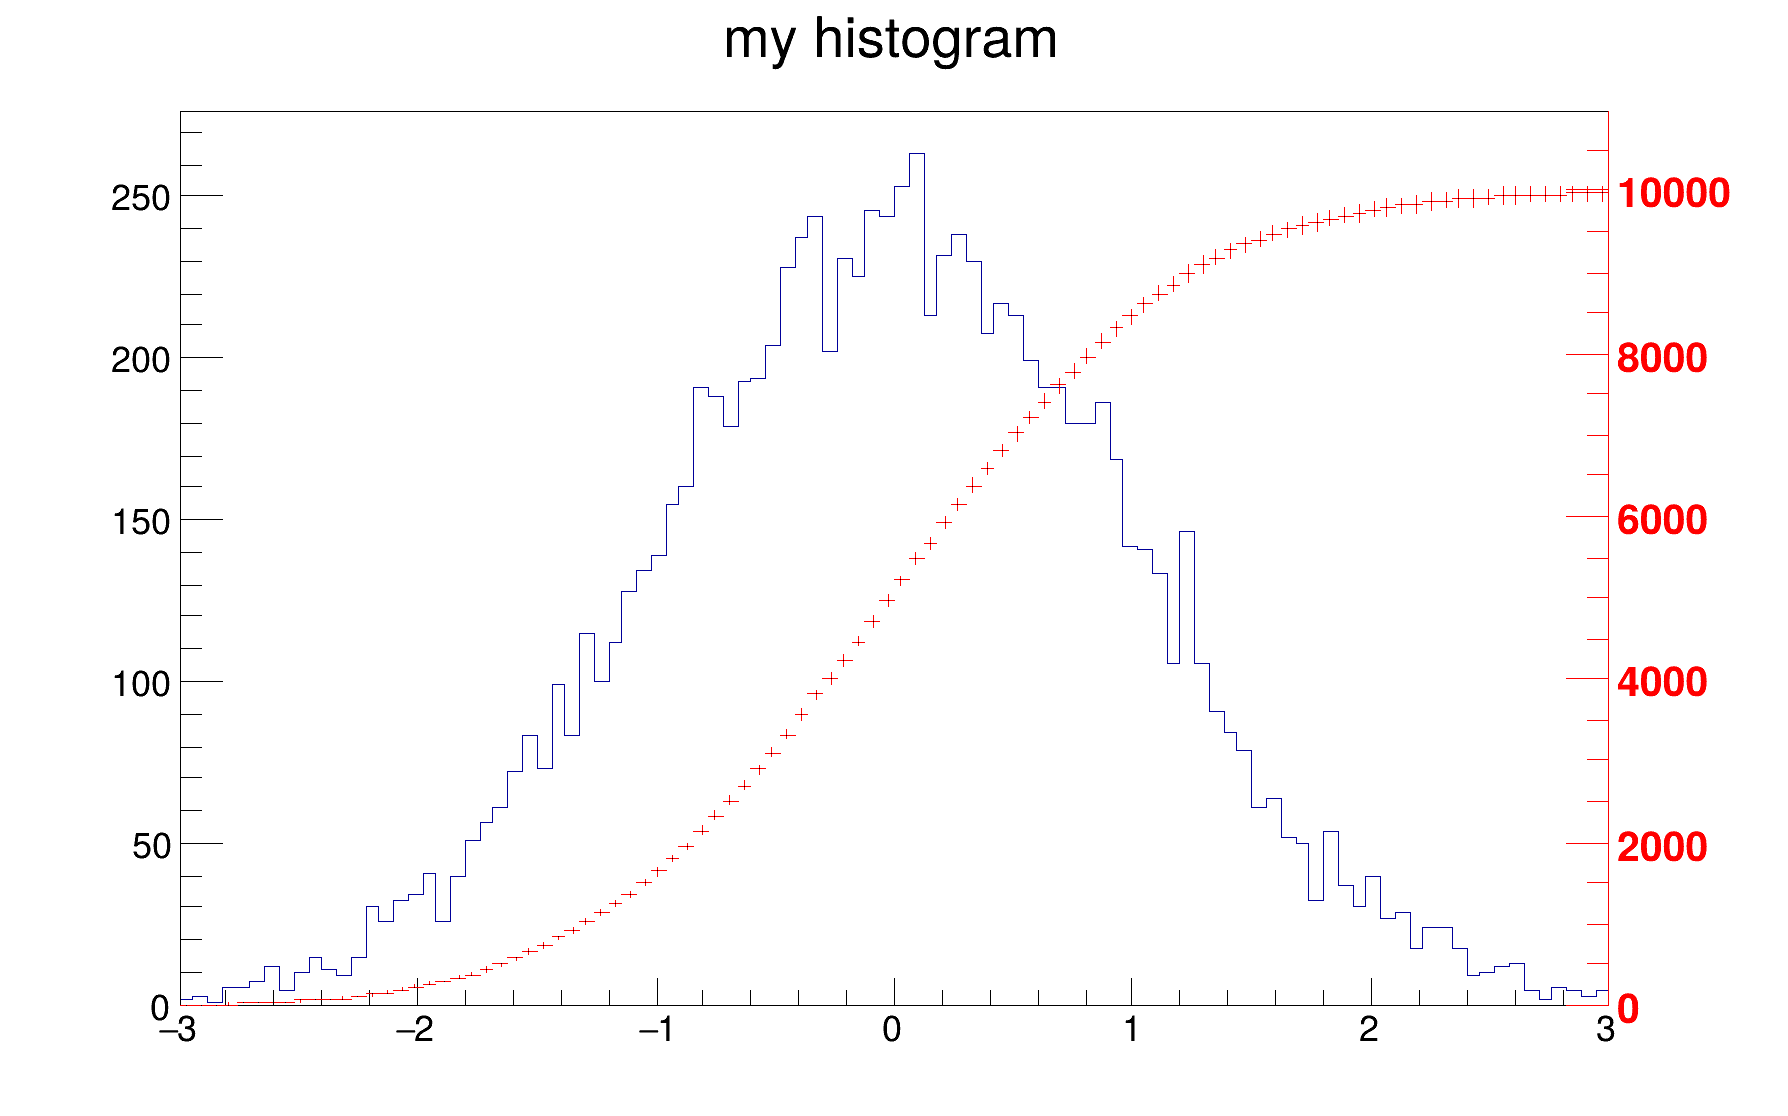 Example of macro illustrating how to superimpose two histograms with different scales in the "same" pad. Example of macro illustrating how to superimpose two histograms with different scales in the "same" pad. | |
| hist010_TH1_two_scales.py | |
| Example of macro illustrating how to superimpose two histograms with different scales in the "same" pad. | |
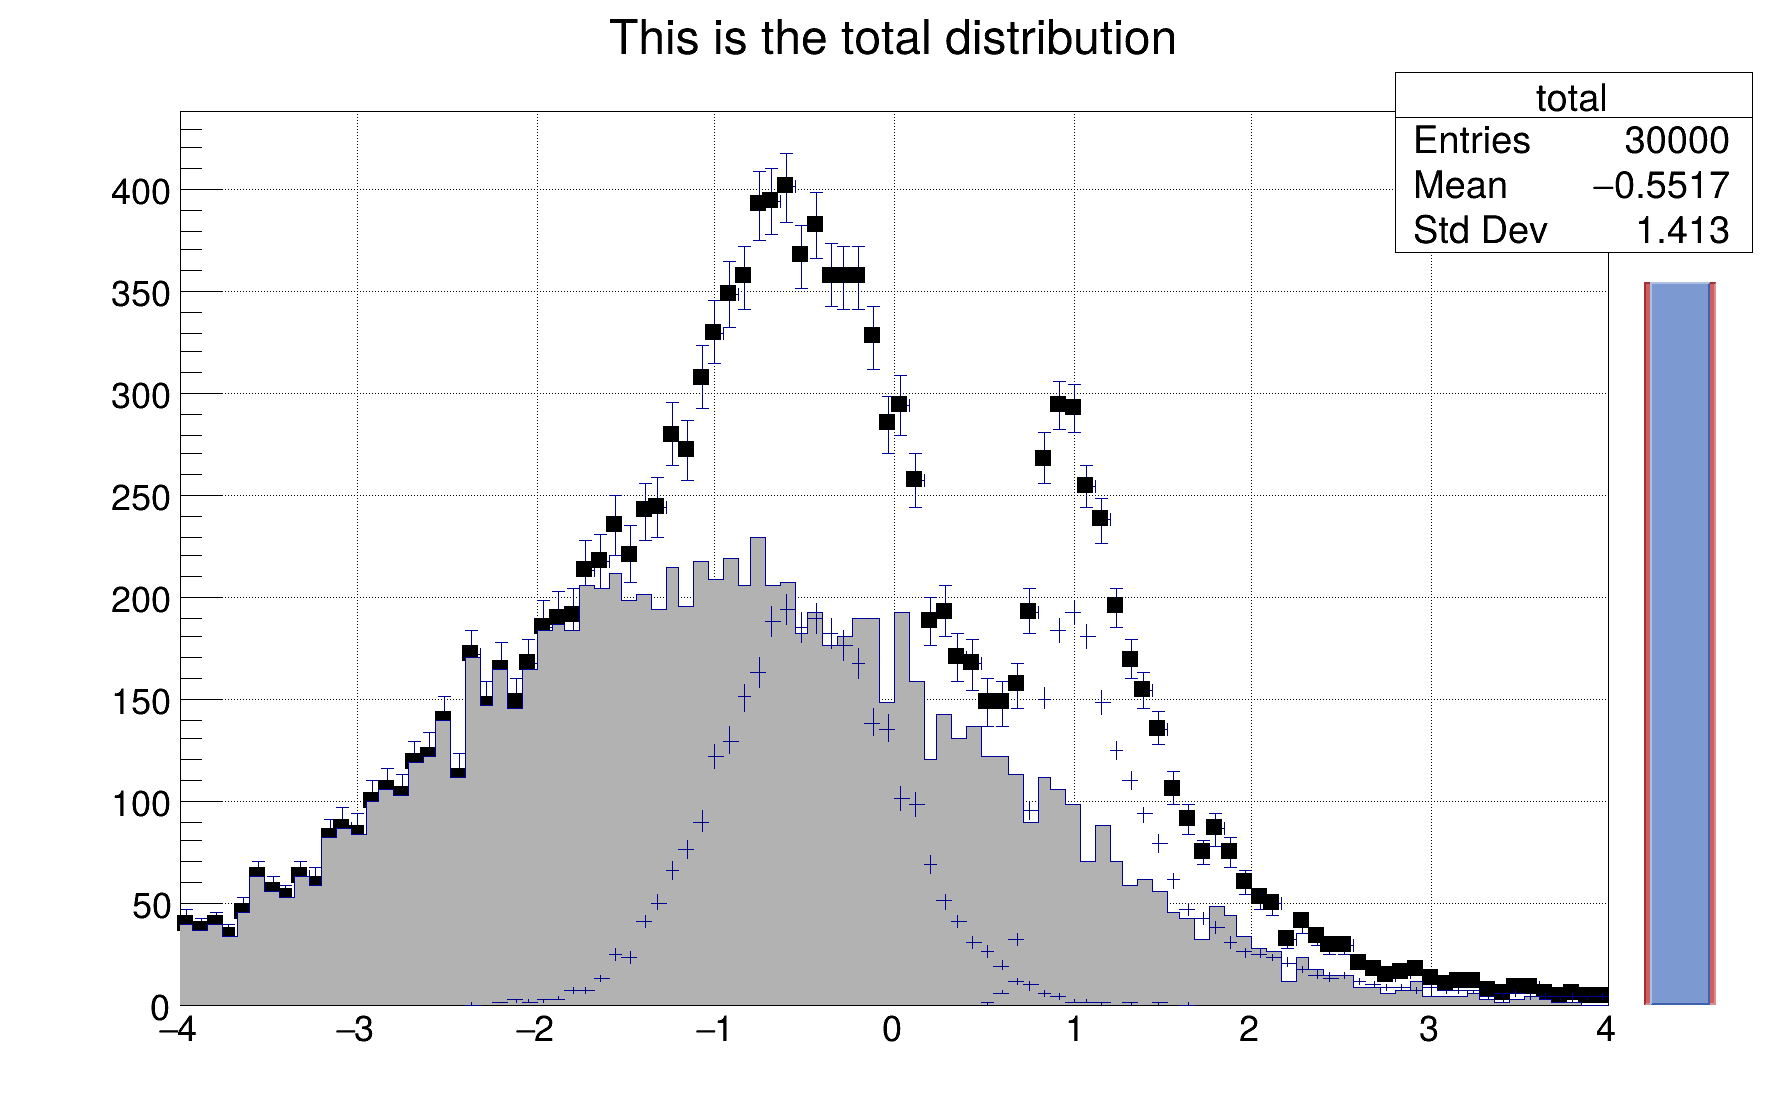
| hist011_TH1_legend_autoplaced.C | |
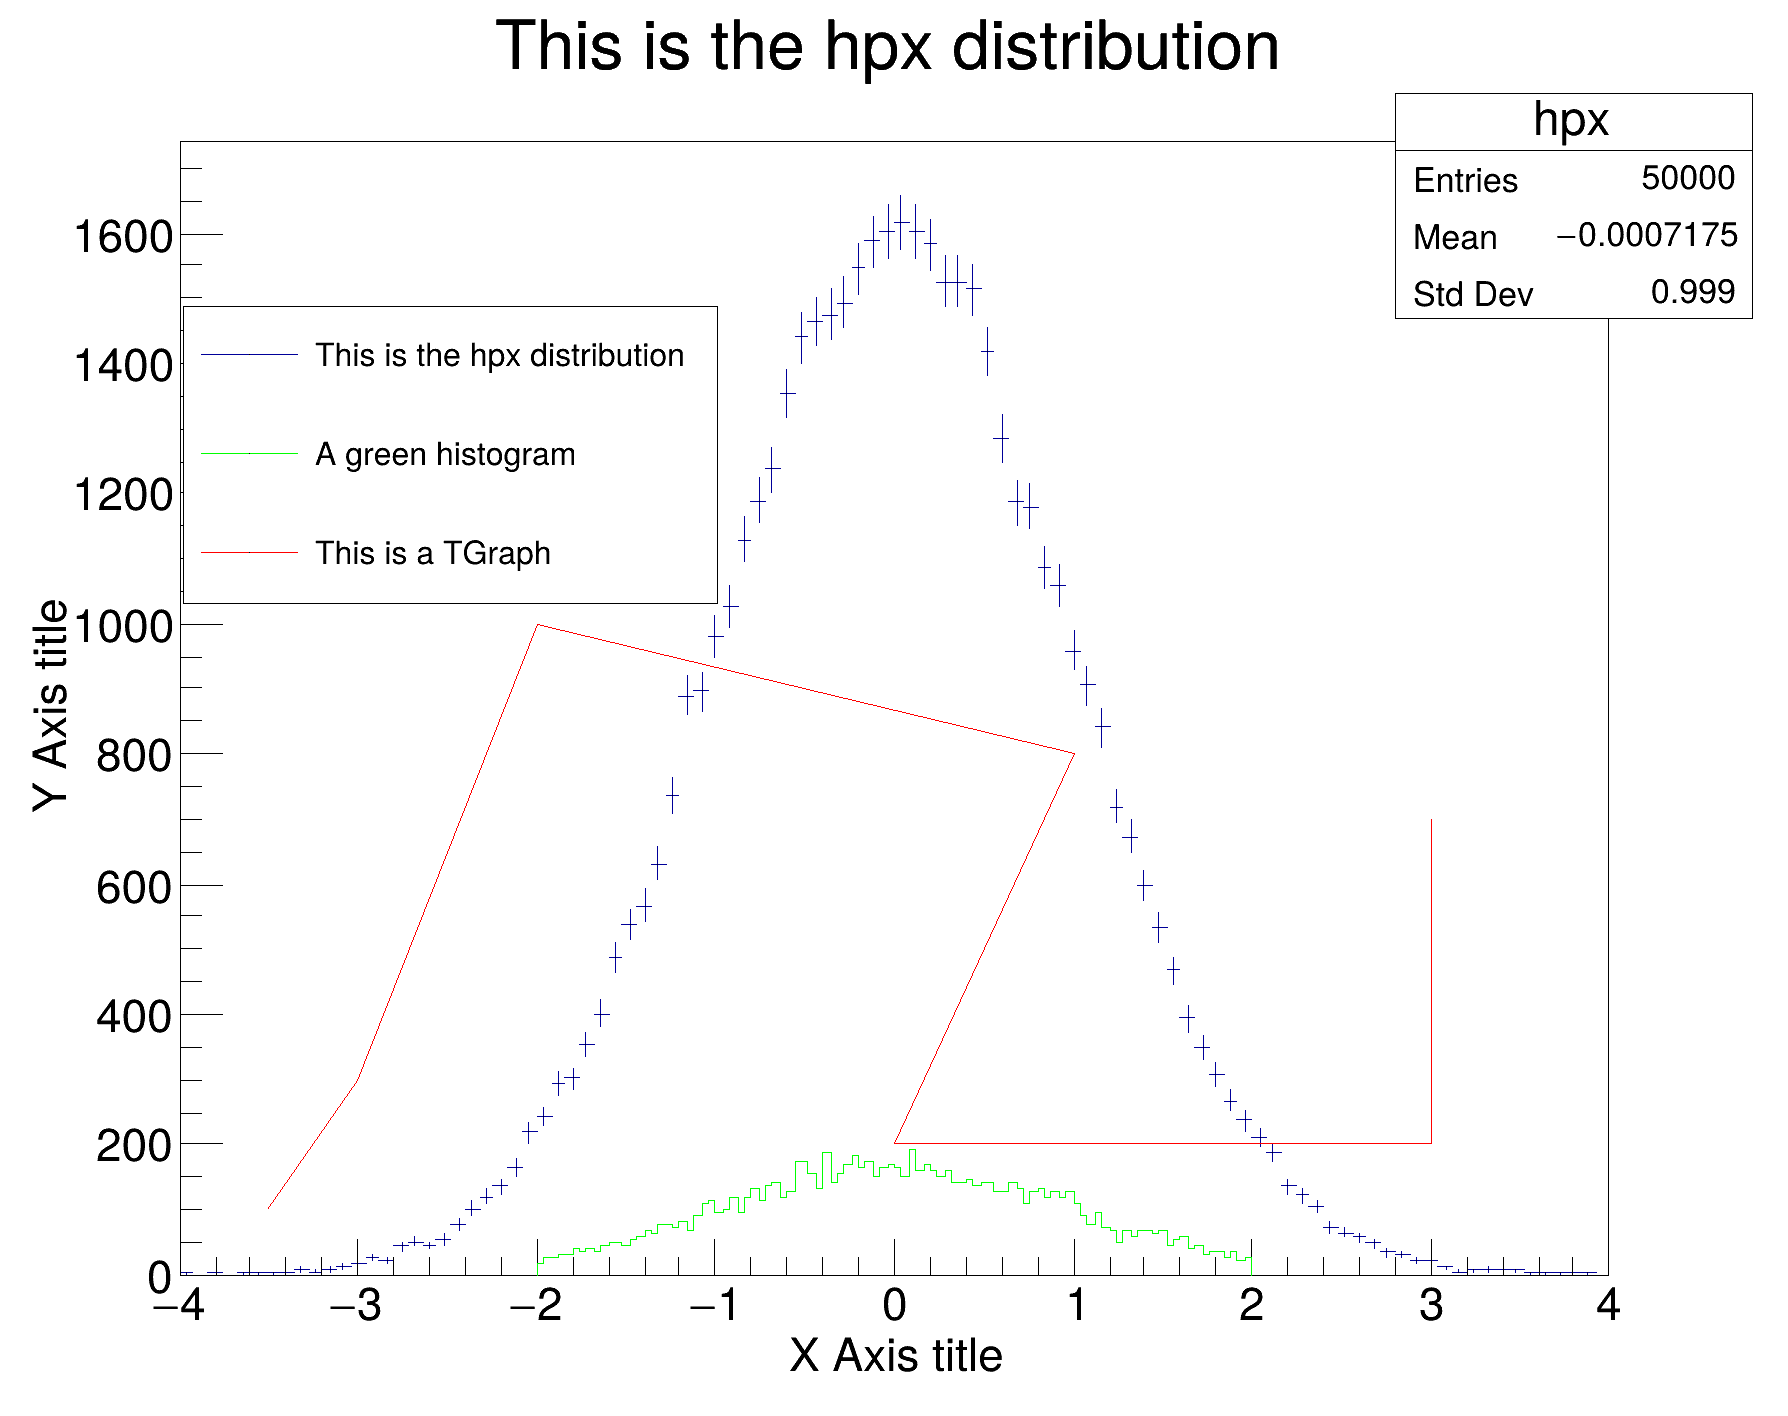 The legend can be placed automatically in the current pad in an empty space found at painting time. The legend can be placed automatically in the current pad in an empty space found at painting time. | |
| hist012_TH1_hksimple.C | |
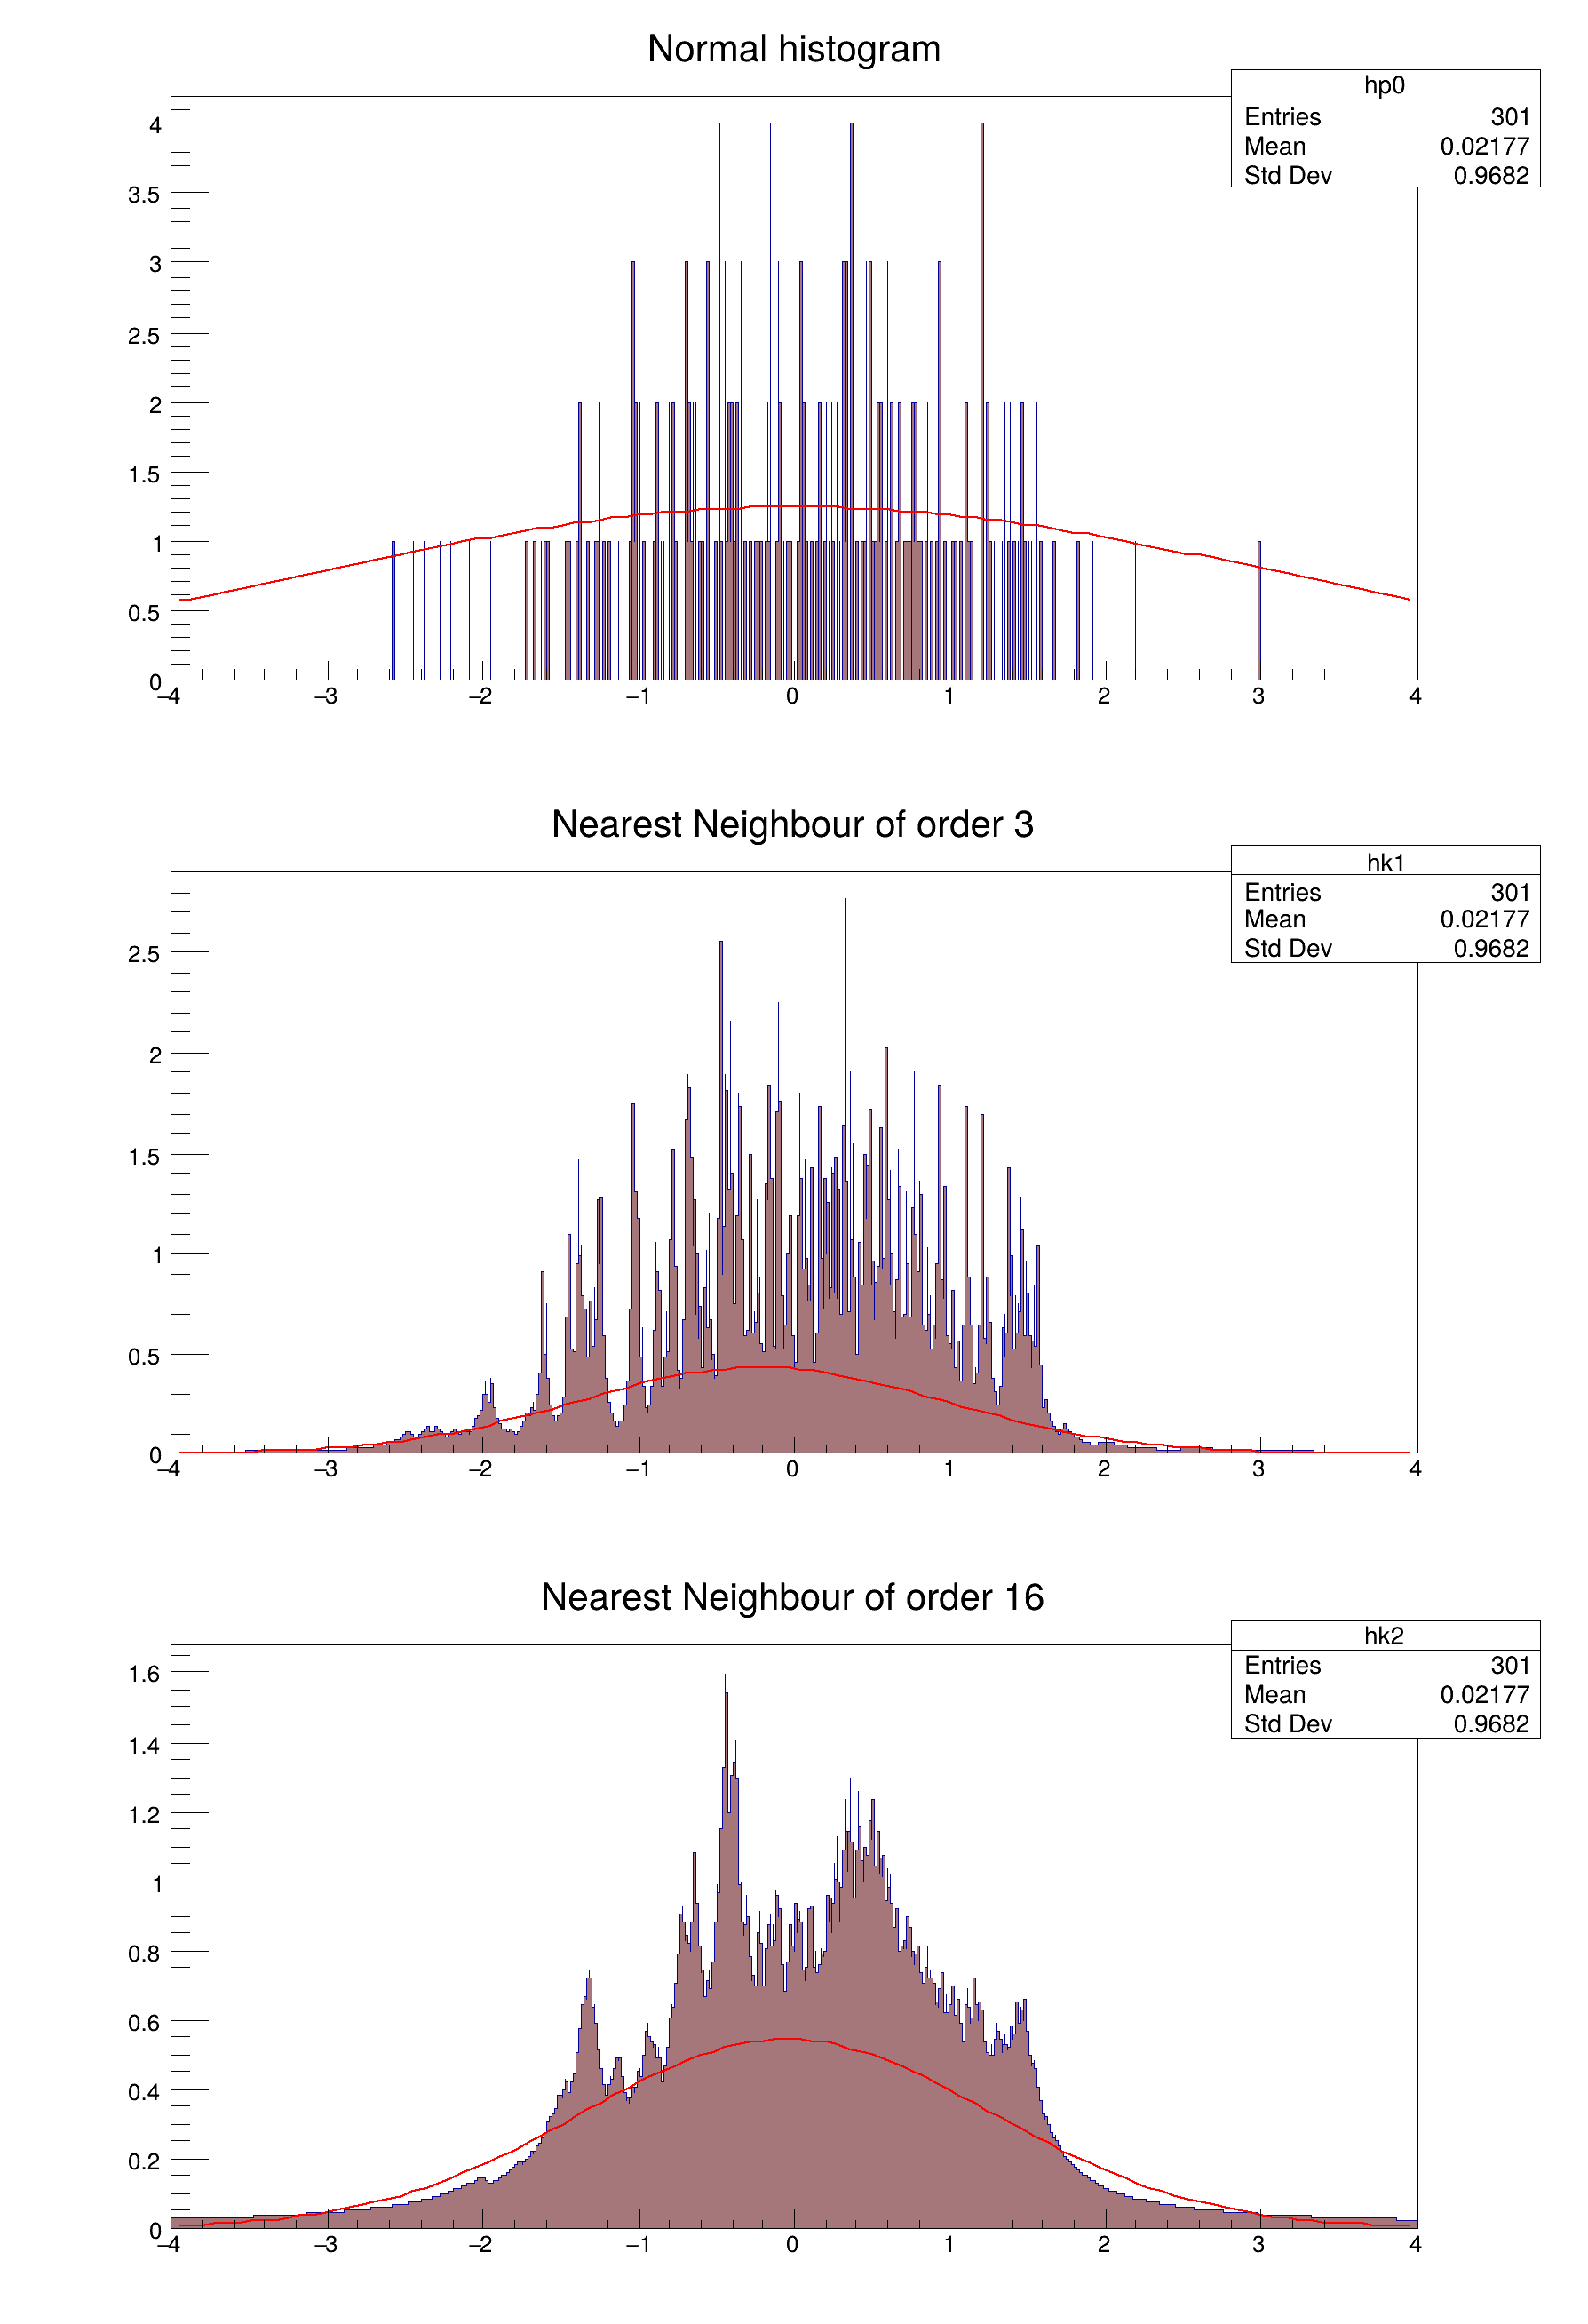 Illustrates the advantages of a TH1K histogram. Illustrates the advantages of a TH1K histogram. | |
| hist013_TH1_rebin.C | |
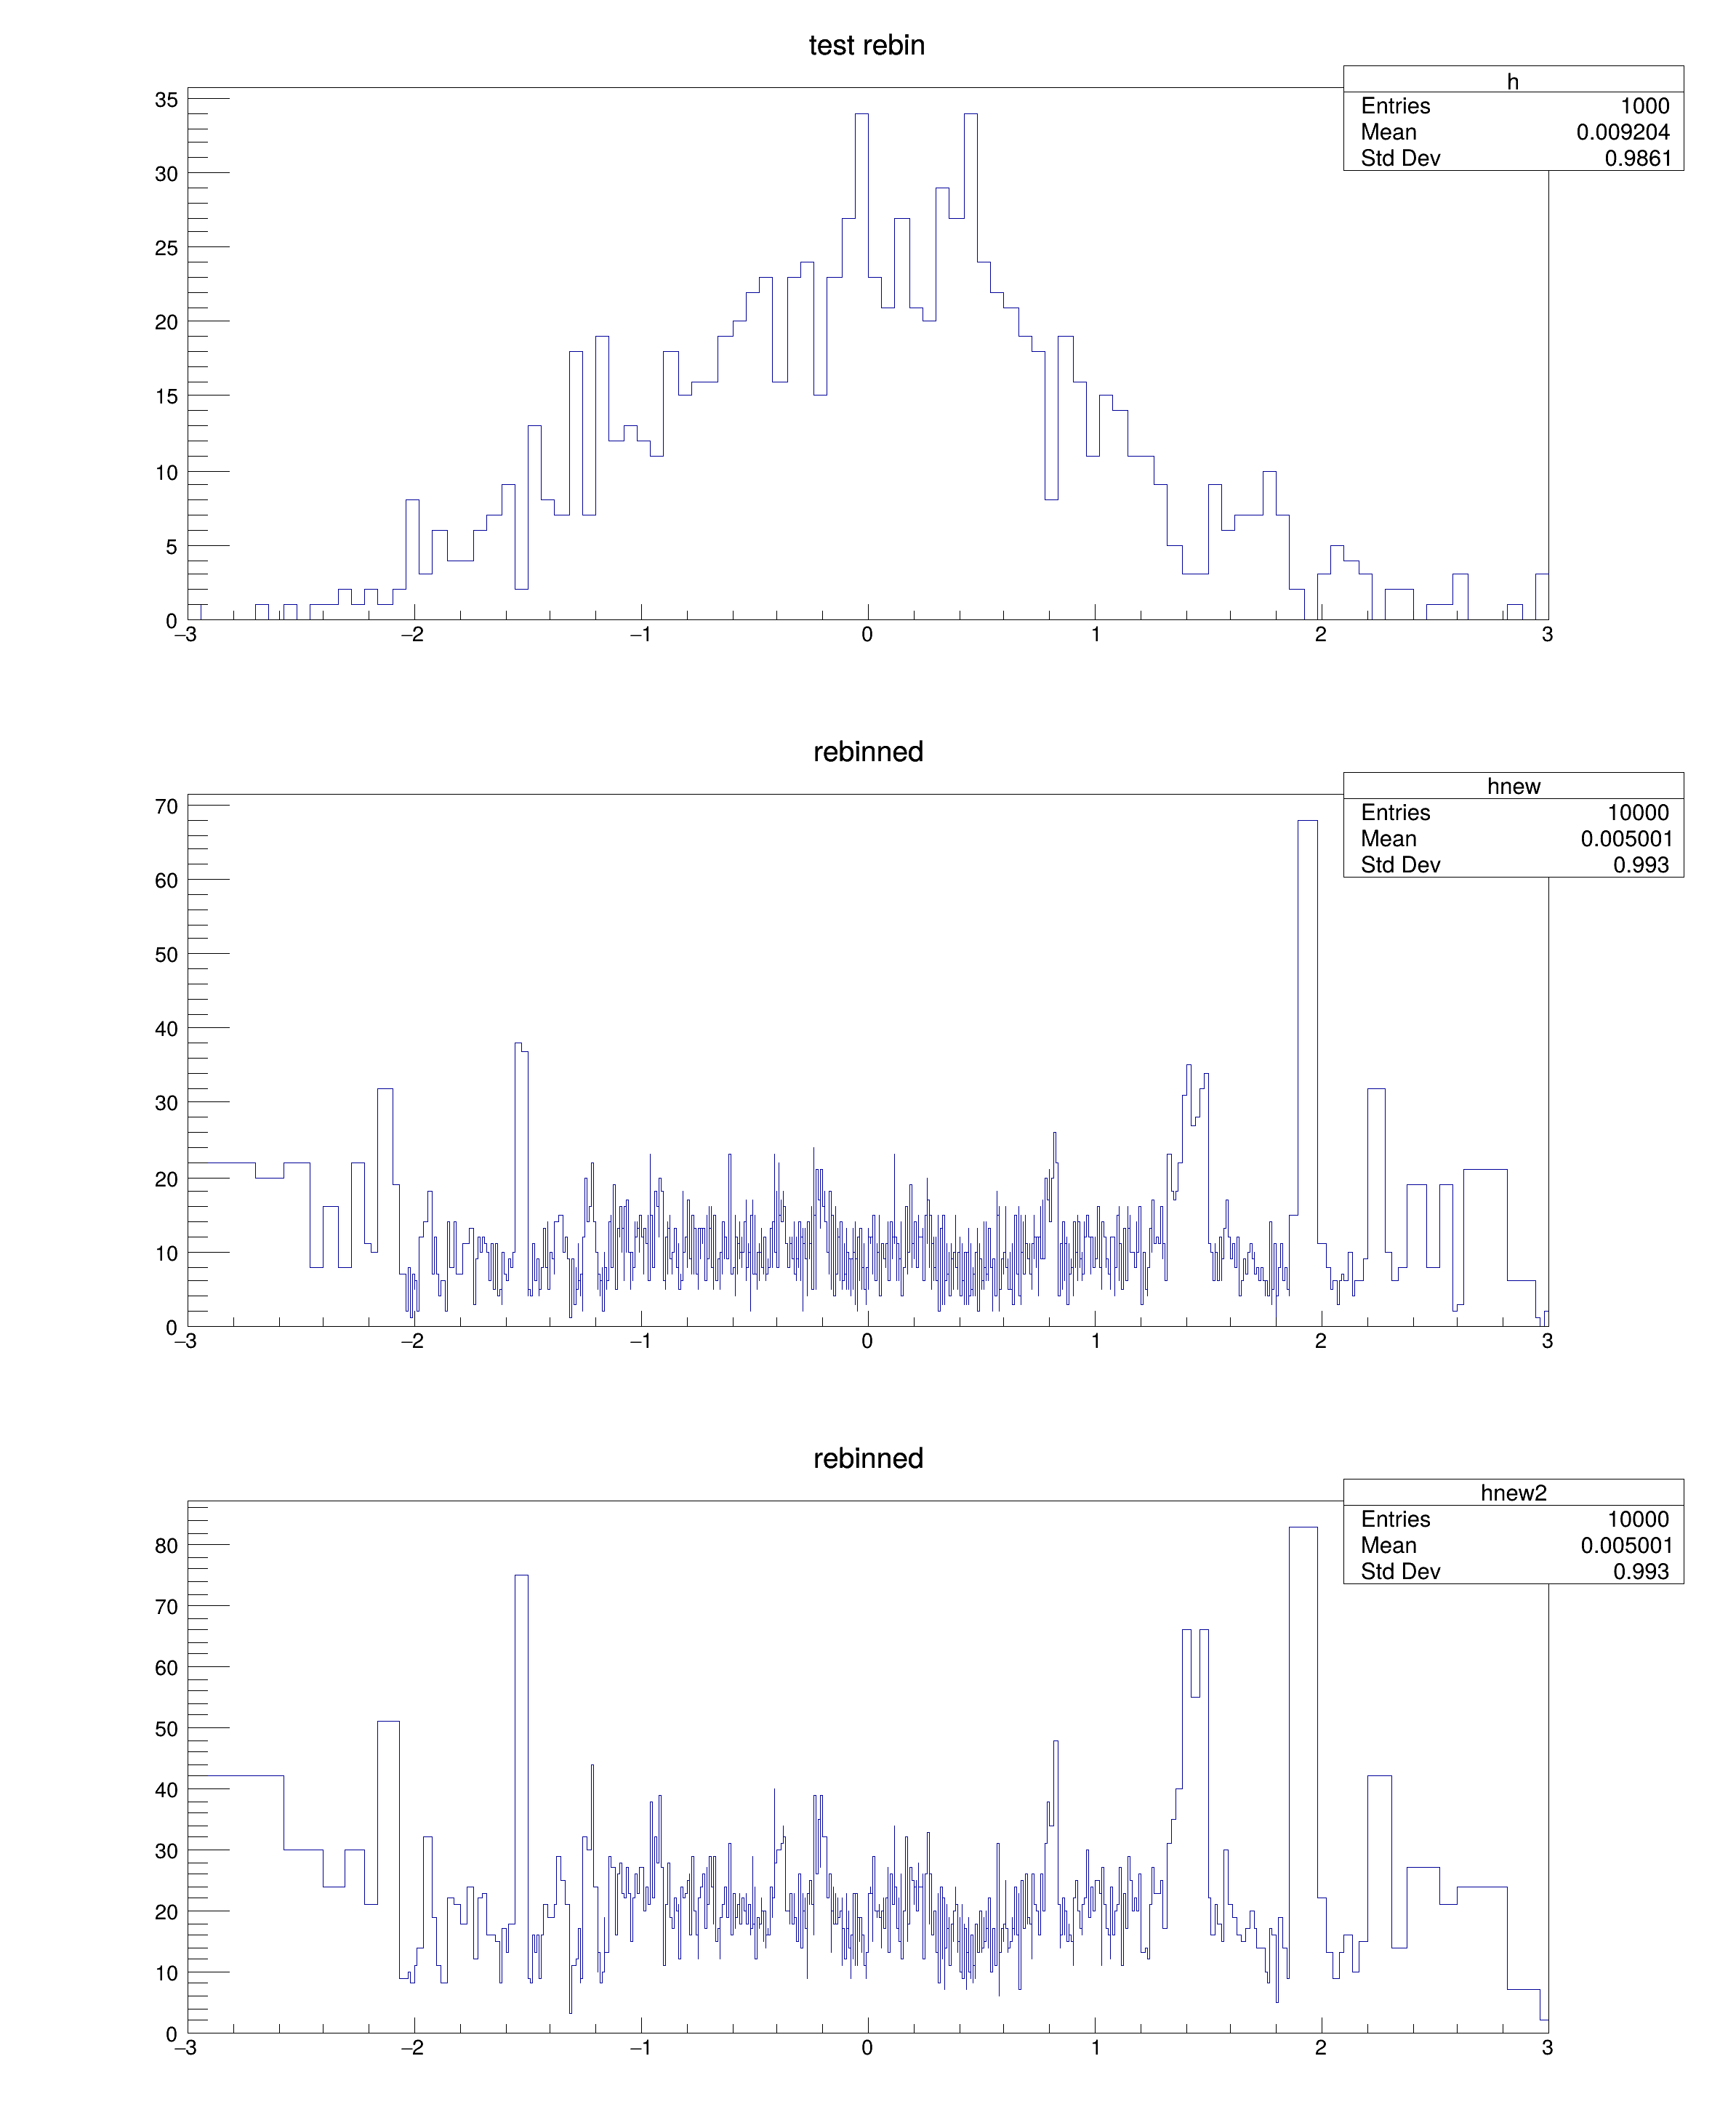 Rebin a variable bin-width histogram. Rebin a variable bin-width histogram. | |
| hist014_TH1_cumulative.C | |
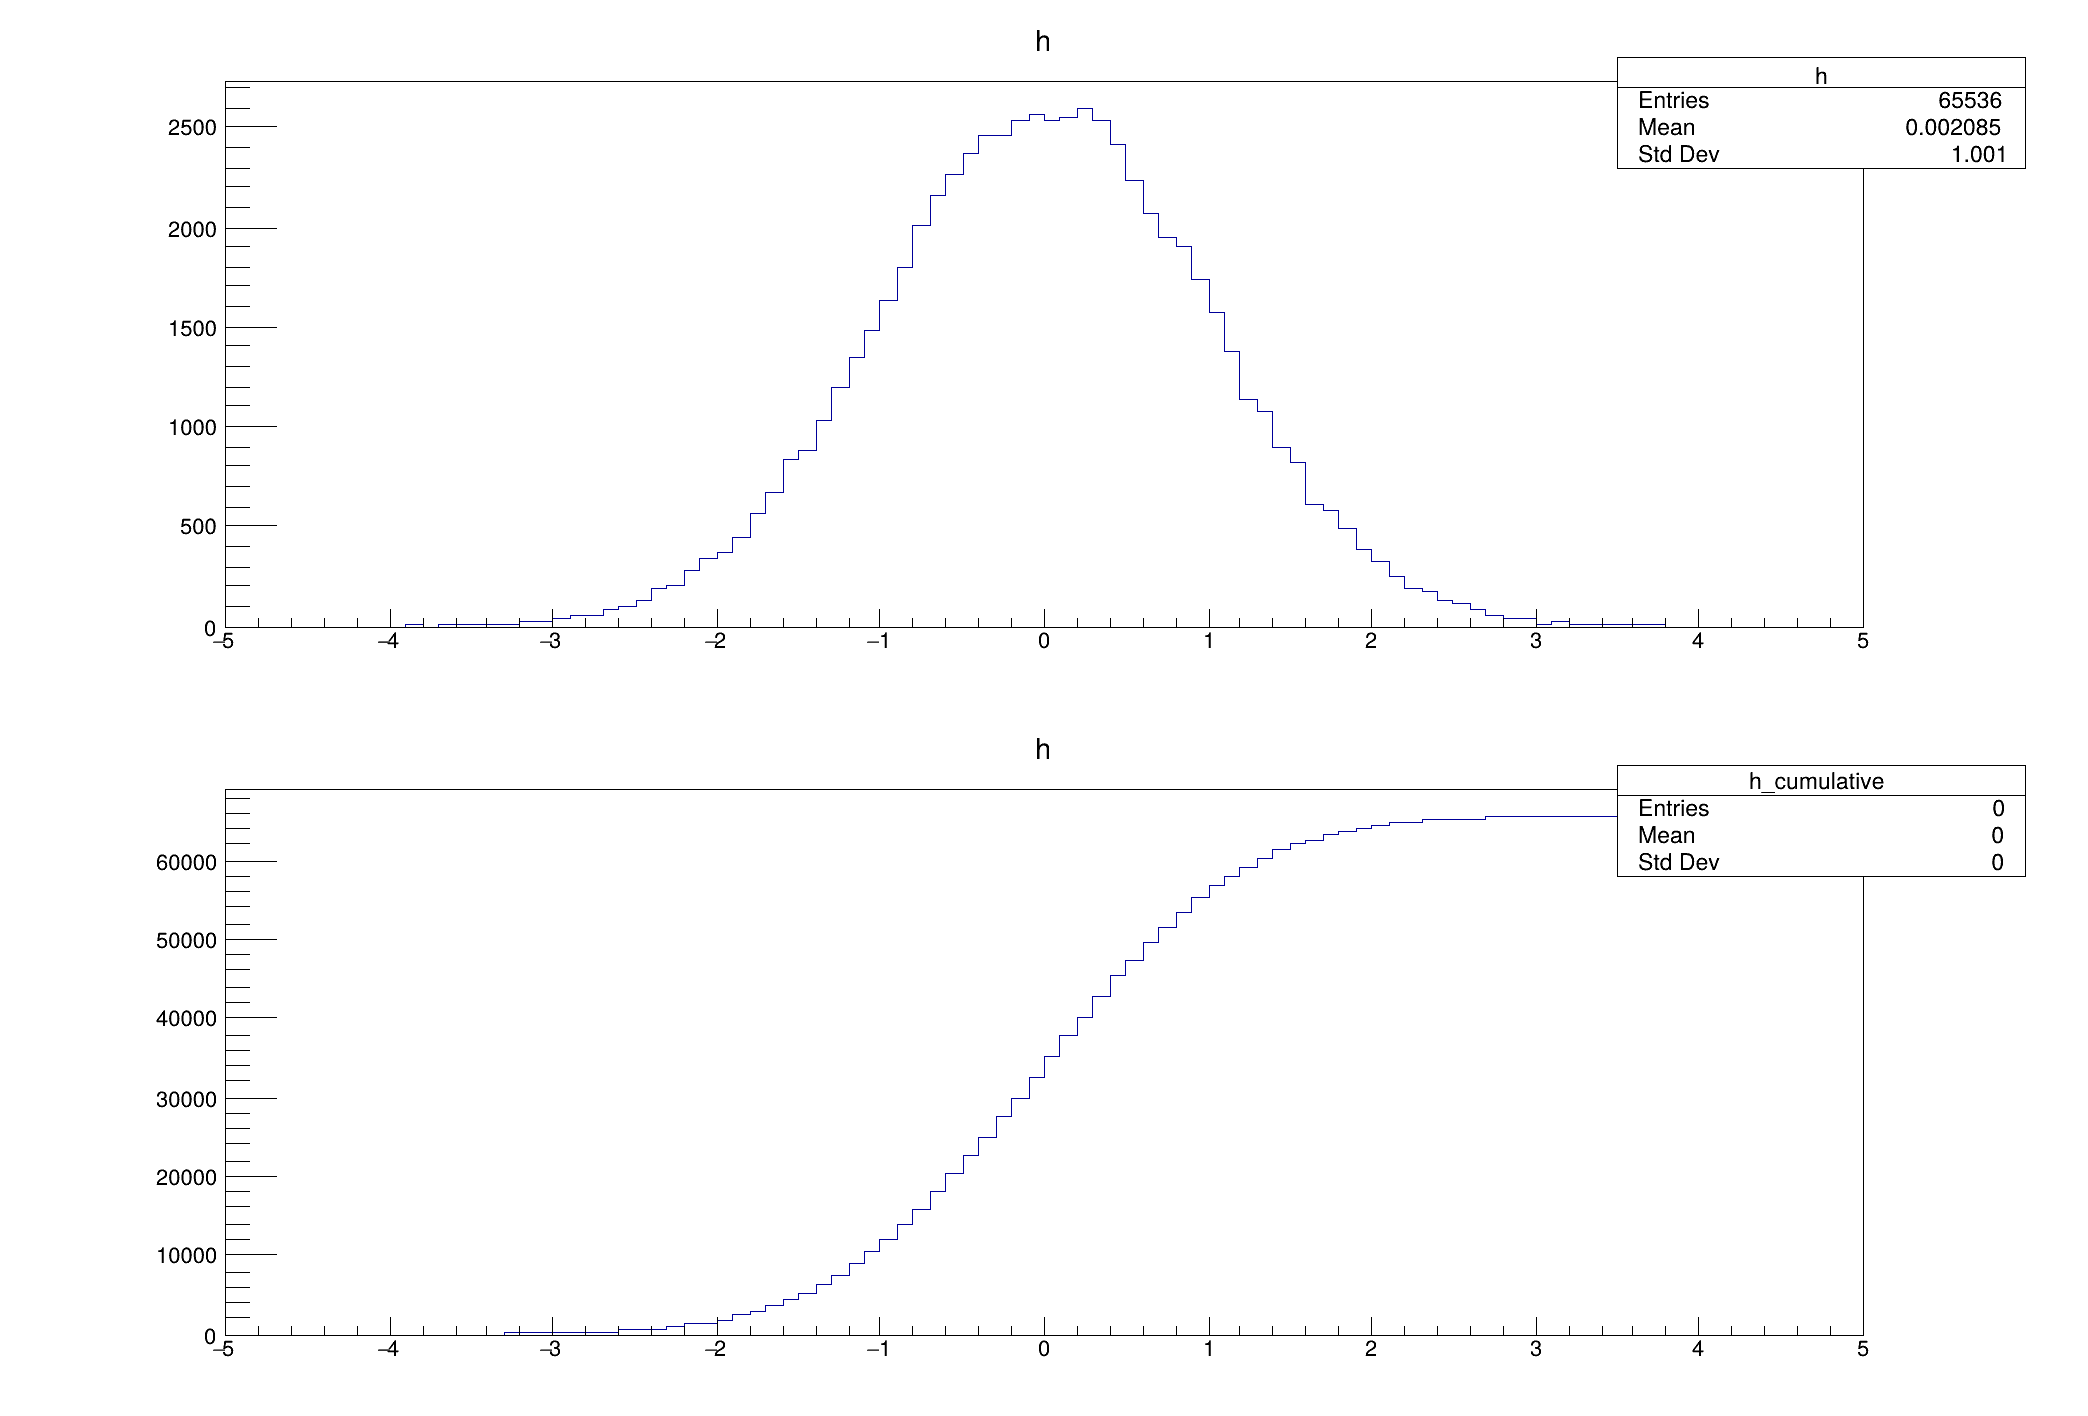 Illustrate use of the TH1::GetCumulative method. Illustrate use of the TH1::GetCumulative method. | |
| hist015_TH1_read_and_draw.C | |
 Read a 1-D histogram from a ROOT File and draw it. Read a 1-D histogram from a ROOT File and draw it. | |
| hist015_TH1_read_and_draw.py | |
| A Simple histogram drawing example. | |
| hist016_TH1_different_scales_canvas.C | |
 Example of a canvas showing two histograms with different scales. Example of a canvas showing two histograms with different scales. | |
| hist017_TH1_smooth.C | |
 Histogram smoothing. Histogram smoothing. | |
| hist018_TH2_cutg.C | |
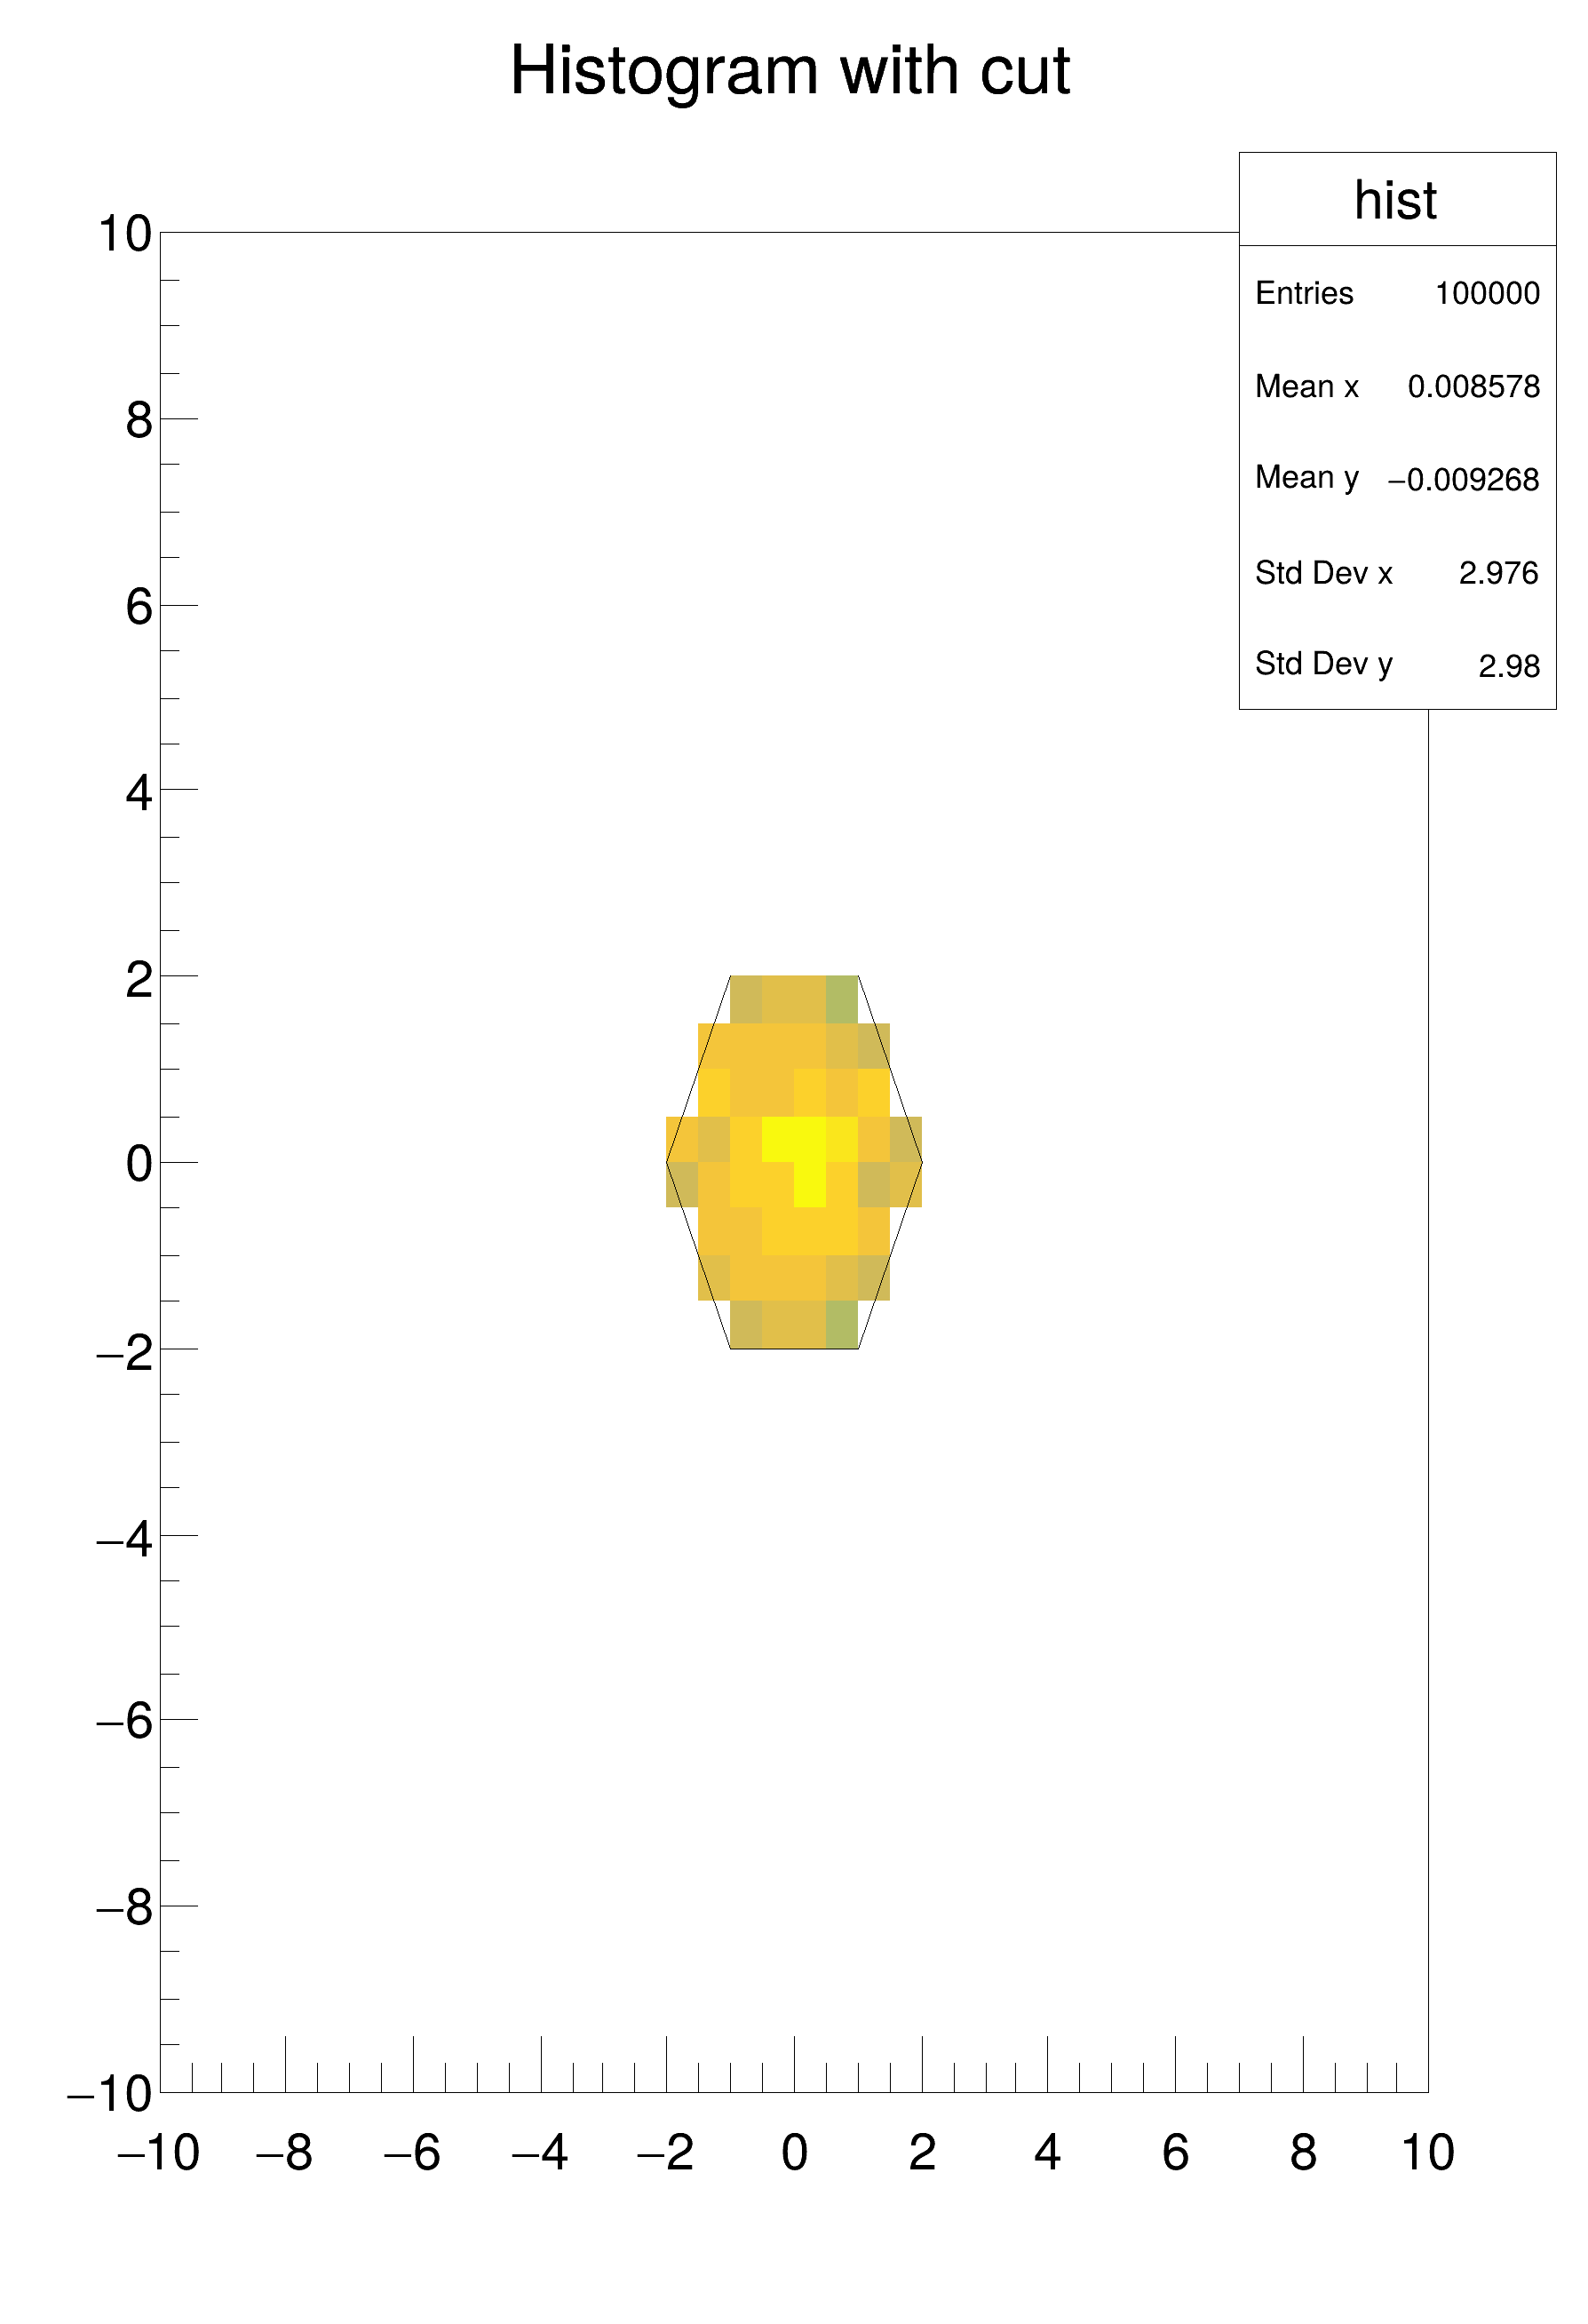 This example demonstrates how to display a 2D histogram and use TCutG object to select bins for drawing. This example demonstrates how to display a 2D histogram and use TCutG object to select bins for drawing. | |
| hist019_TH2_projection.C | |
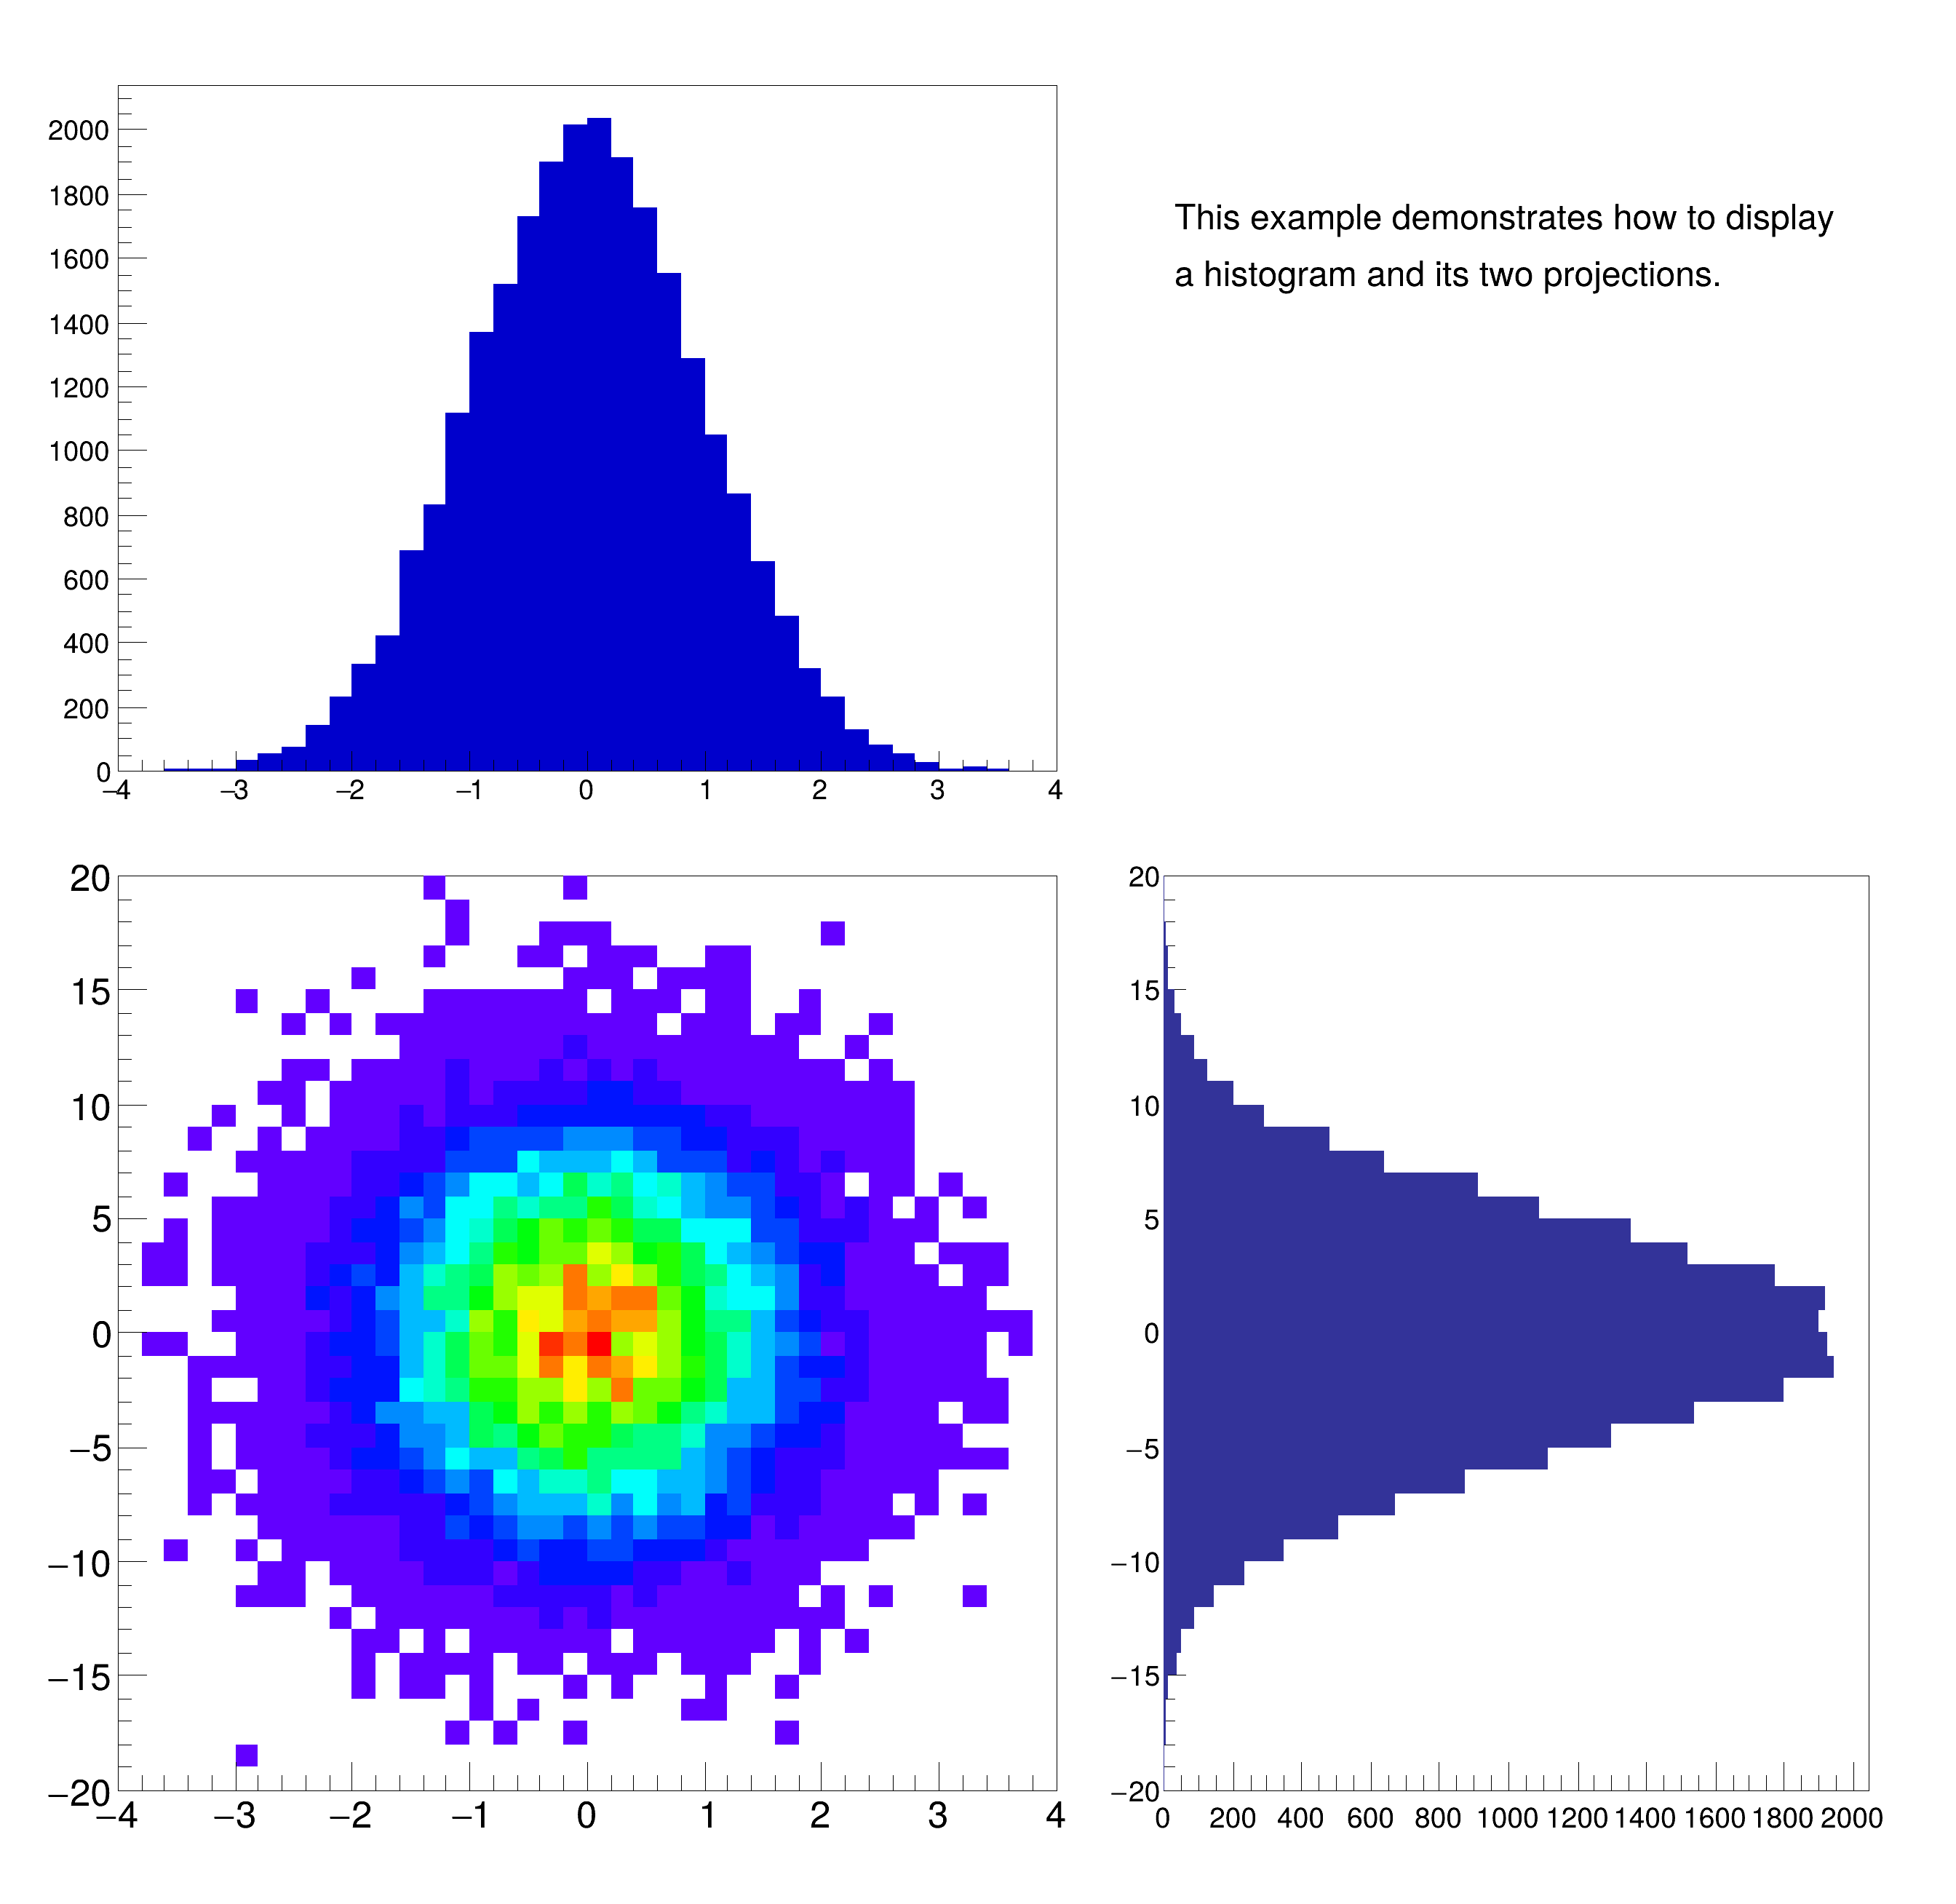 This example demonstrates how to display a histogram and its two projections. This example demonstrates how to display a histogram and its two projections. | |
| hist020_TH2_draw.C | |
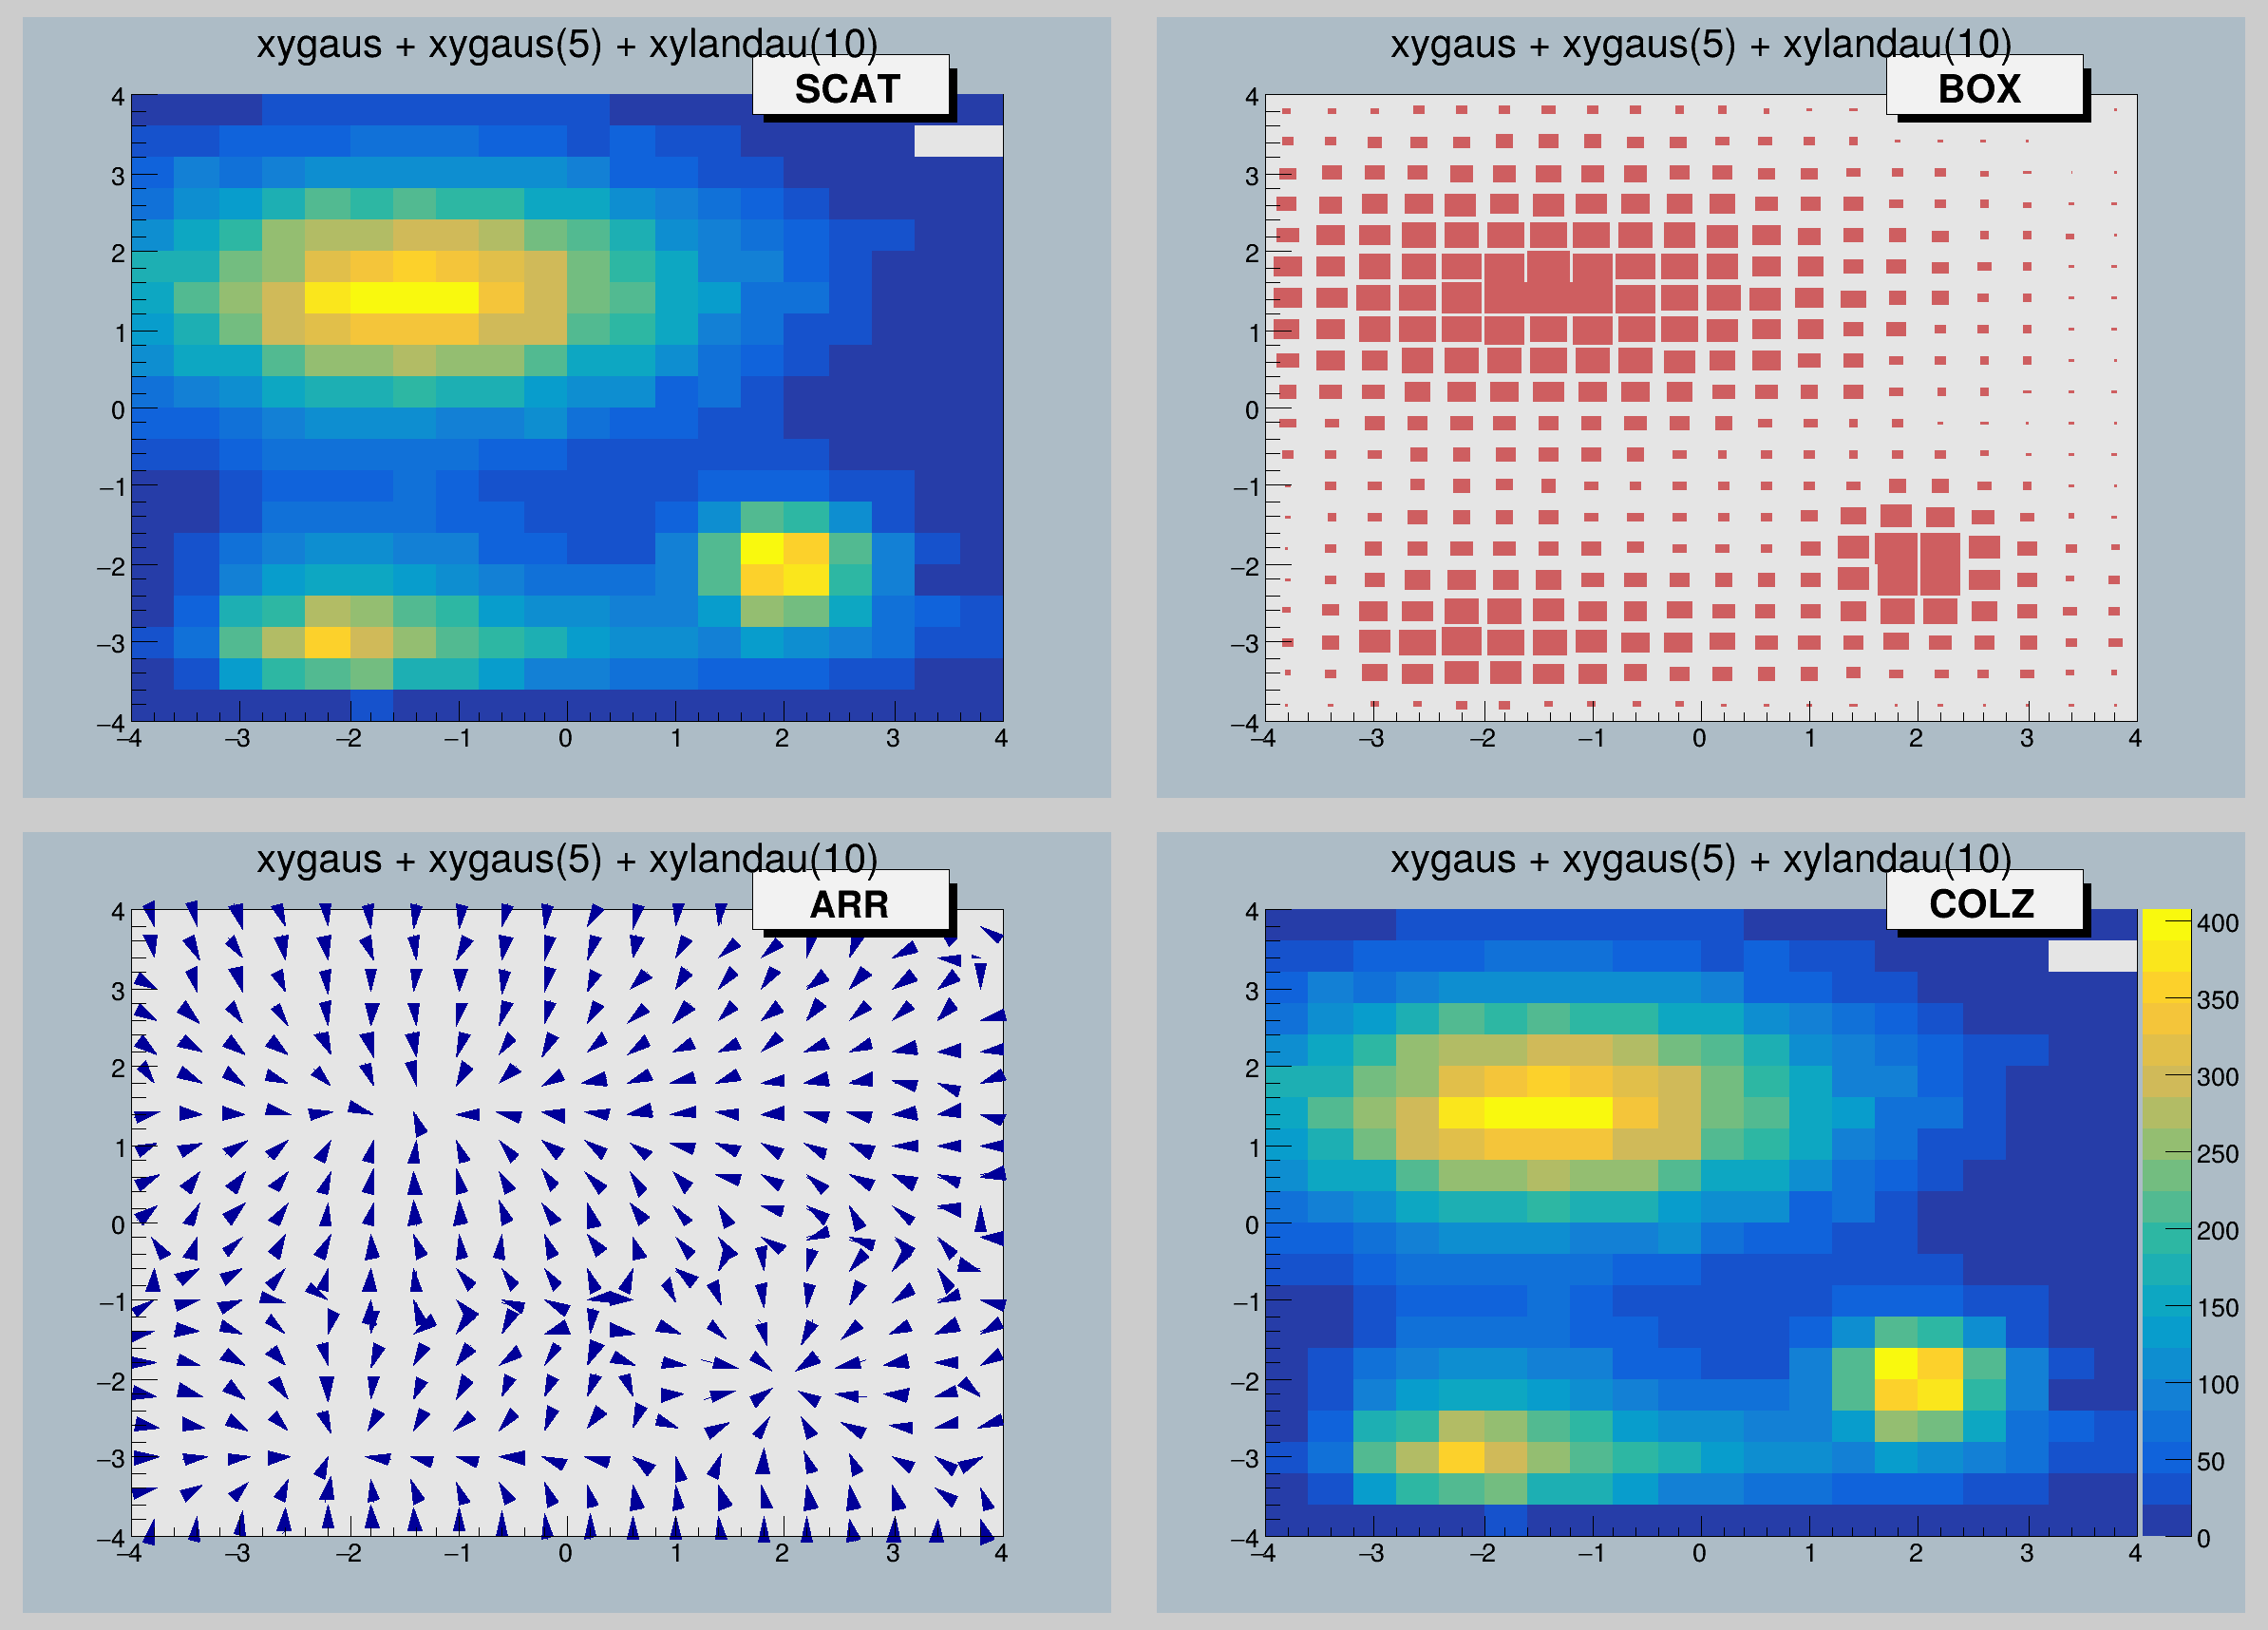 Display the various 2-d drawing options. Display the various 2-d drawing options. | |
| hist021_TH2_reverse_axis.C | |
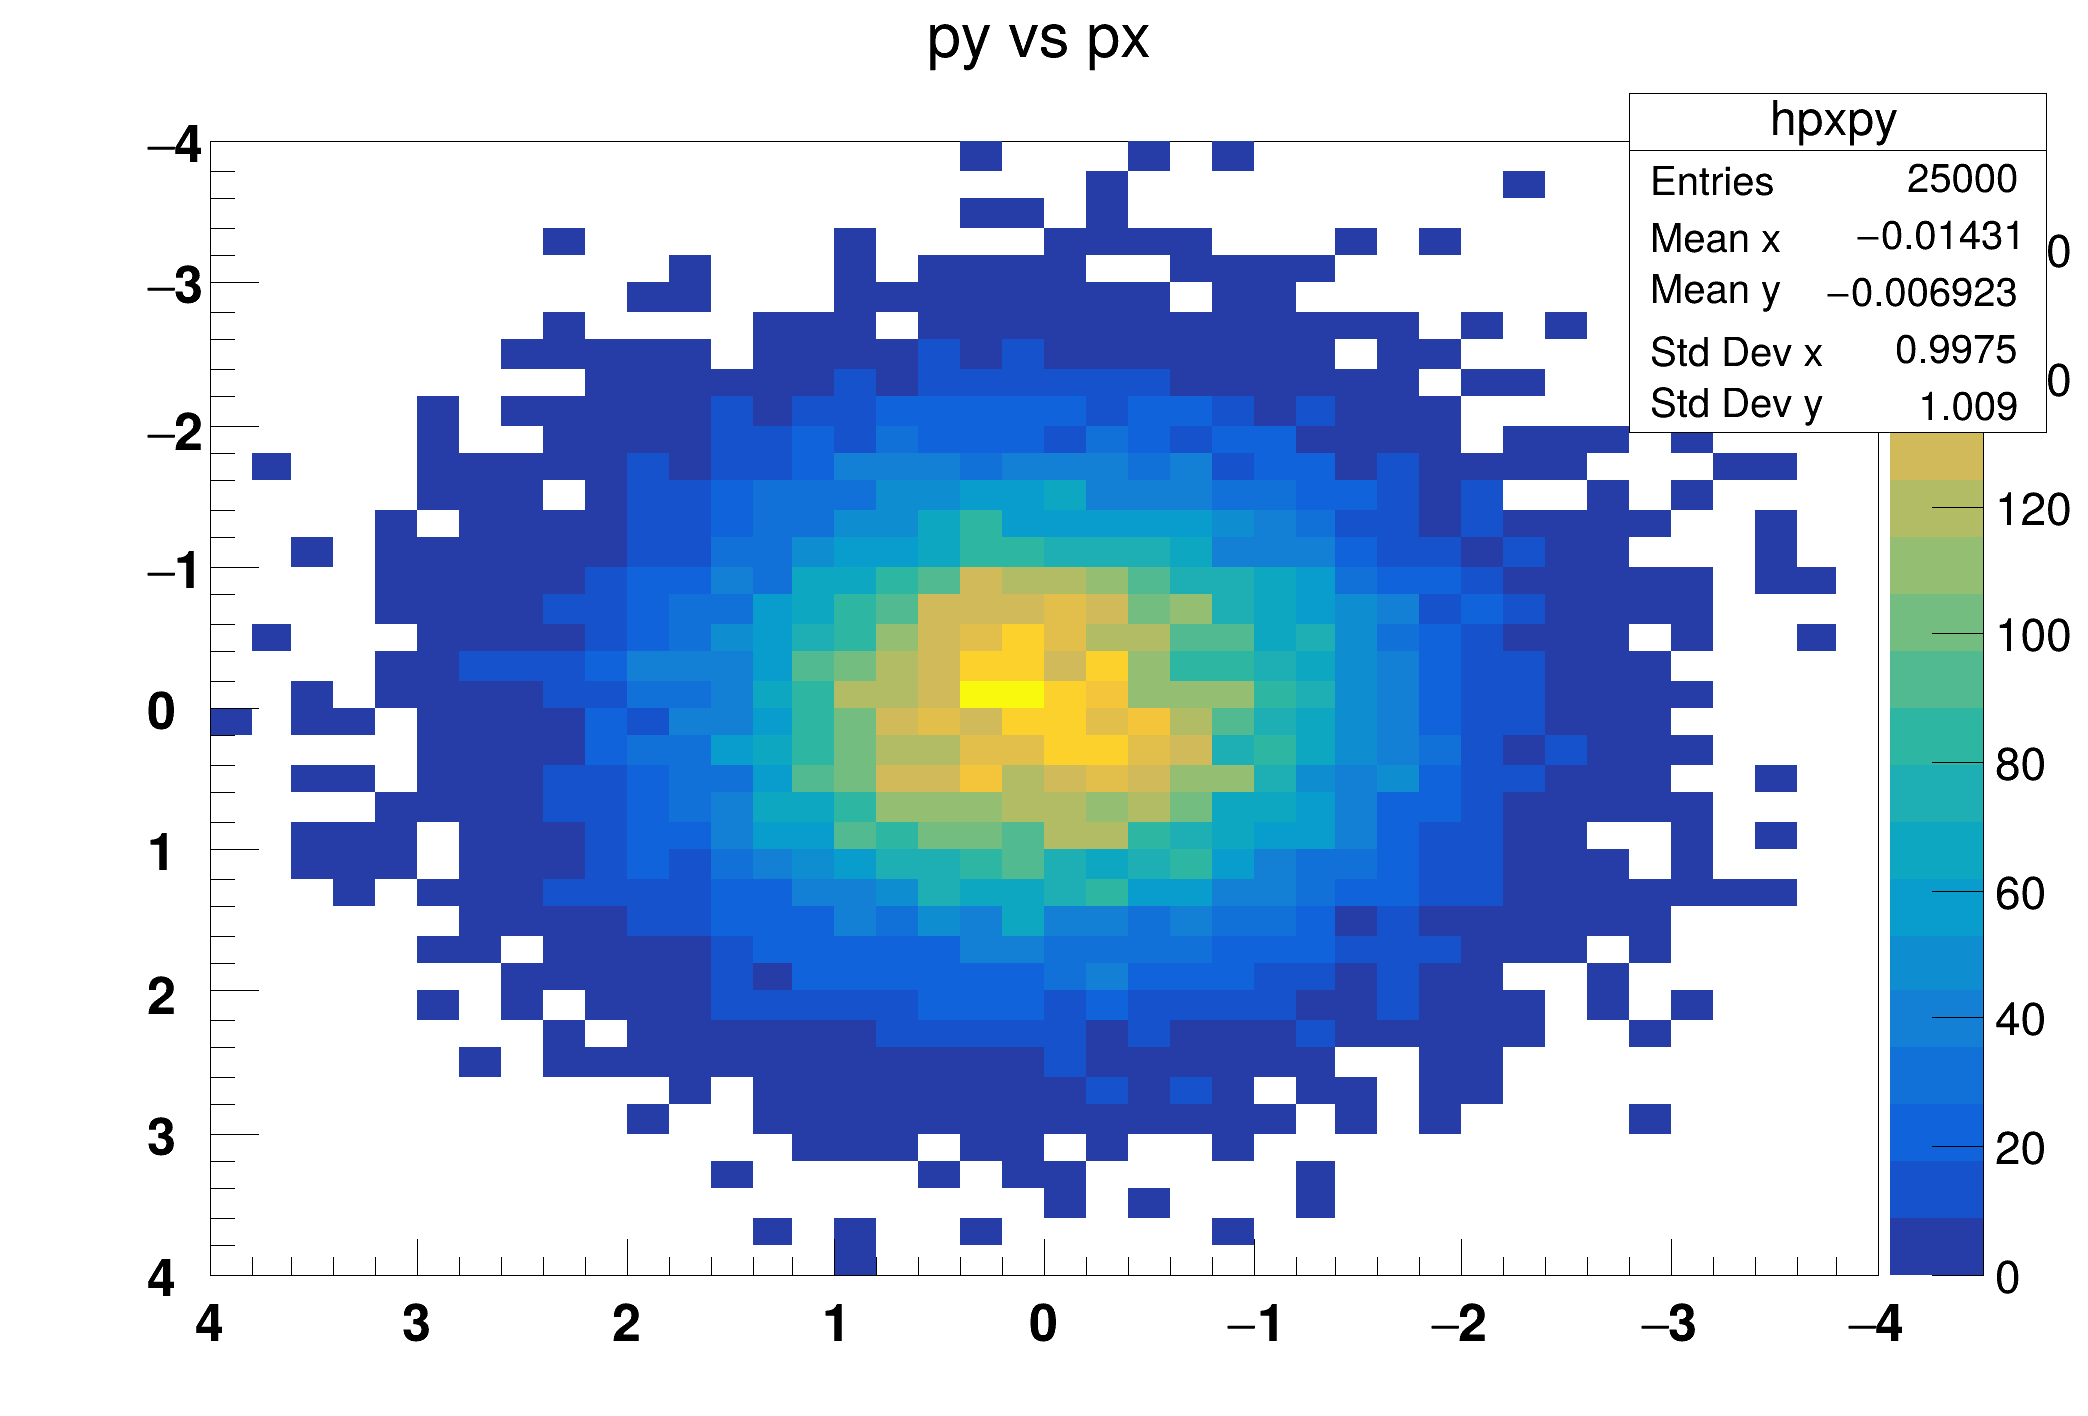 Example showing an histogram with reverse axis. Example showing an histogram with reverse axis. | |
| hist022_TH2_palette.C | |
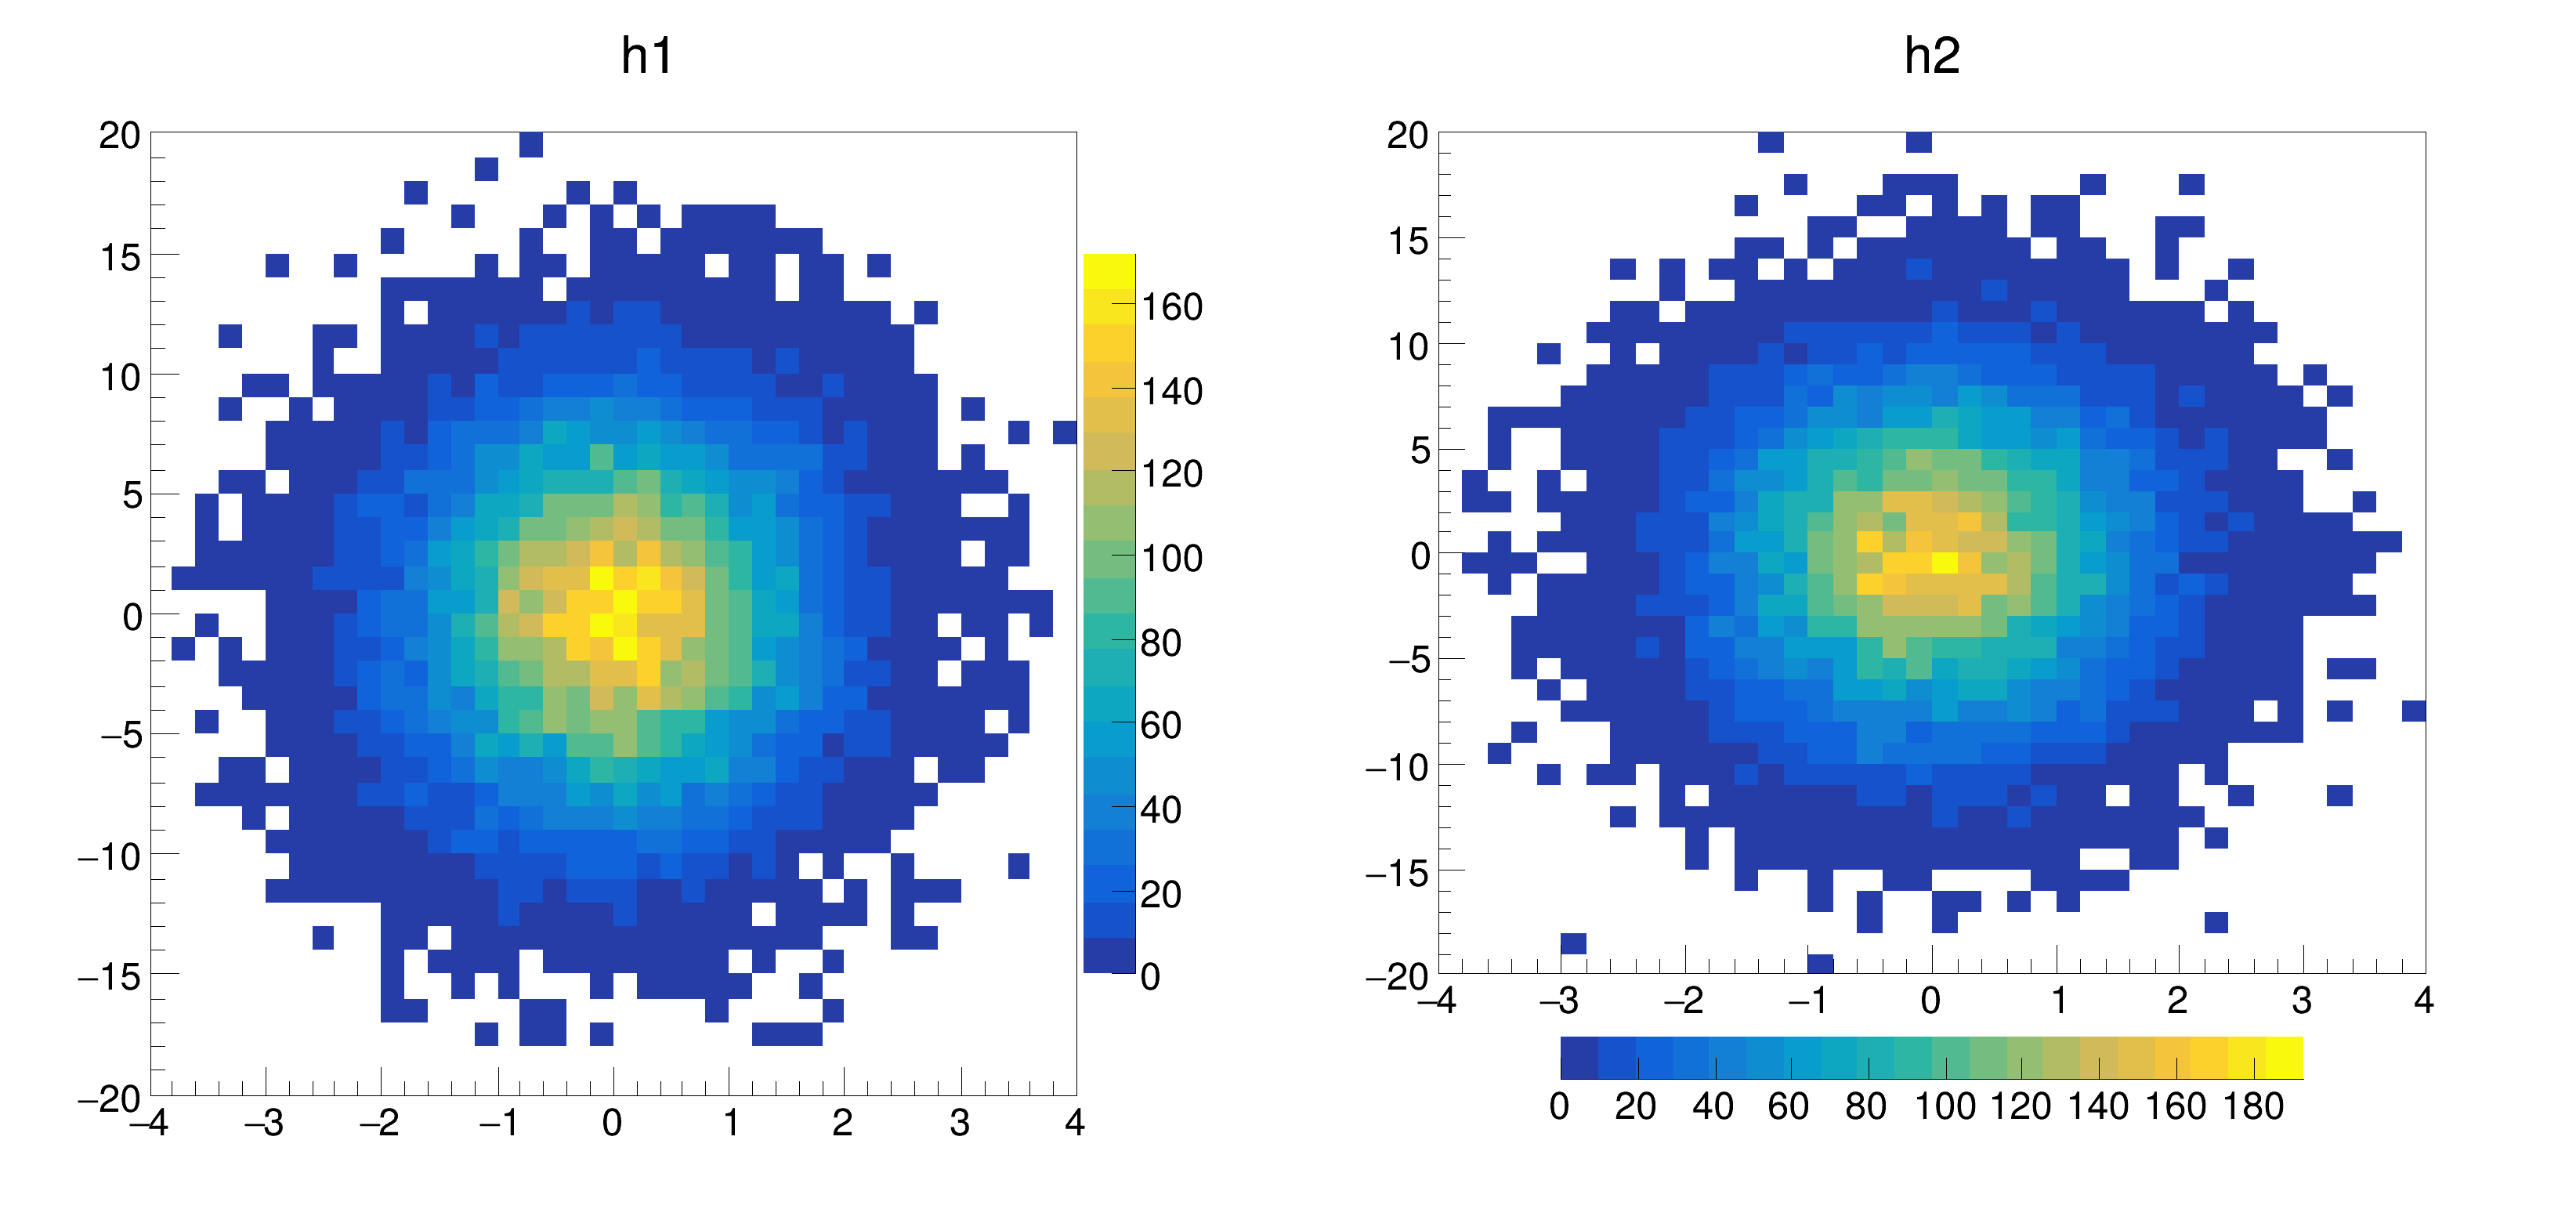 When an histogram is drawn with the option COLZ, a palette is automatically drawn vertically on the right side of the plot. When an histogram is drawn with the option COLZ, a palette is automatically drawn vertically on the right side of the plot. | |
| hist023_THStack_simple.C | |
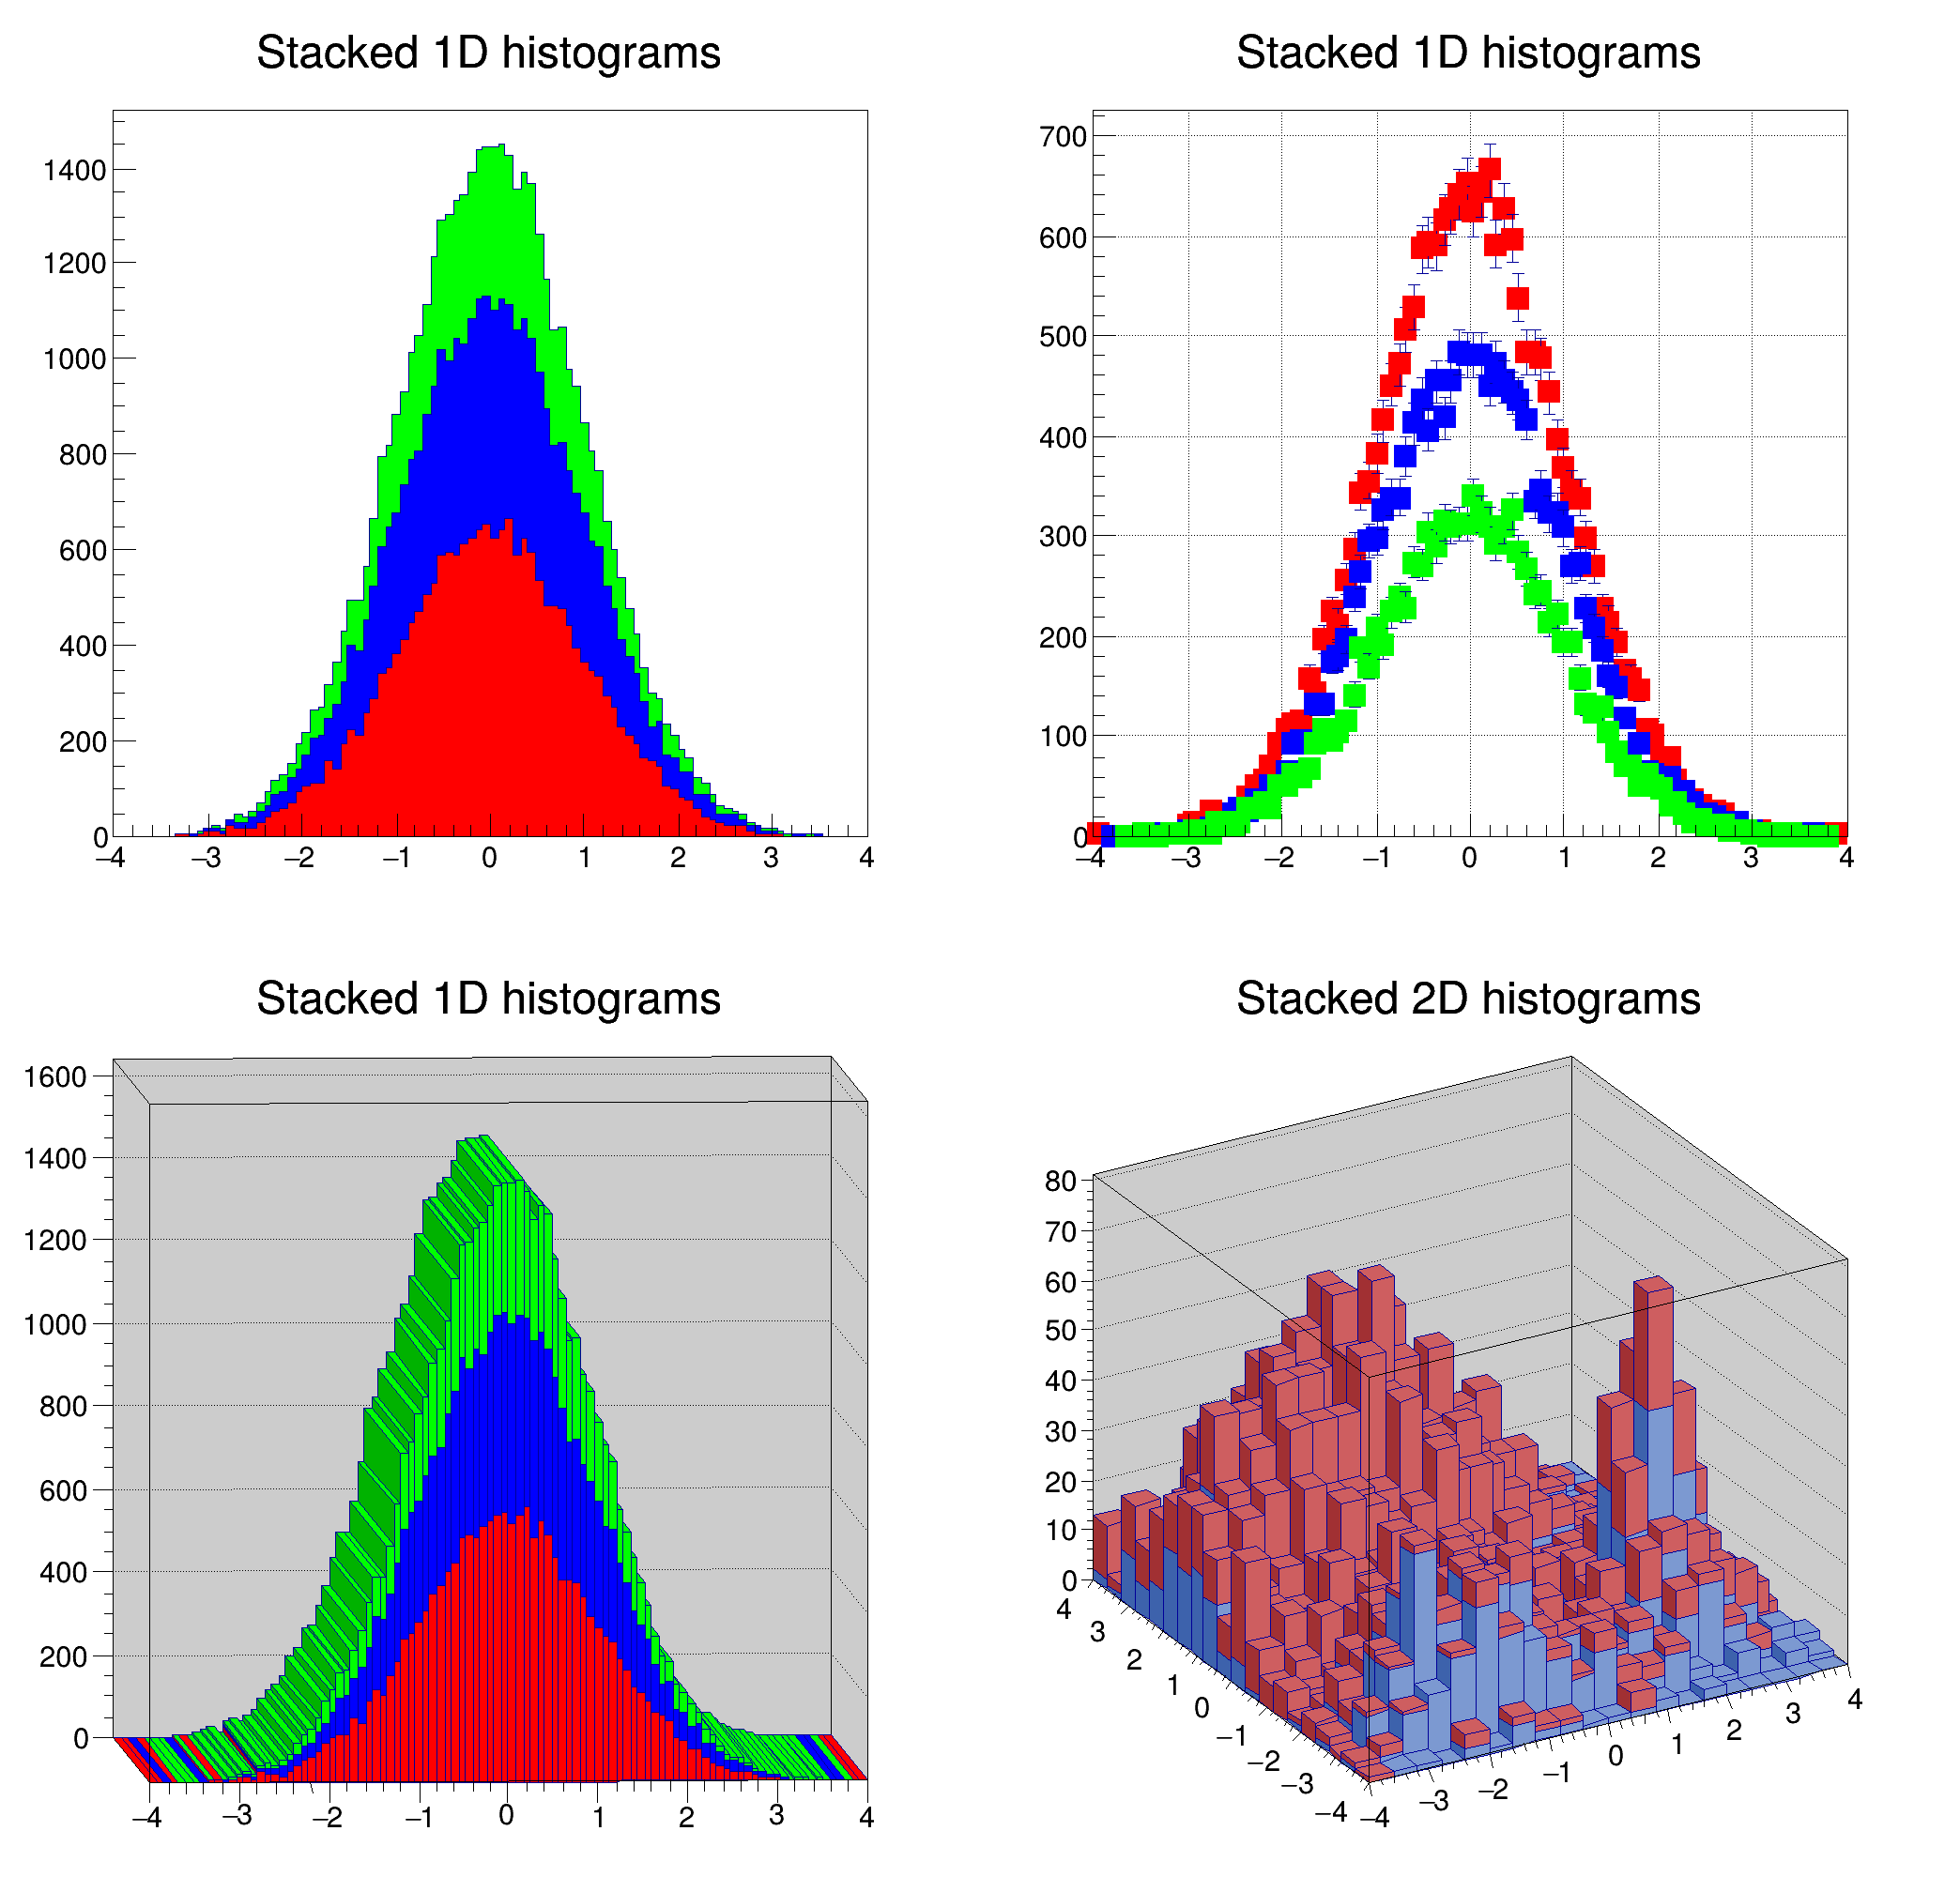 Example of stacked histograms: class THStack. Example of stacked histograms: class THStack. | |
| hist024_THStack_pads.C | |
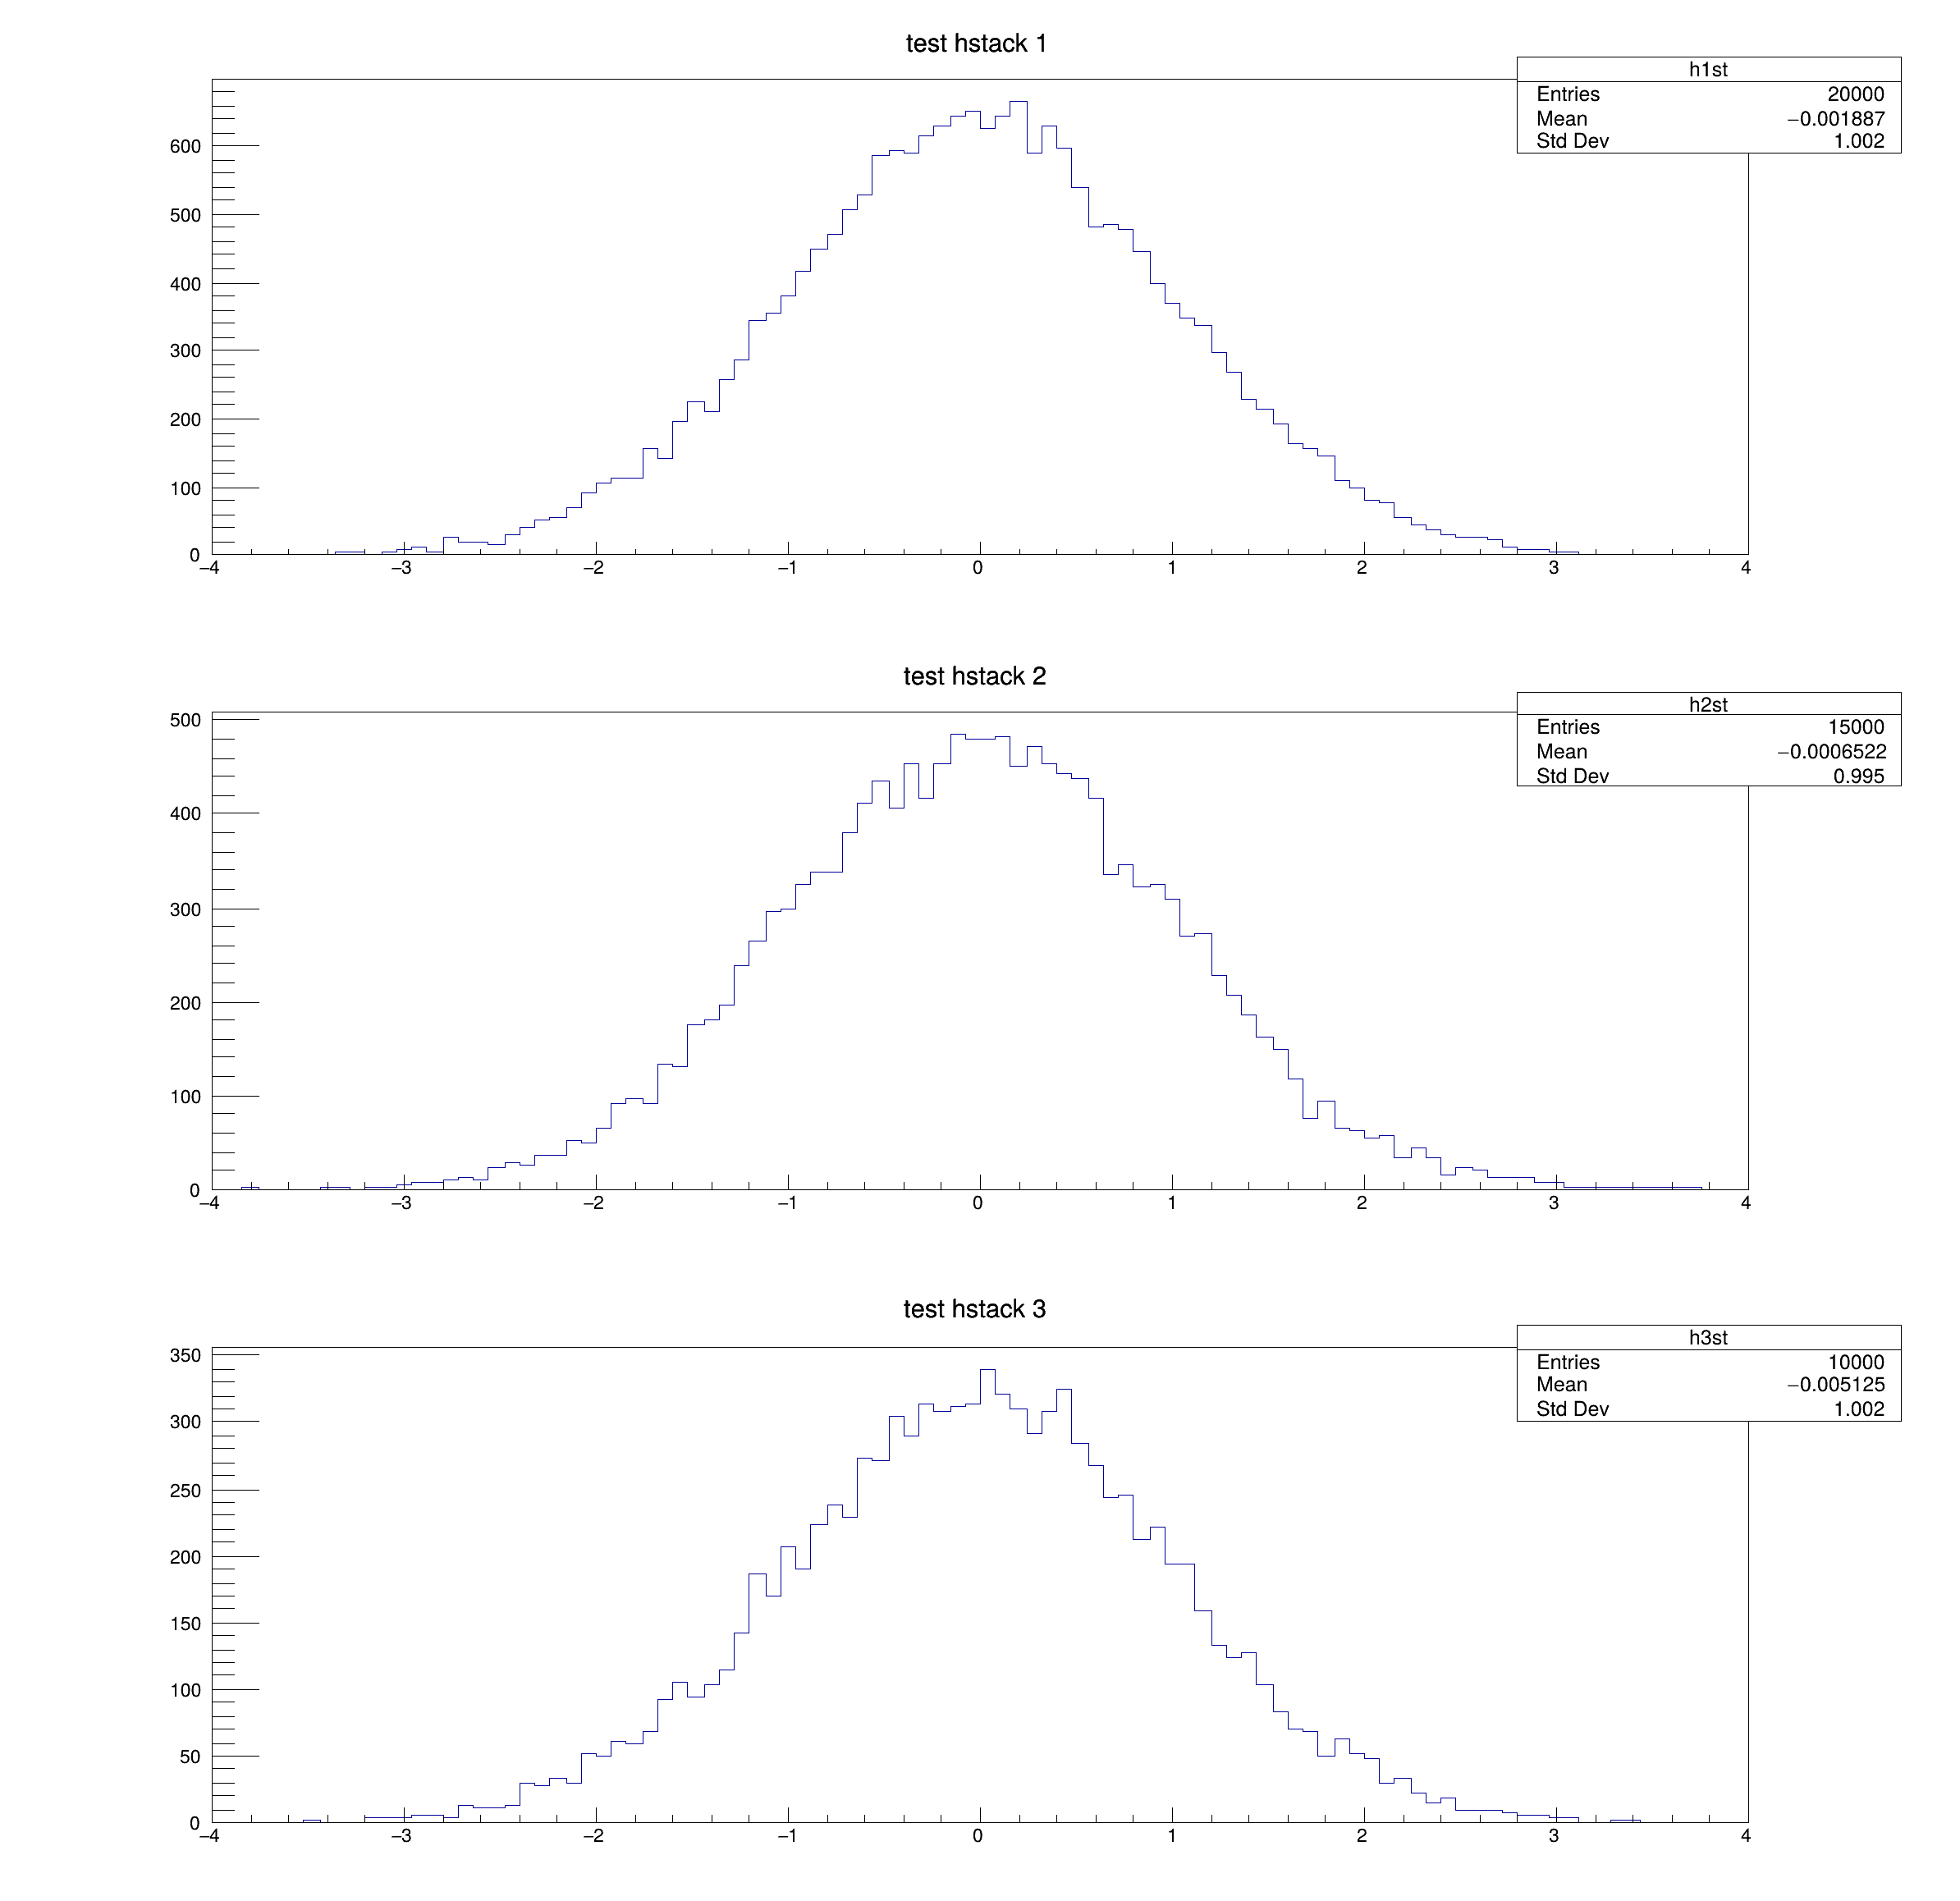 Drawing stack histograms on subpads. Drawing stack histograms on subpads. | |
| hist025_THStack_2d_palette_color.C | |
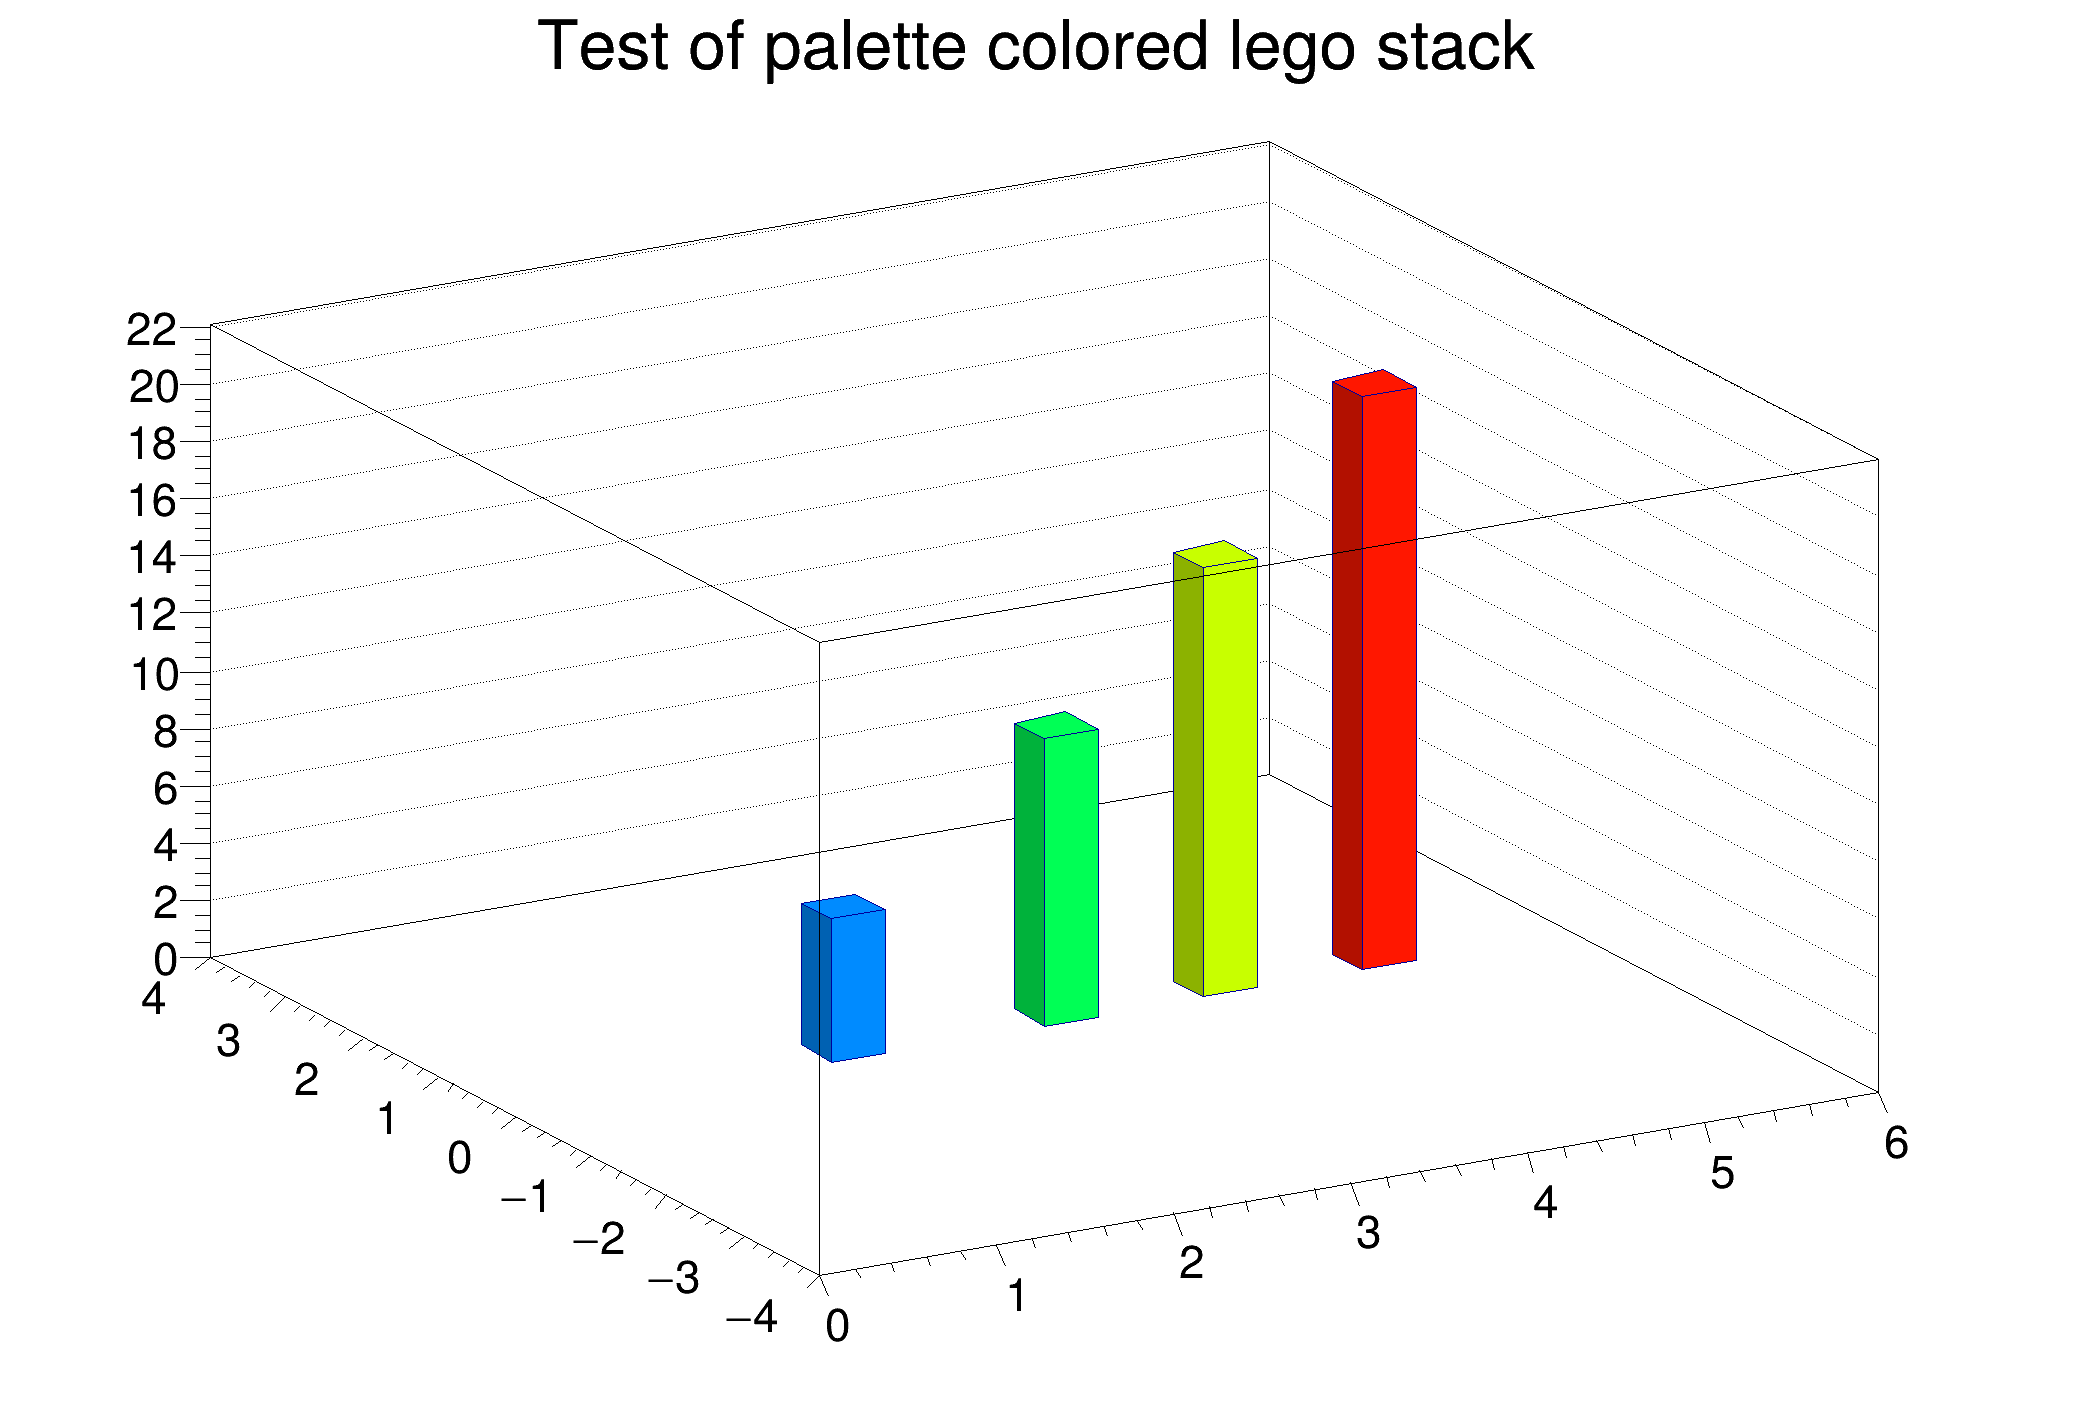 Palette coloring for 2D histograms' stack is activated thanks to the option PFC (Palette Fill Color). Palette coloring for 2D histograms' stack is activated thanks to the option PFC (Palette Fill Color). | |
| hist026_THStack_color_scheme.C | |
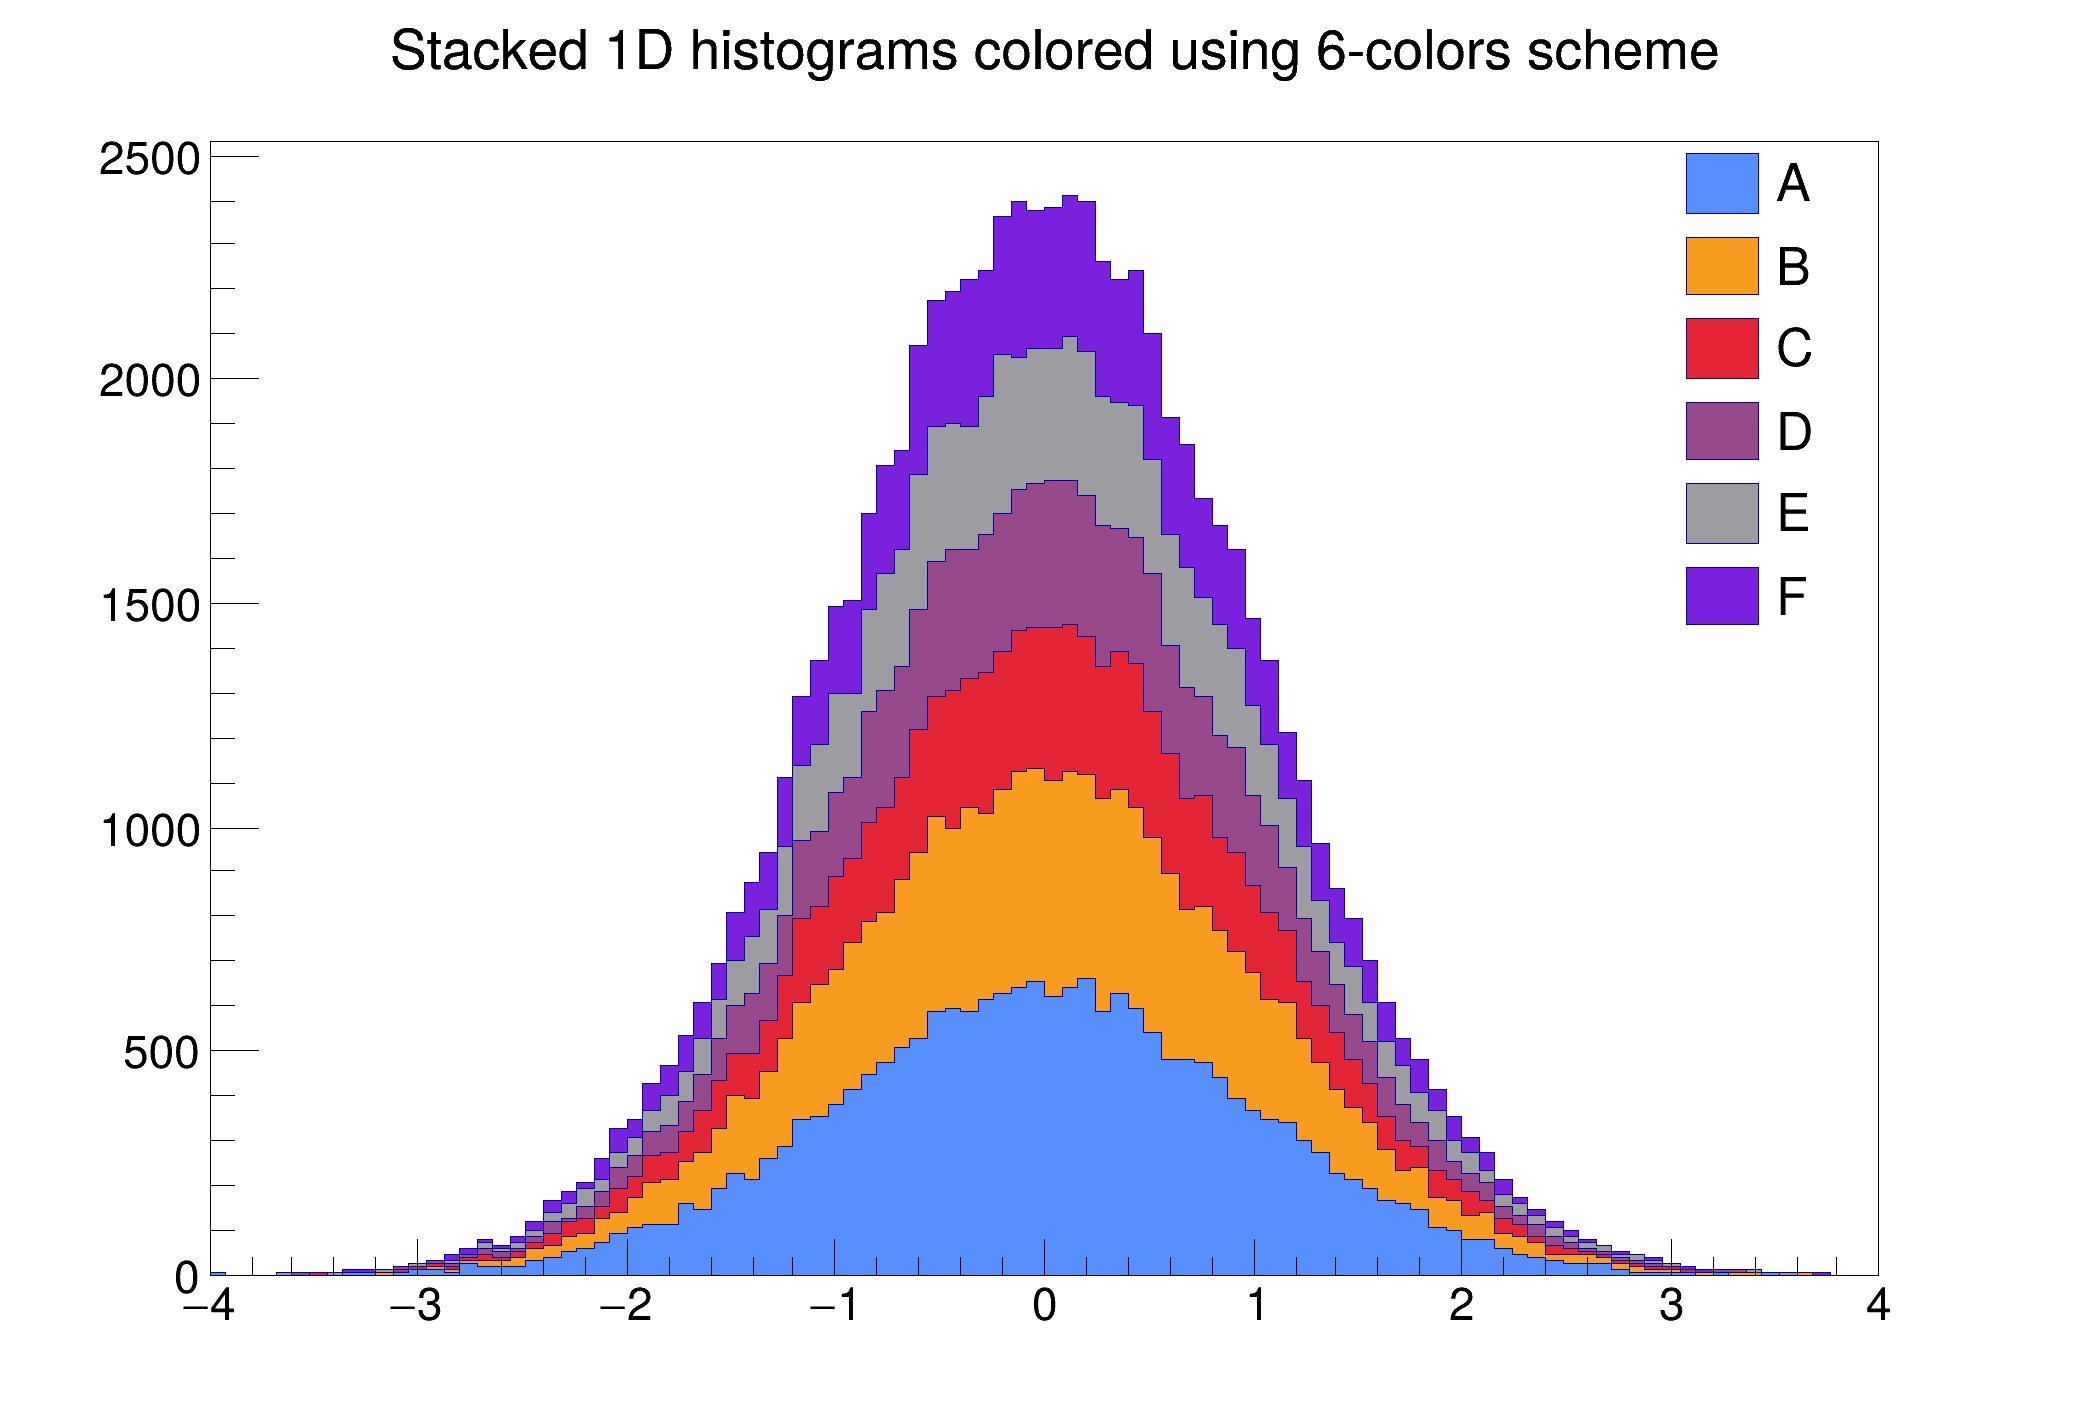 This example demonstrates how to use the accessible color schemes with THStack. This example demonstrates how to use the accessible color schemes with THStack. | |
| hist027_THStack_palette_color.C | |
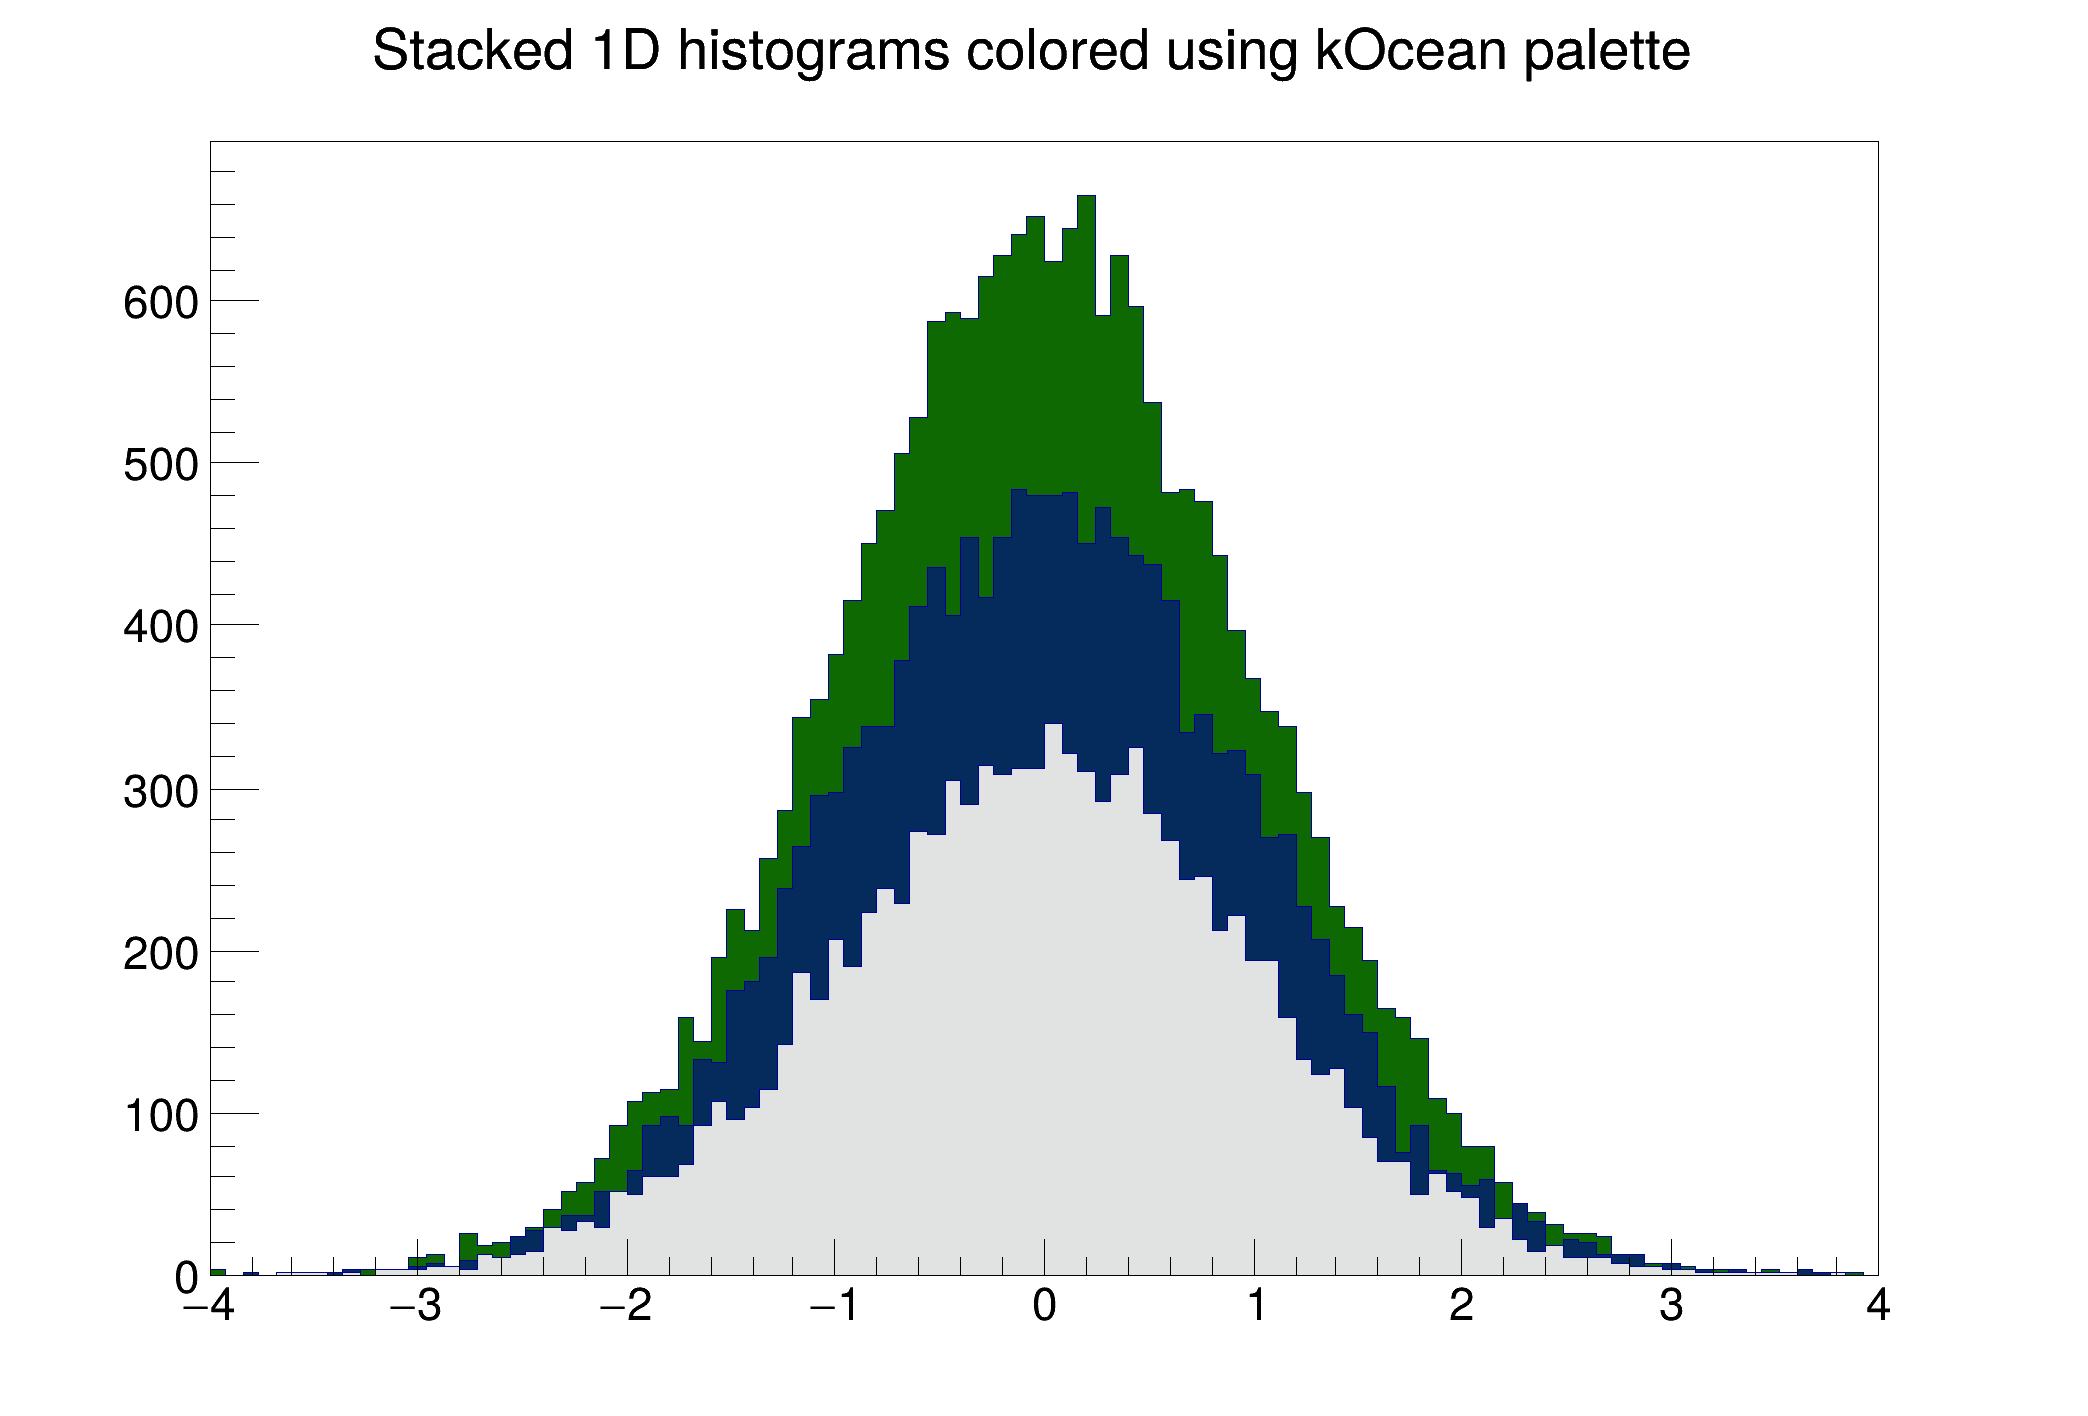 Palette coloring for histograms' stack is activated thanks to the options PFC (Palette Fill Color), PLC (Palette Line Color) and AMC (Palette Marker Color). Palette coloring for histograms' stack is activated thanks to the options PFC (Palette Fill Color), PLC (Palette Line Color) and AMC (Palette Marker Color). | |
| hist028_THStack_multicolor.C | |
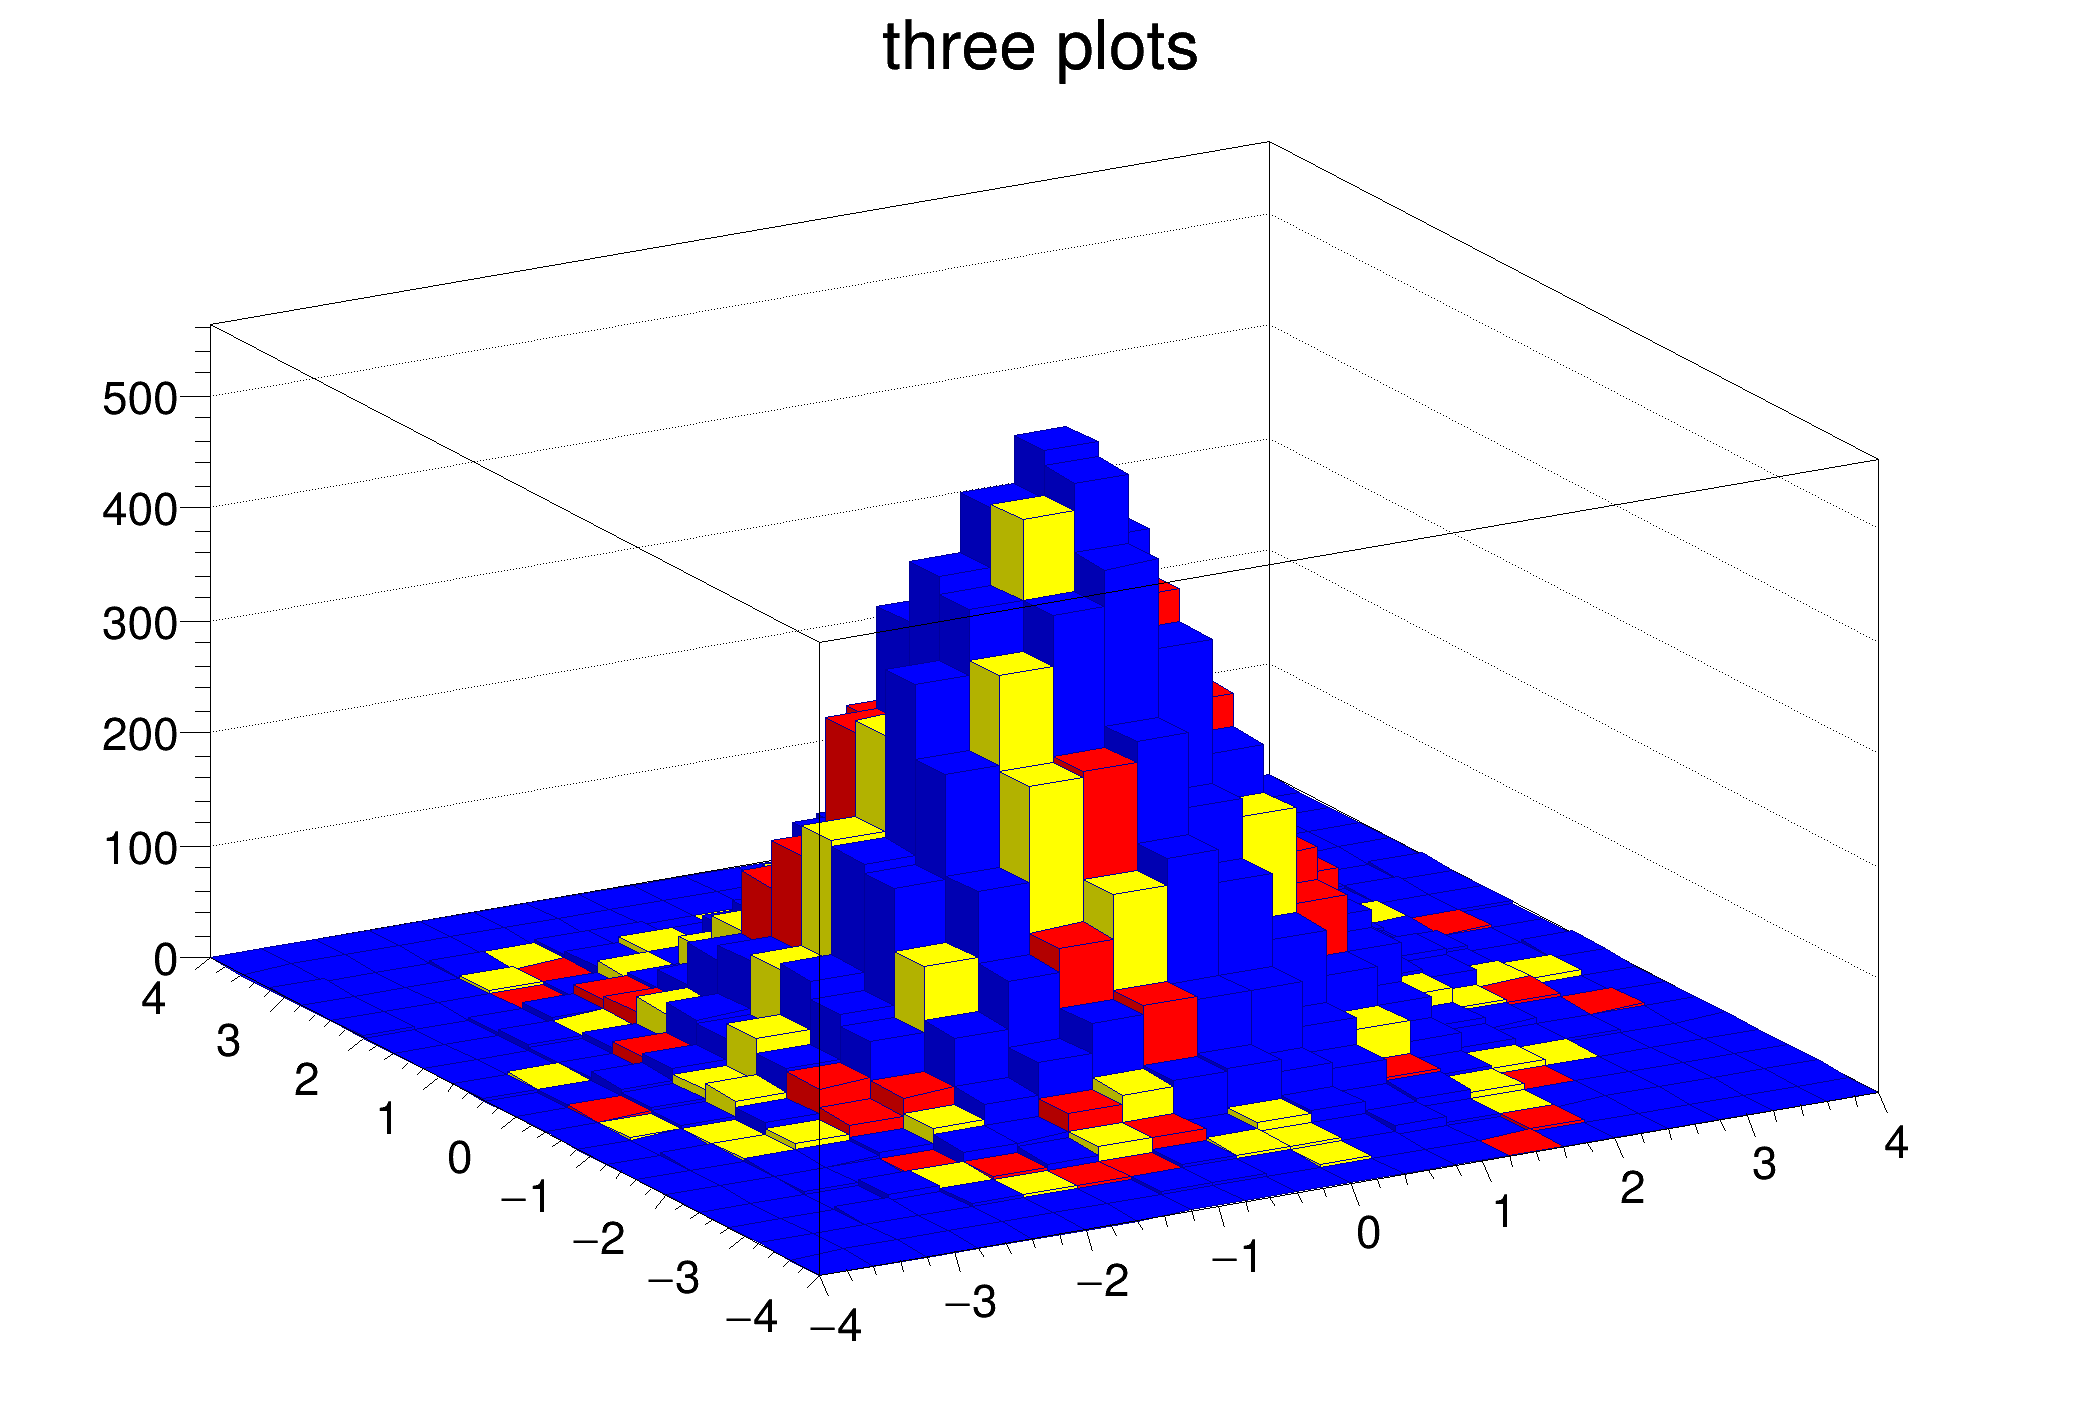 Use a THStack to show a 2-D hist with cells with different colors. Use a THStack to show a 2-D hist with cells with different colors. | |
| hist029_TRatioPlot_simple.C | |
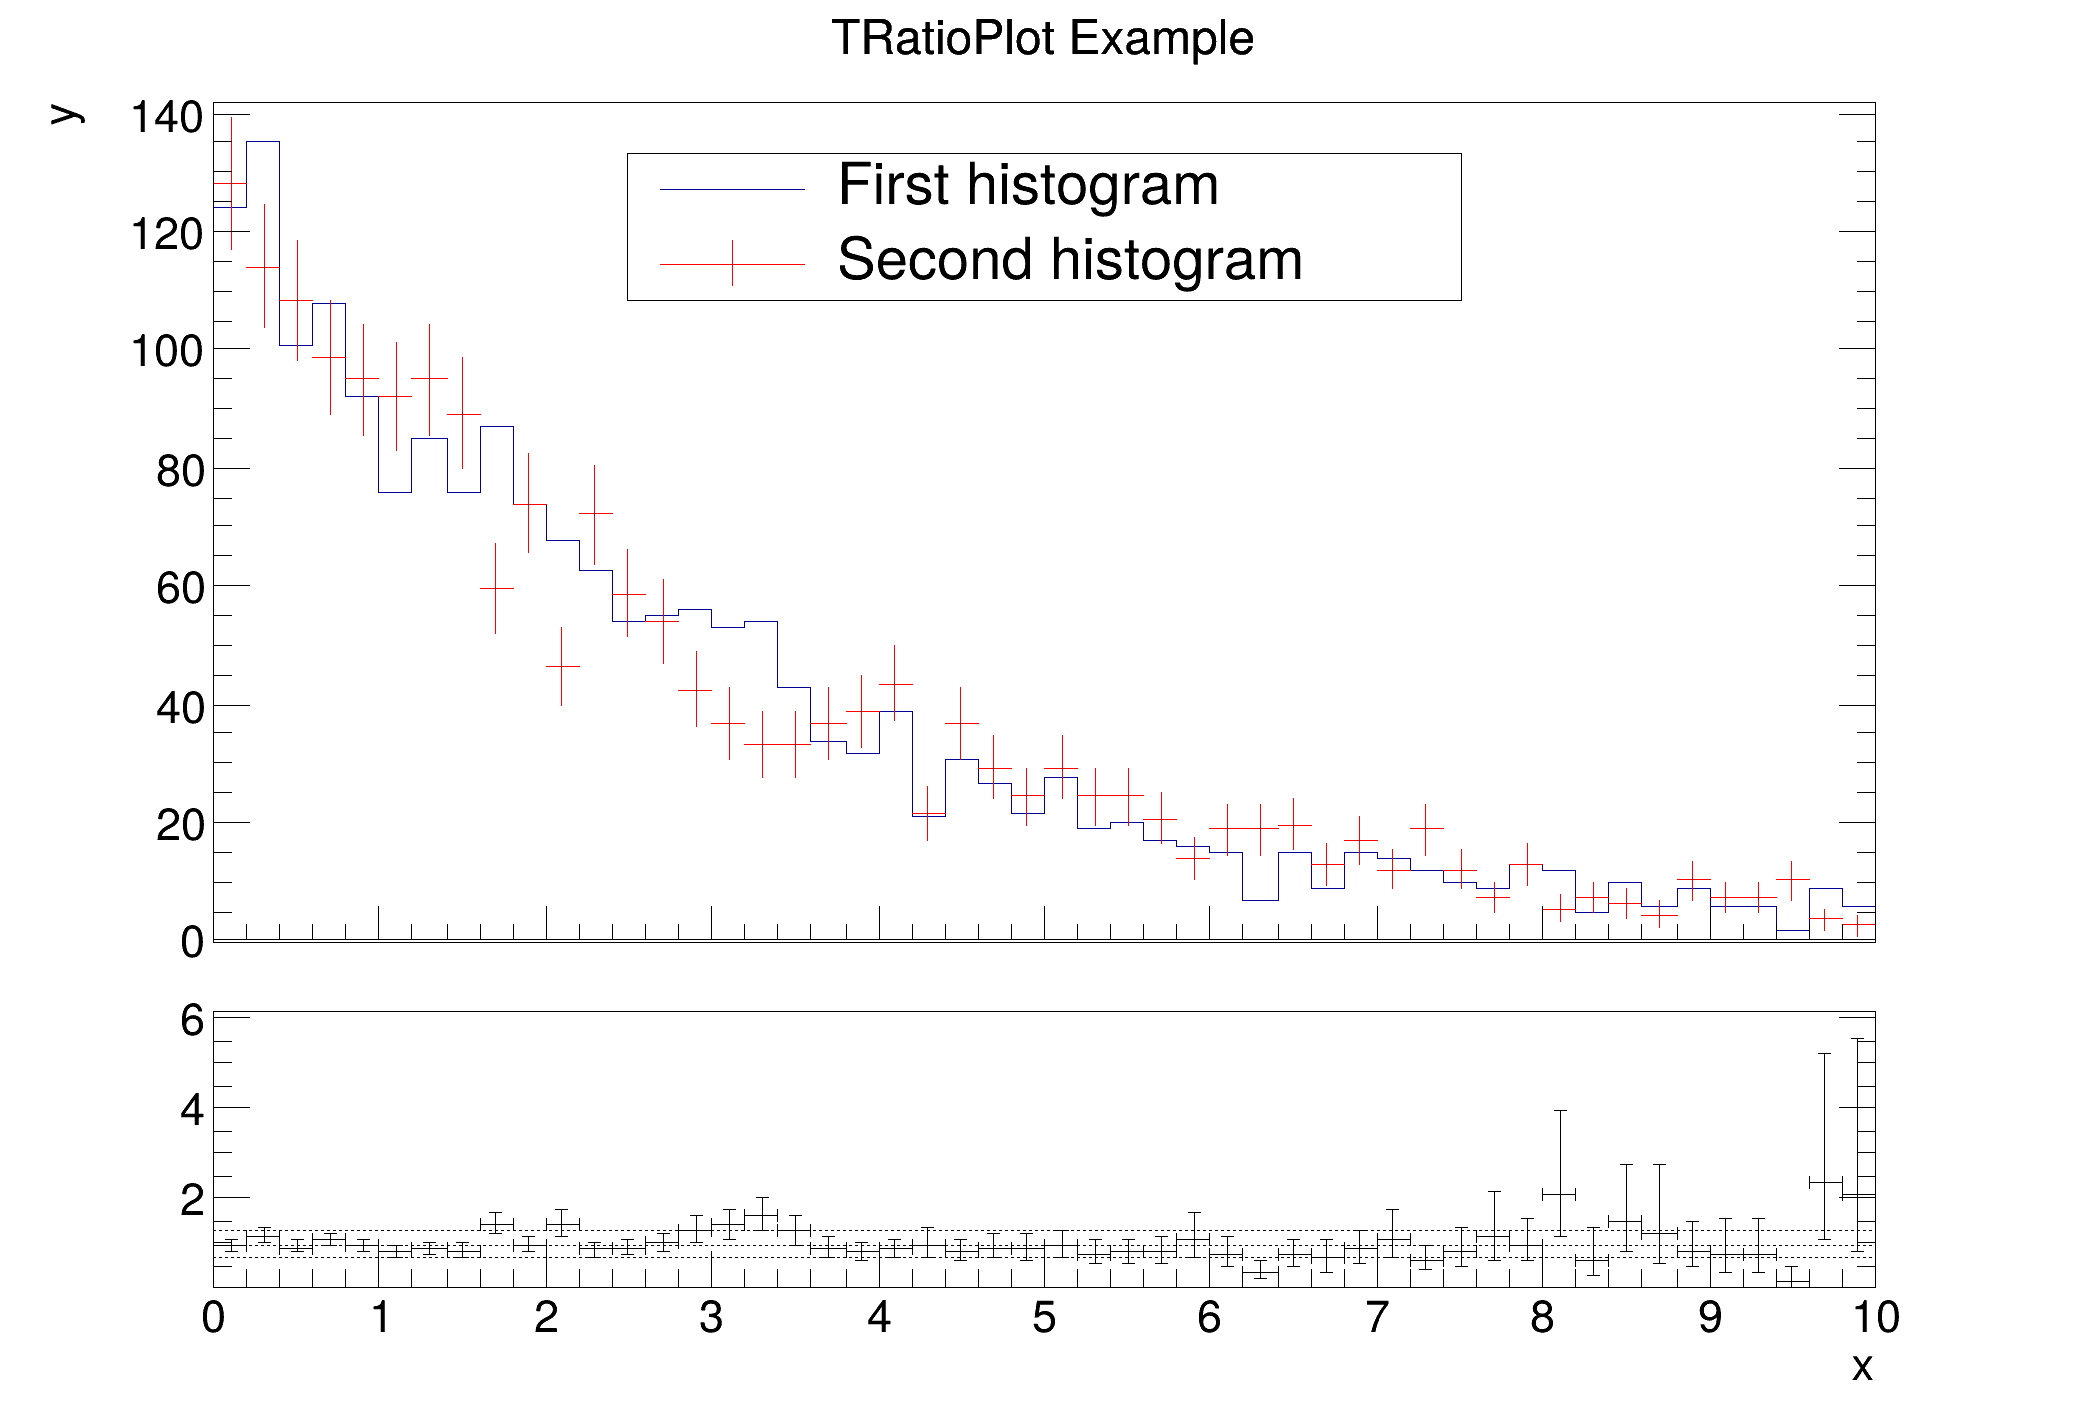 Example creating a simple ratio plot of two histograms using the "pois" division option. Example creating a simple ratio plot of two histograms using the "pois" division option. | |
| hist029_TRatioPlot_simple.py | |
| Example creating a simple ratio plot of two histograms using the pois division option. | |
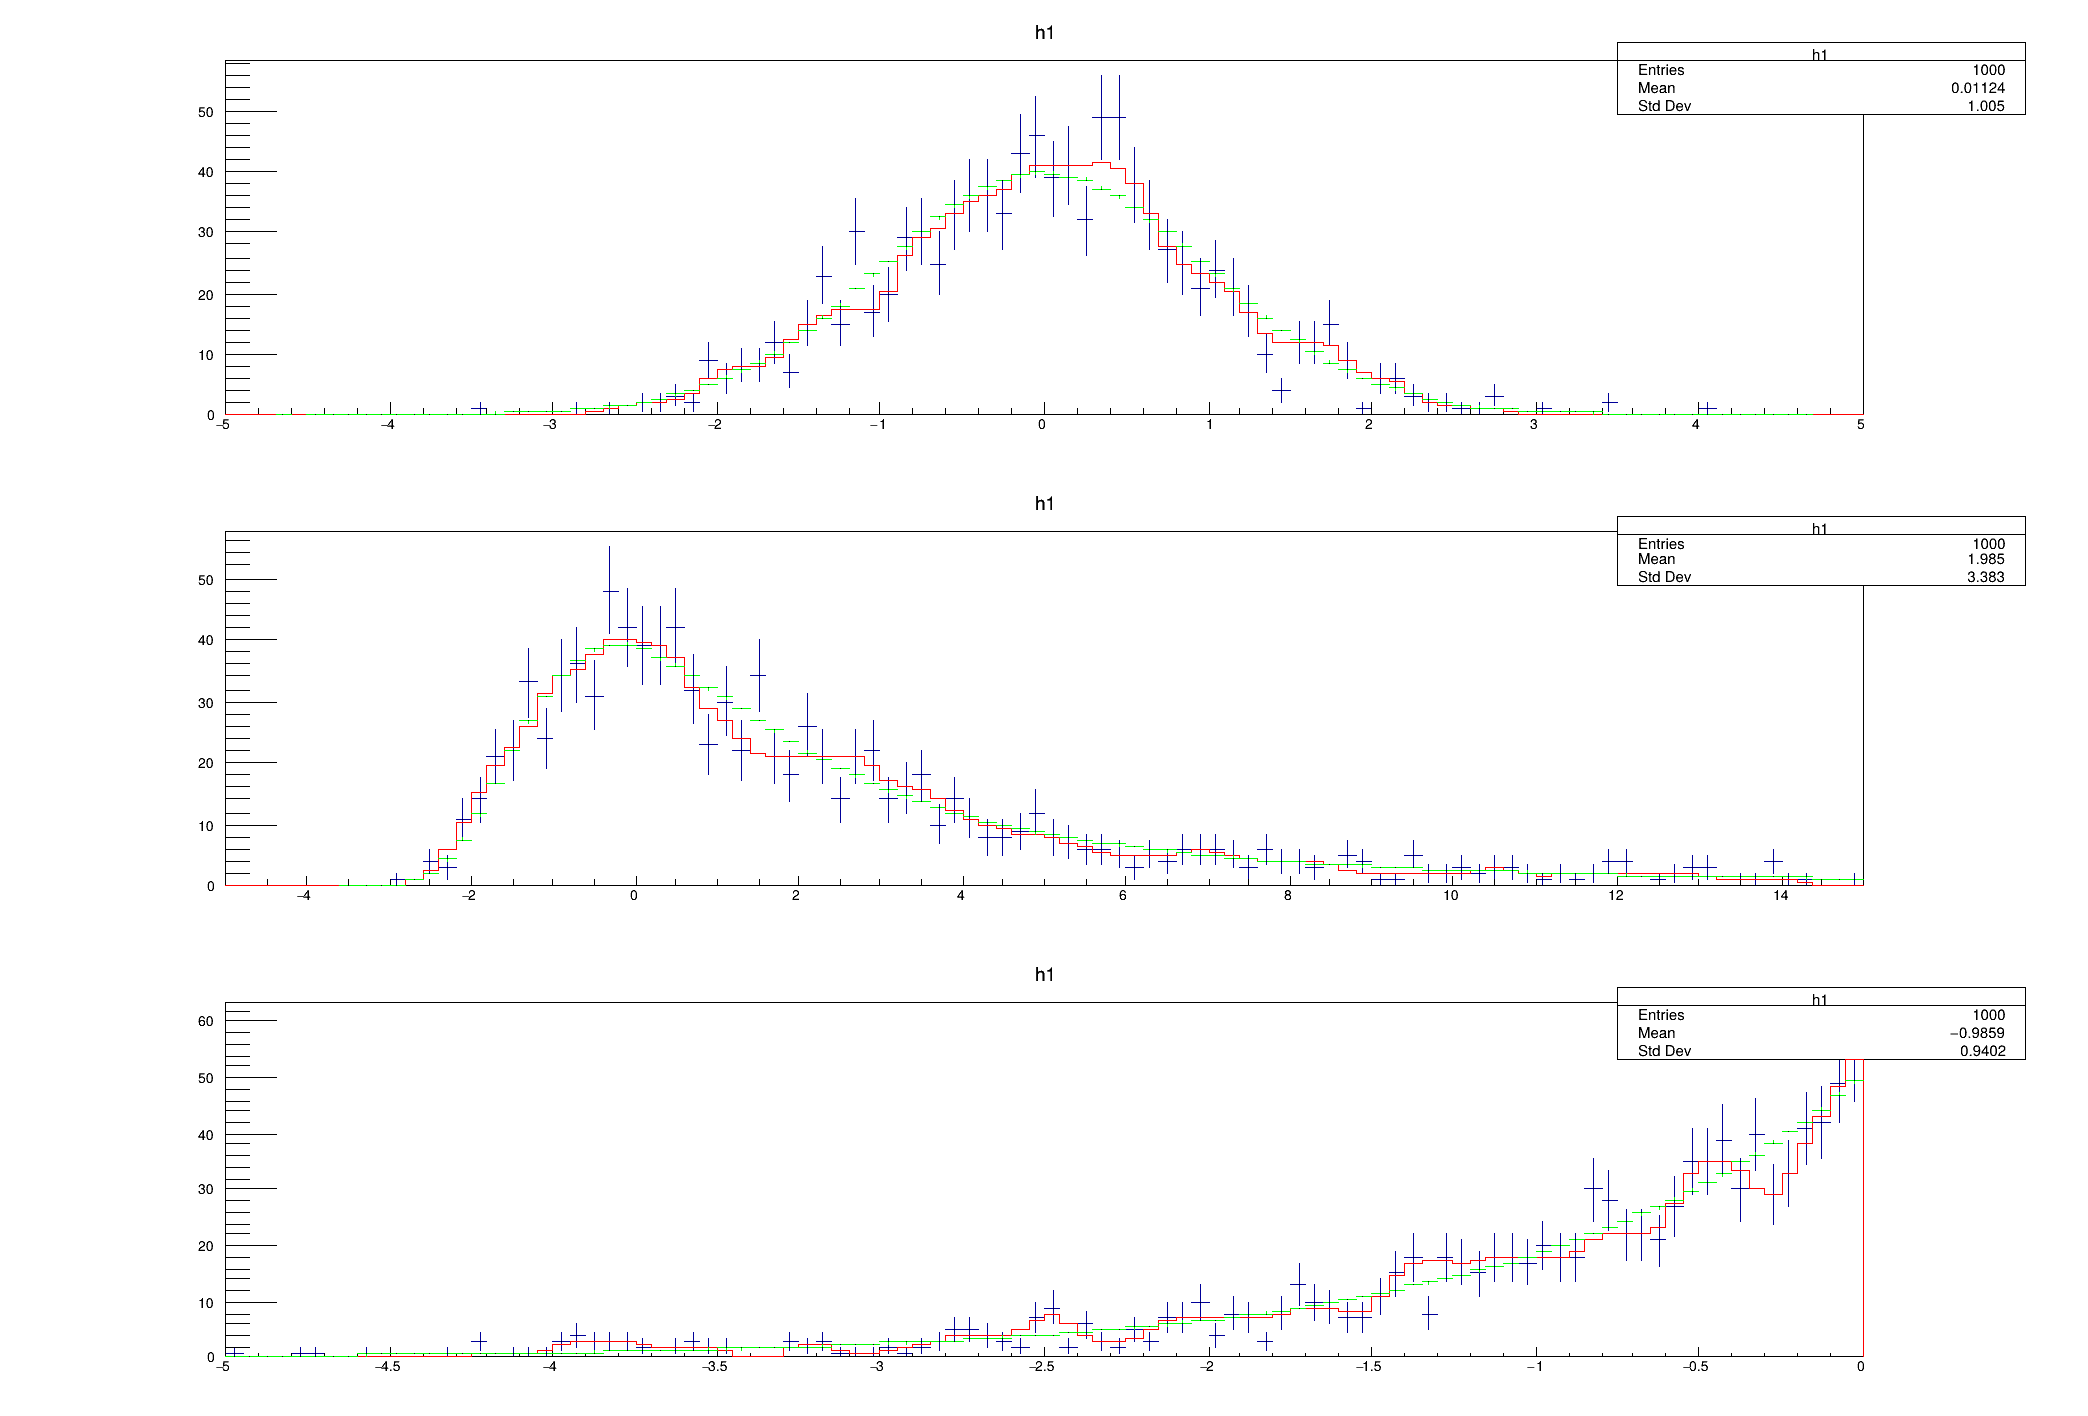
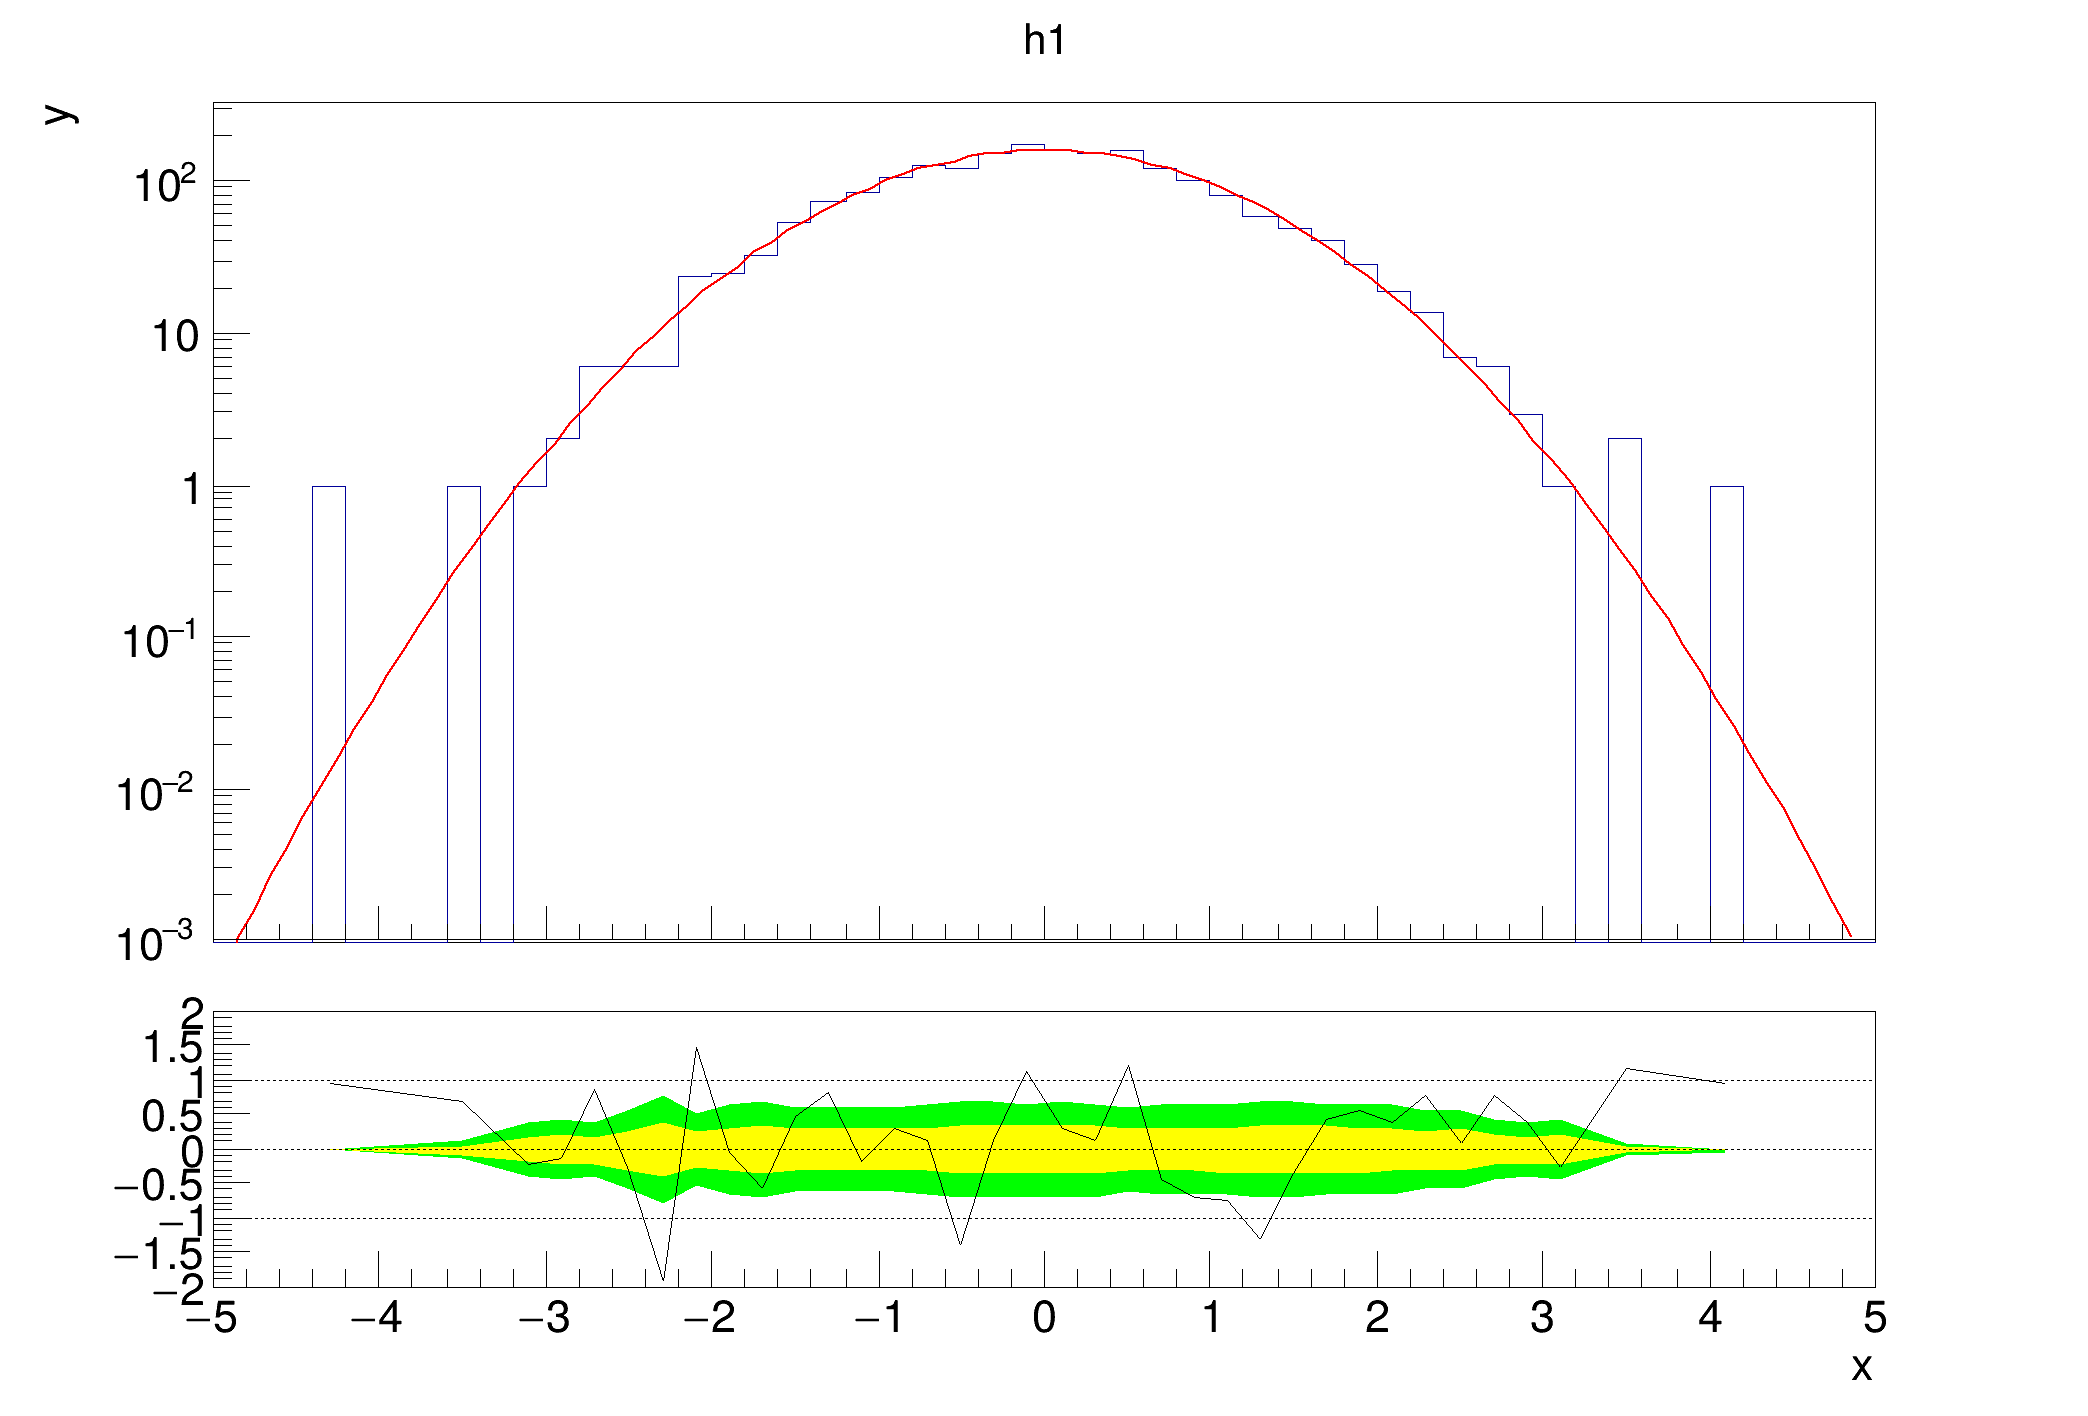
| hist030_TRatioPlot_residual.C | |
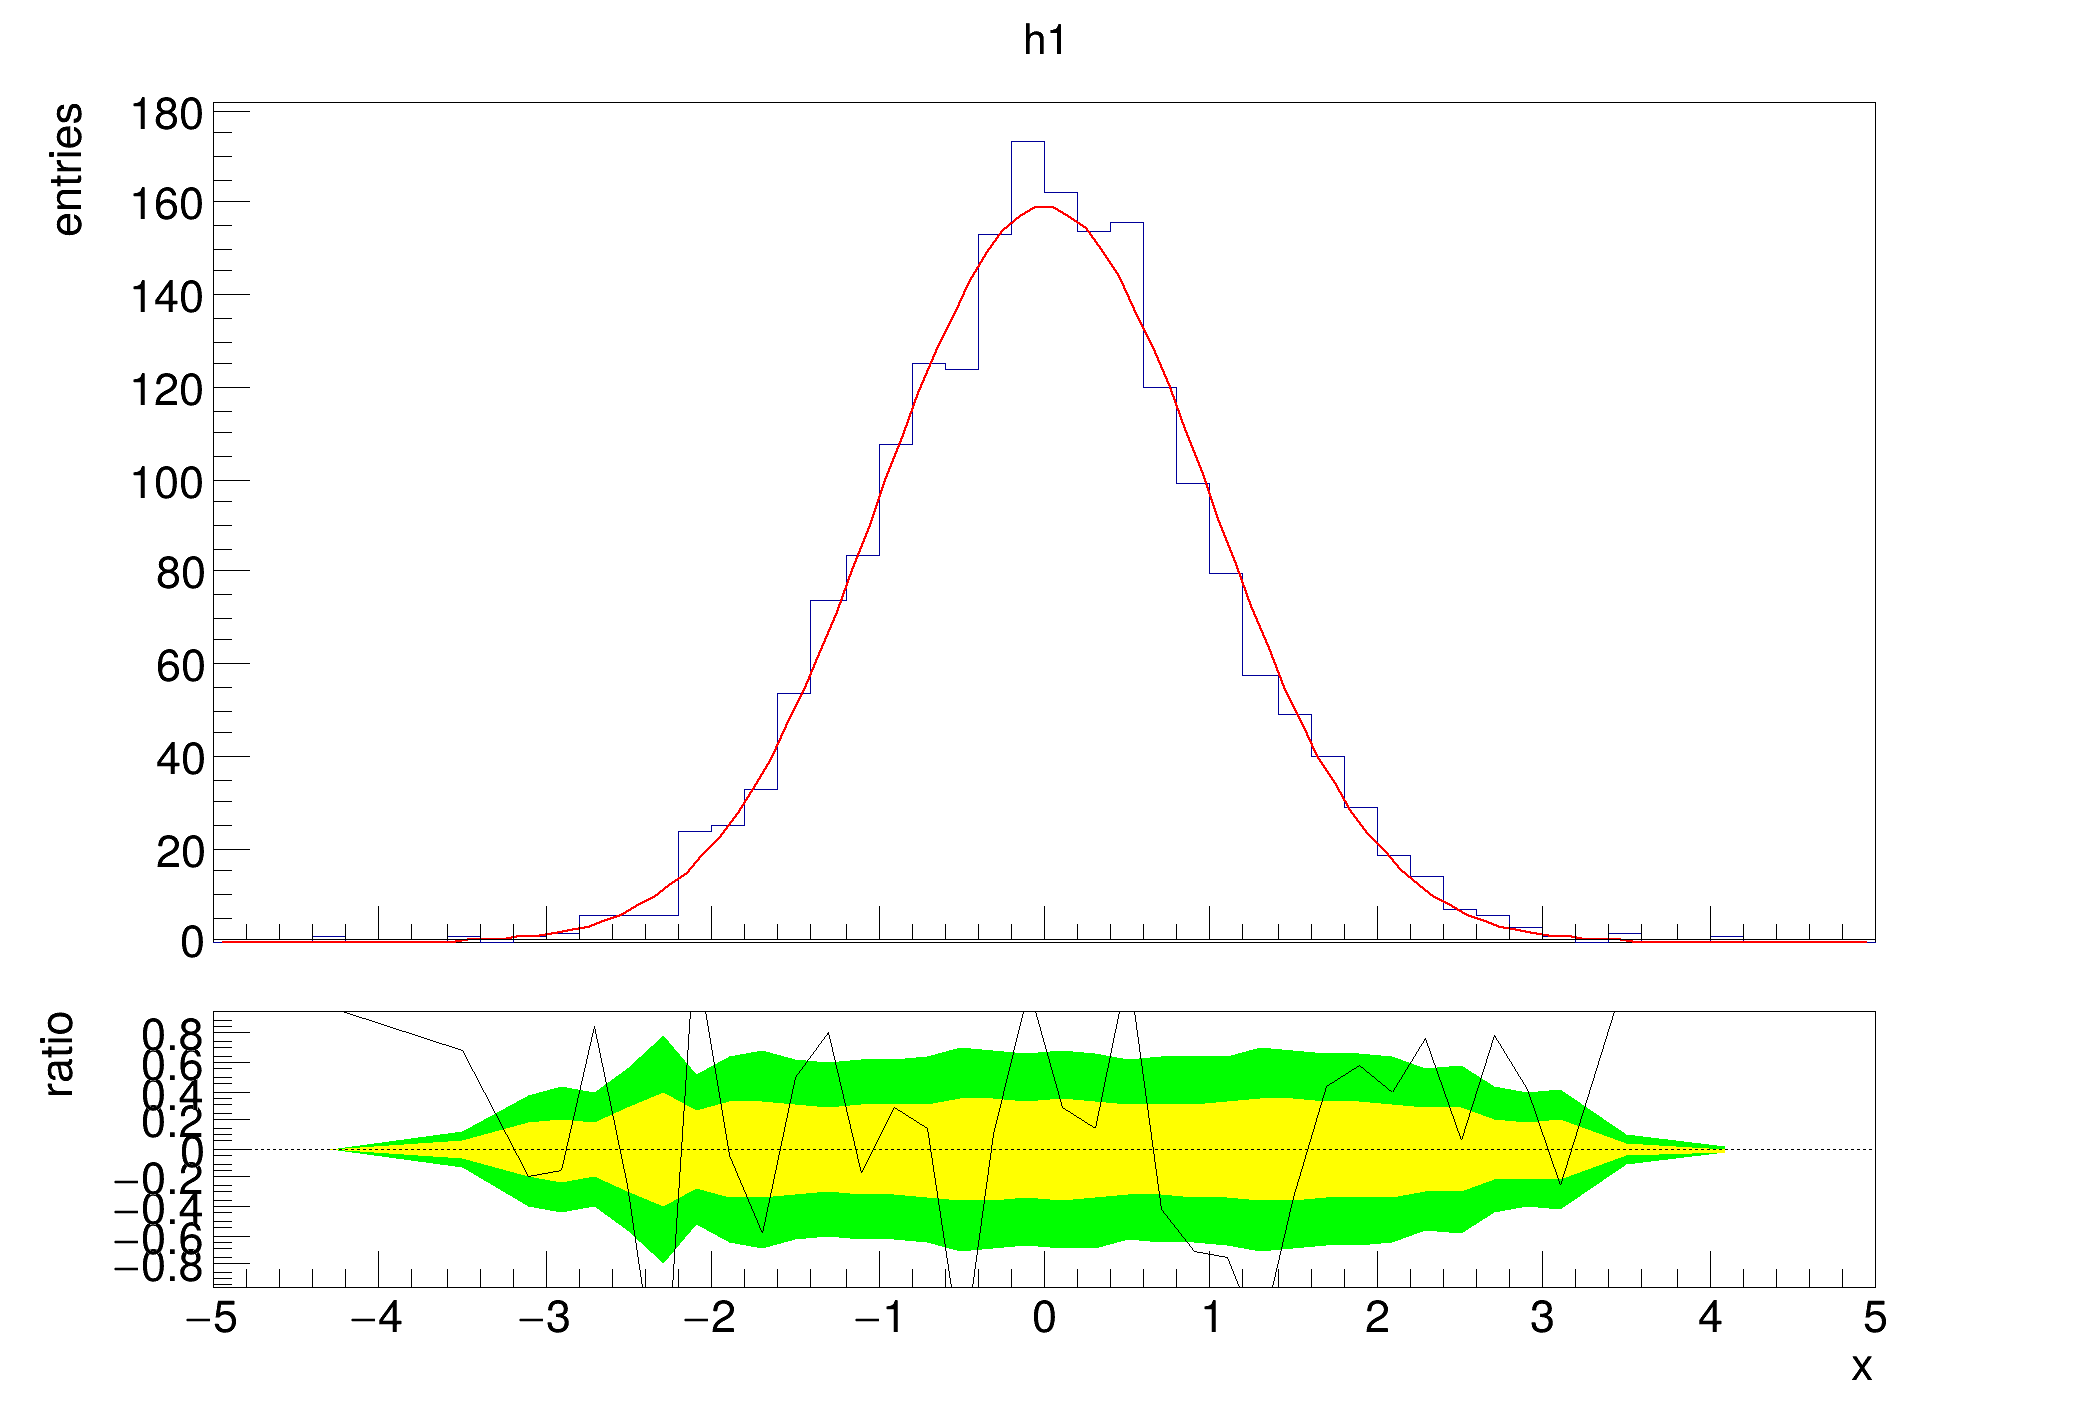 Example of a fit residual plot. Example of a fit residual plot. | |
| hist030_TRatioPlot_residual.py | |
| Example of a fit residual plot. | |
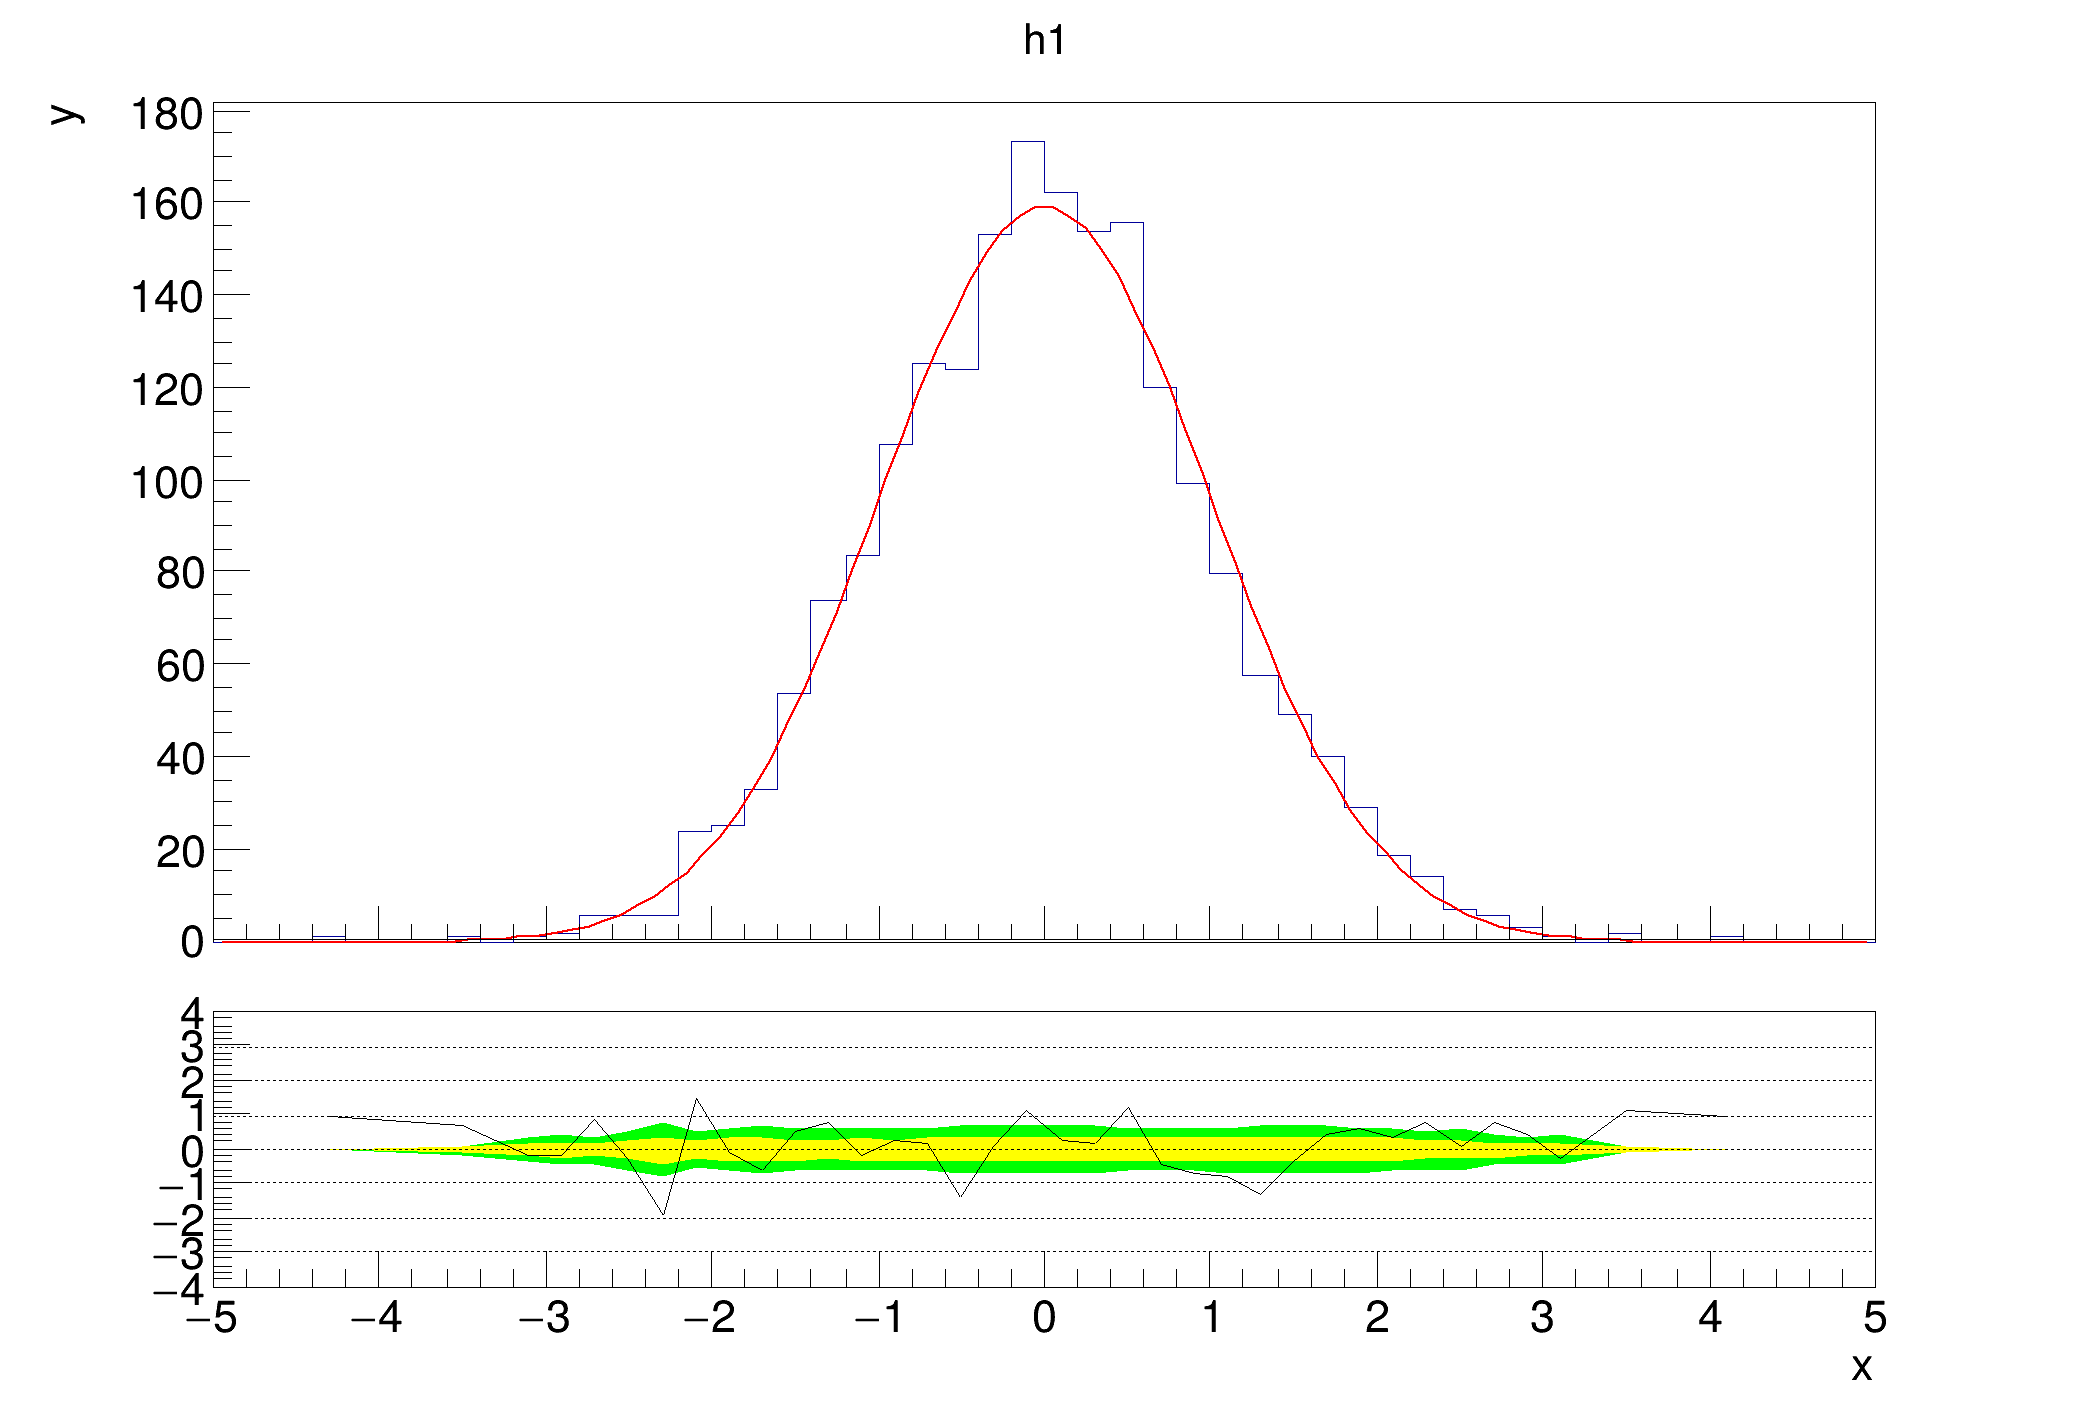
| hist031_TRatioPlot_residual_fit.C | |
 Example which shows how you can get the graph of the lower plot and set the y axis range for it. Example which shows how you can get the graph of the lower plot and set the y axis range for it. | |
| hist031_TRatioPlot_residual_fit.py | |
| Example which shows how you can get the graph of the lower plot and set the y axis range for it. | |
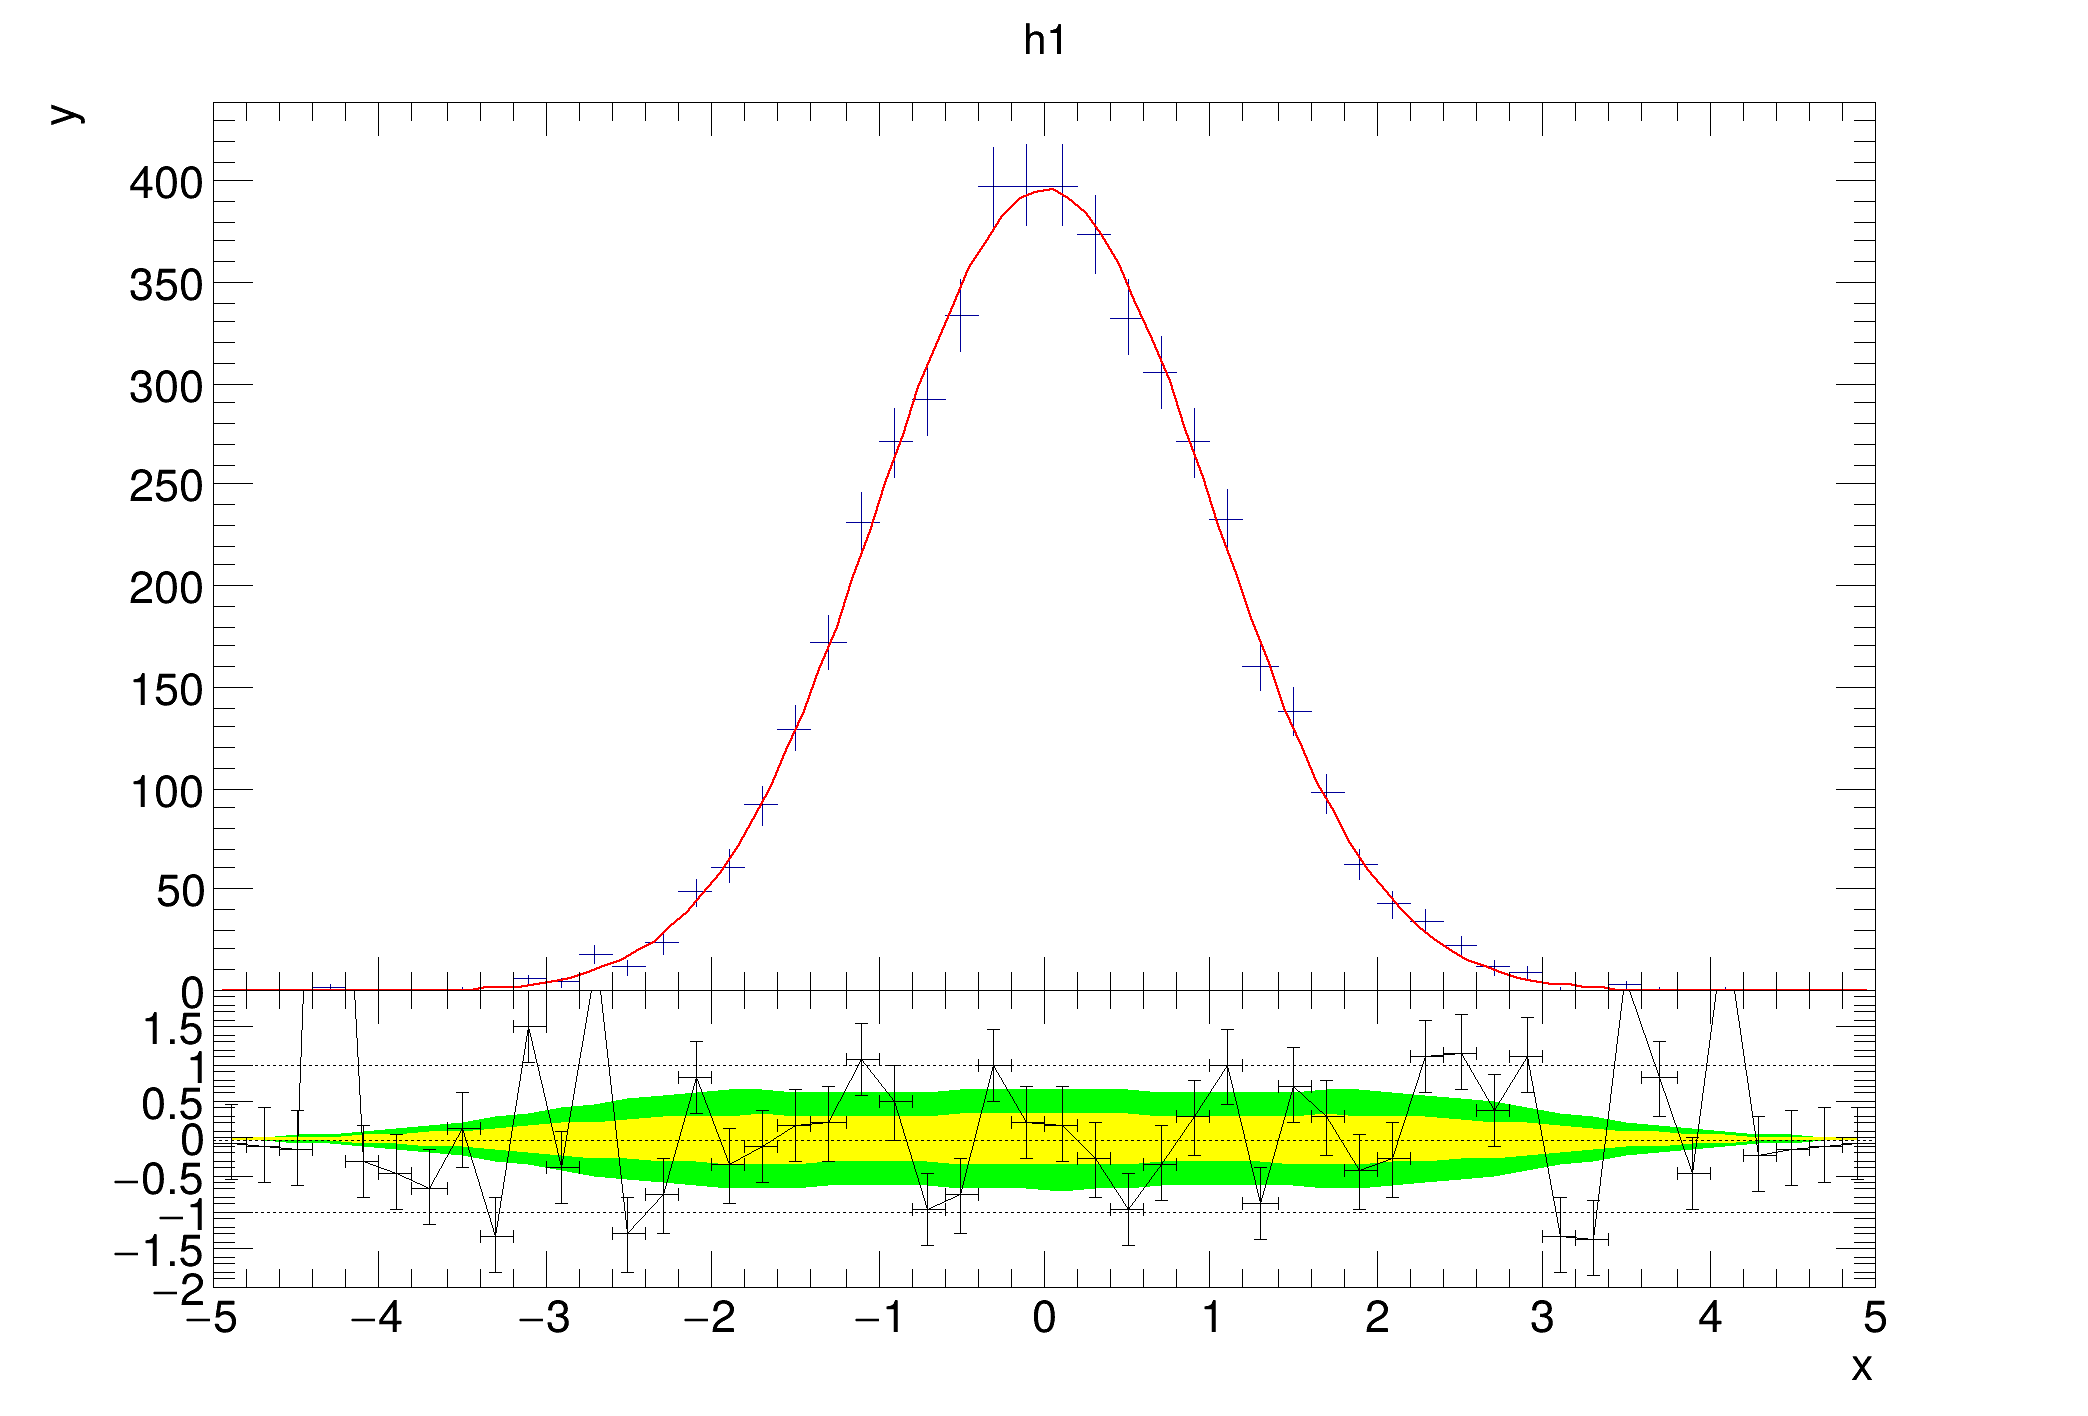
| hist032_TRatioPlot_fit_lines.C | |
 Example that shows custom dashed lines on the lower plot, specified by a vector of floats. Example that shows custom dashed lines on the lower plot, specified by a vector of floats. | |
| hist032_TRatioPlot_fit_lines.py | |
| Example that shows custom dashed lines on the lower plot, specified by a vector of floats. | |
| hist033_TRatioPlot_fit_confidence.C | |
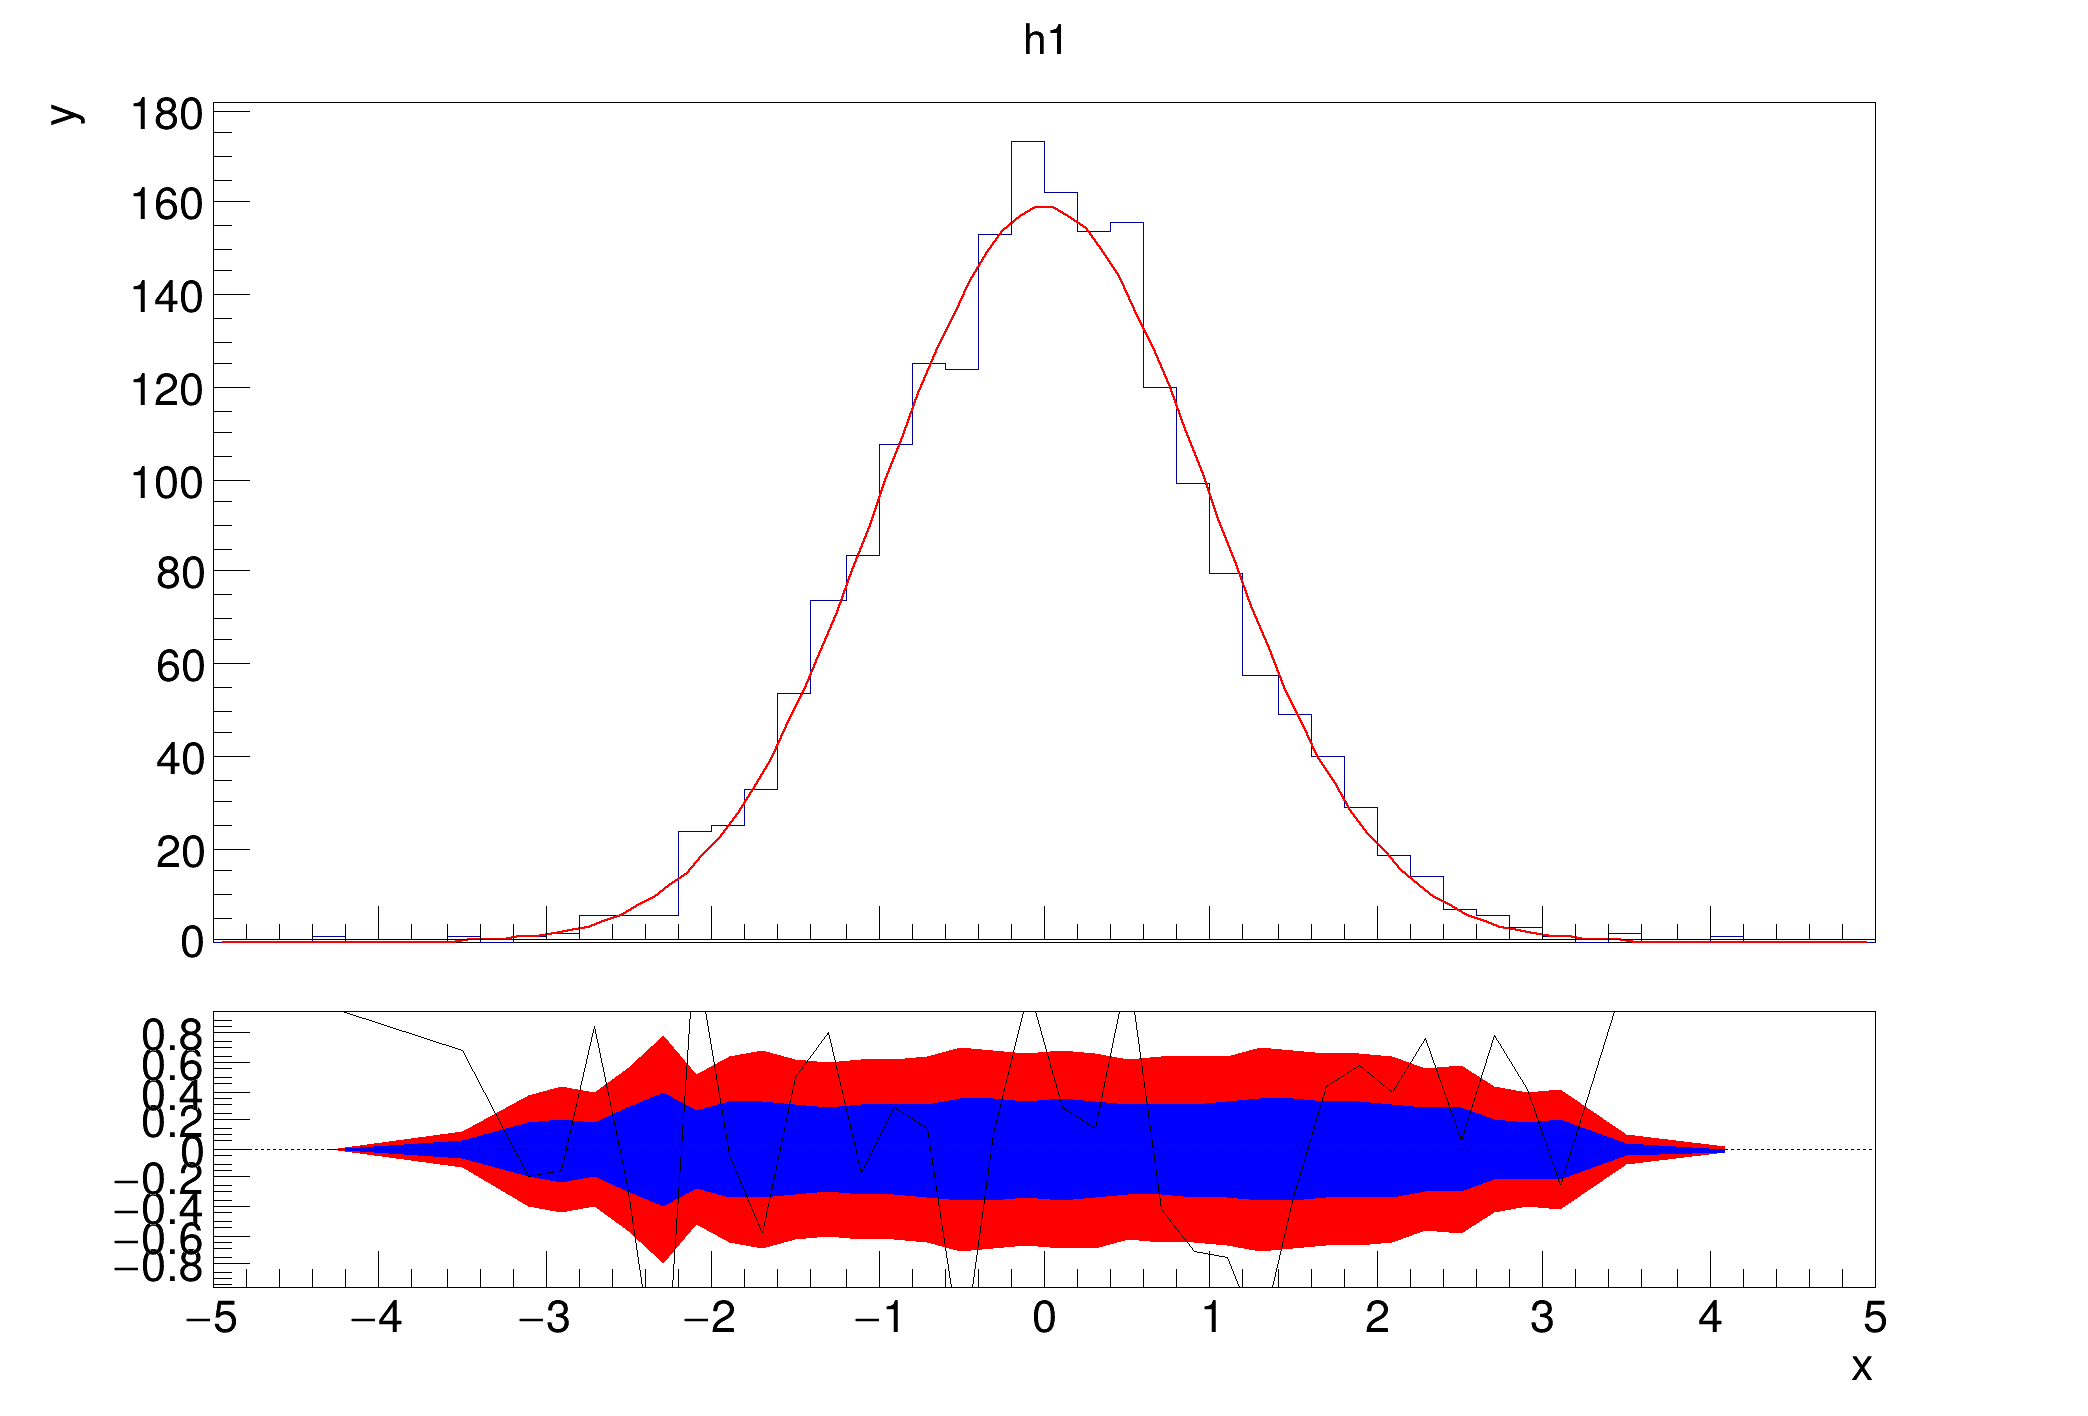 Example that shows how you can set the colors of the confidence interval bands by using the method Example that shows how you can set the colors of the confidence interval bands by using the method TRatioPlot::SetConfidenceIntervalColors. | |
| hist033_TRatioPlot_fit_confidence.py | |
| Example that shows how you can set the colors of the confidence interval bands by using the method TRatioPlot::SetConfidenceIntervalColors. | |
| hist034_TRatioPlot_fit_margin.C | |
 Example showing a fit residual plot, where the separation margin has been set to 0. Example showing a fit residual plot, where the separation margin has been set to 0. | |
| hist034_TRatioPlot_fit_margin.py | |
| Example showing a fit residual plot, where the separation margin has been set to 0. | |
| hist036_TH2_labels.C | |
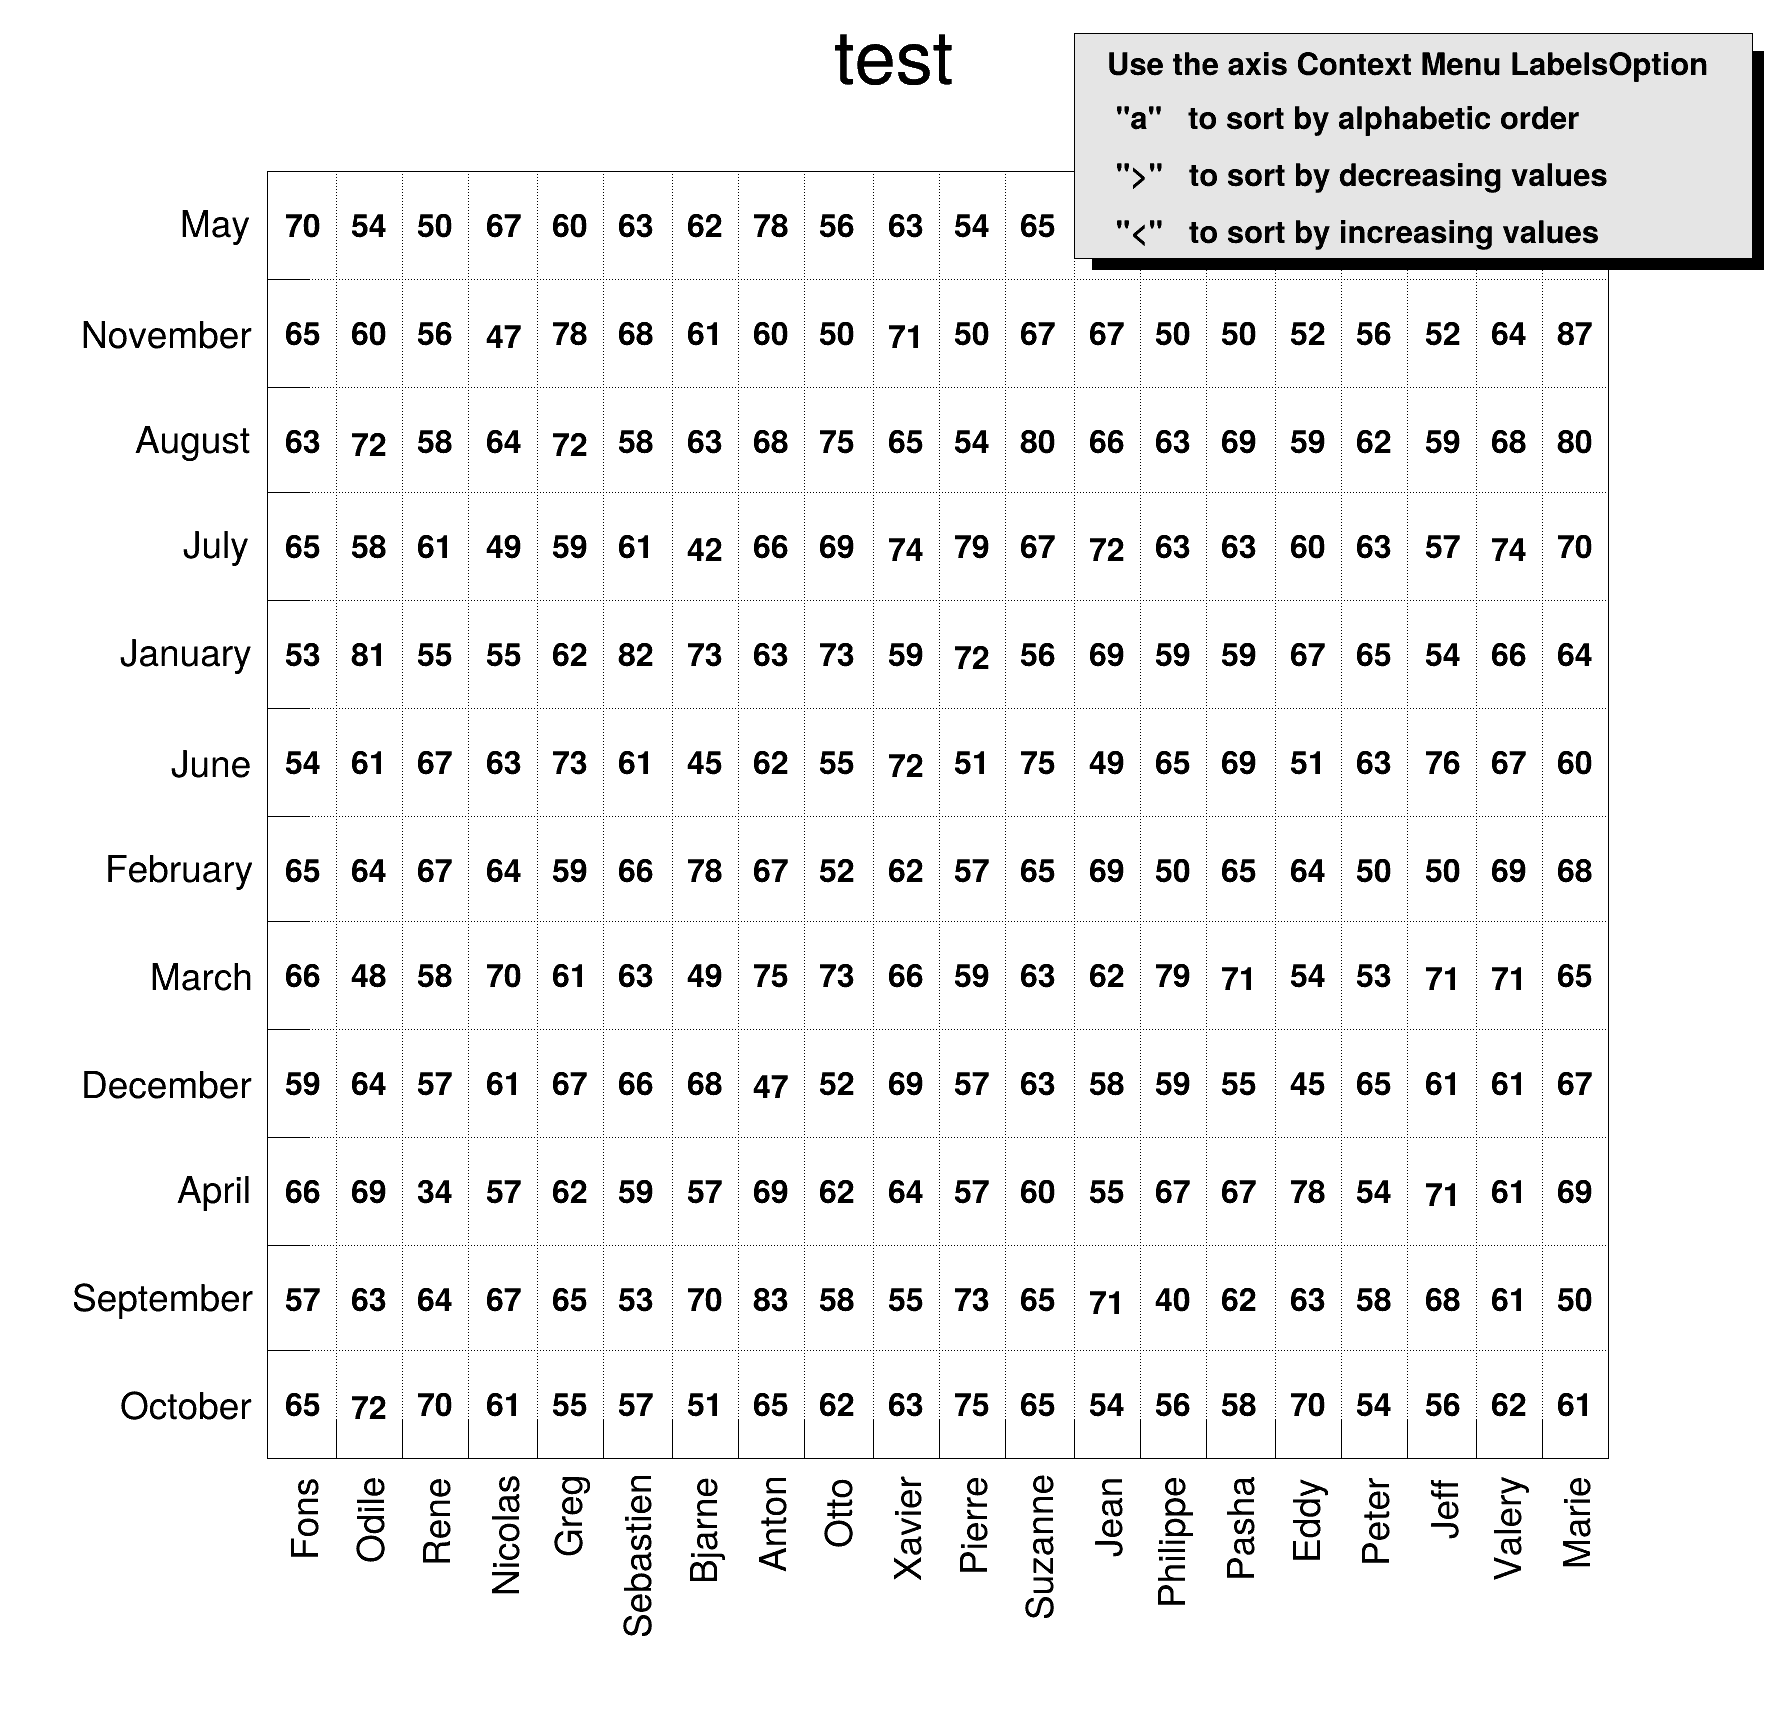 2-D histograms with alphanumeric labels. 2-D histograms with alphanumeric labels. | |
| hist037_TH2Poly_boxes.C | |
| This tutorial illustrates how to create an histogram with polygonal bins (TH2Poly). | |
| hist038_TH2Poly_honeycomb.C | |
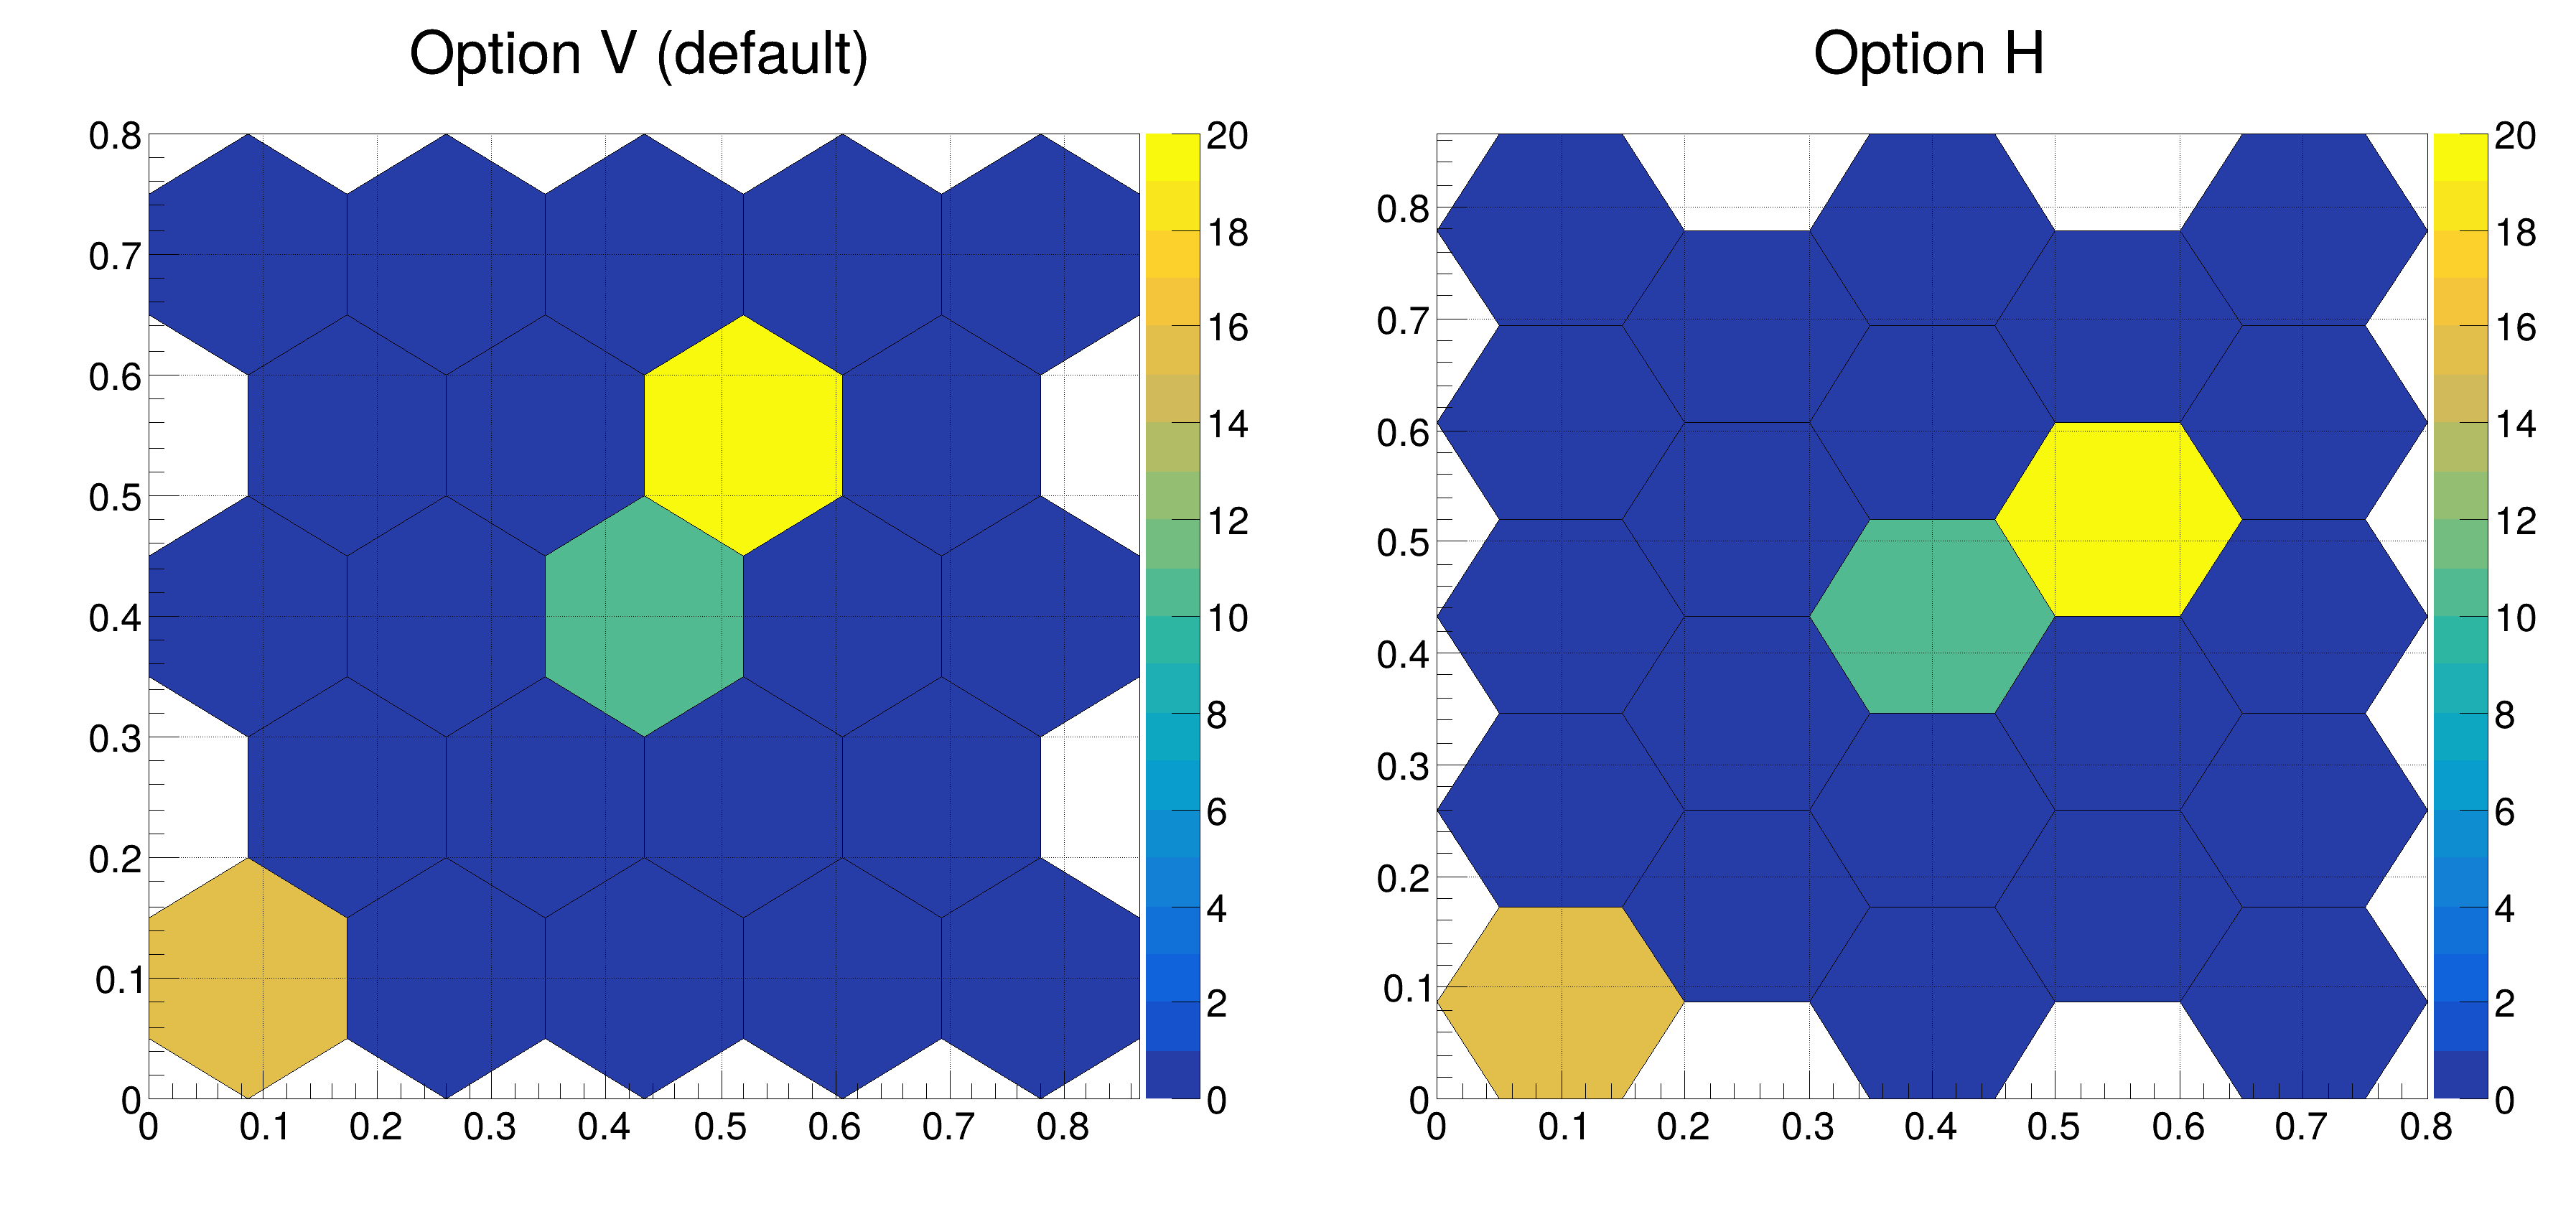 This tutorial illustrates how to create an histogram with hexagonal bins (TH2Poly). This tutorial illustrates how to create an histogram with hexagonal bins (TH2Poly). | |
| hist039_TH2Poly_usa.C | |
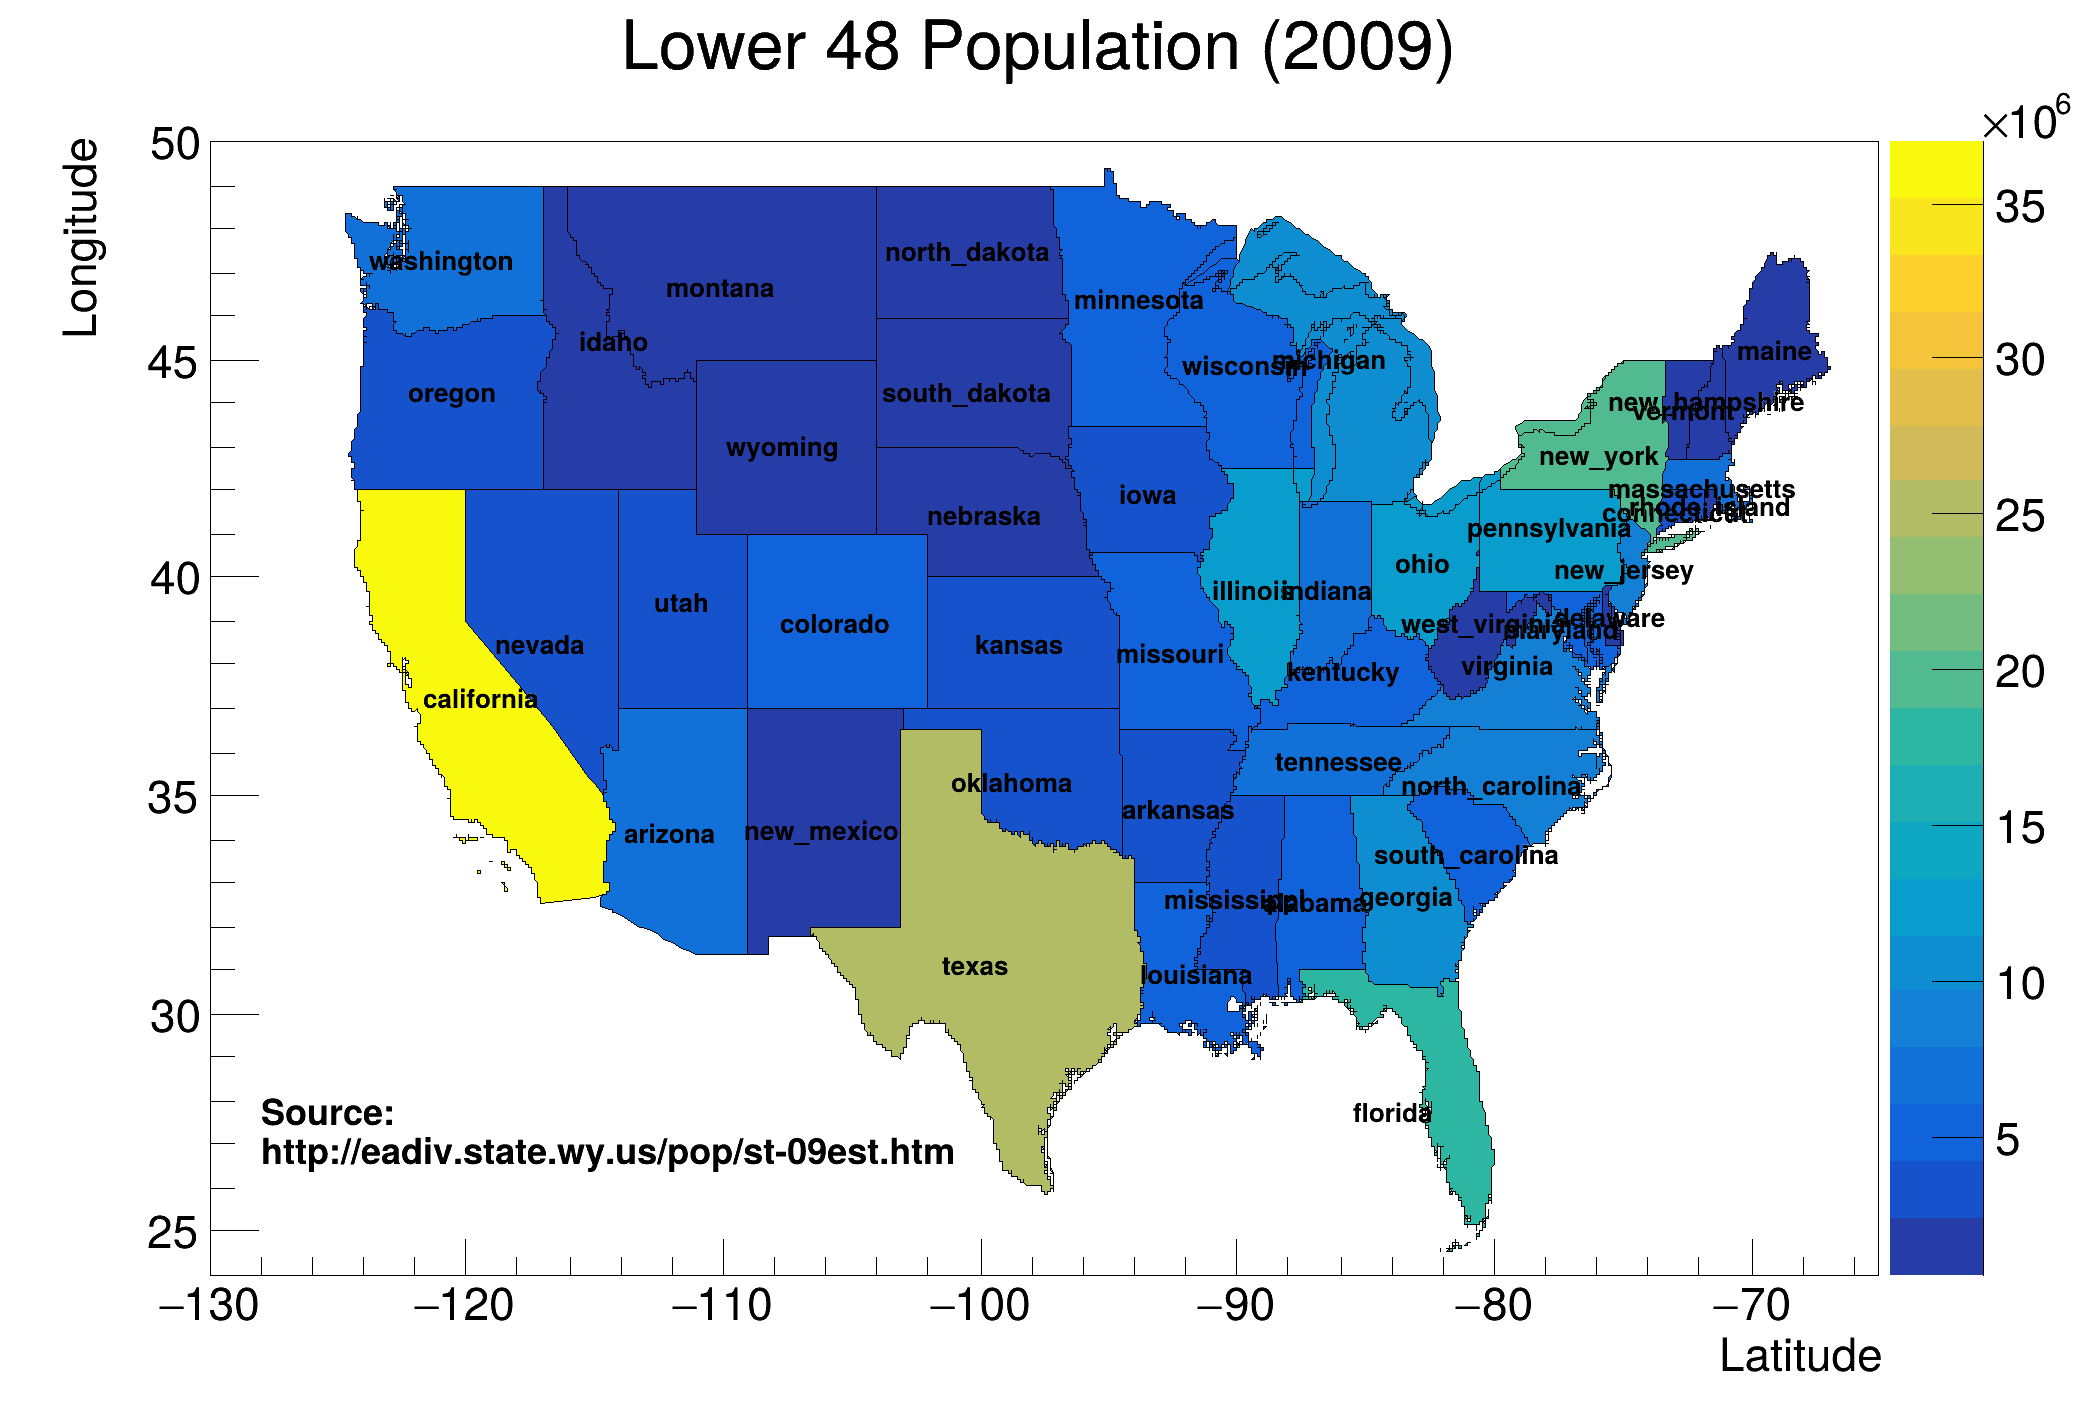 This tutorial illustrates how to create an histogram with polygonal bins (TH2Poly), fill it and draw it using the This tutorial illustrates how to create an histogram with polygonal bins (TH2Poly), fill it and draw it using the col option. | |
| hist039_TH2Poly_usa.py | |
| hist041_TProfile2Poly_realistic.C | |
 Different charges depending on region. Different charges depending on region. | |
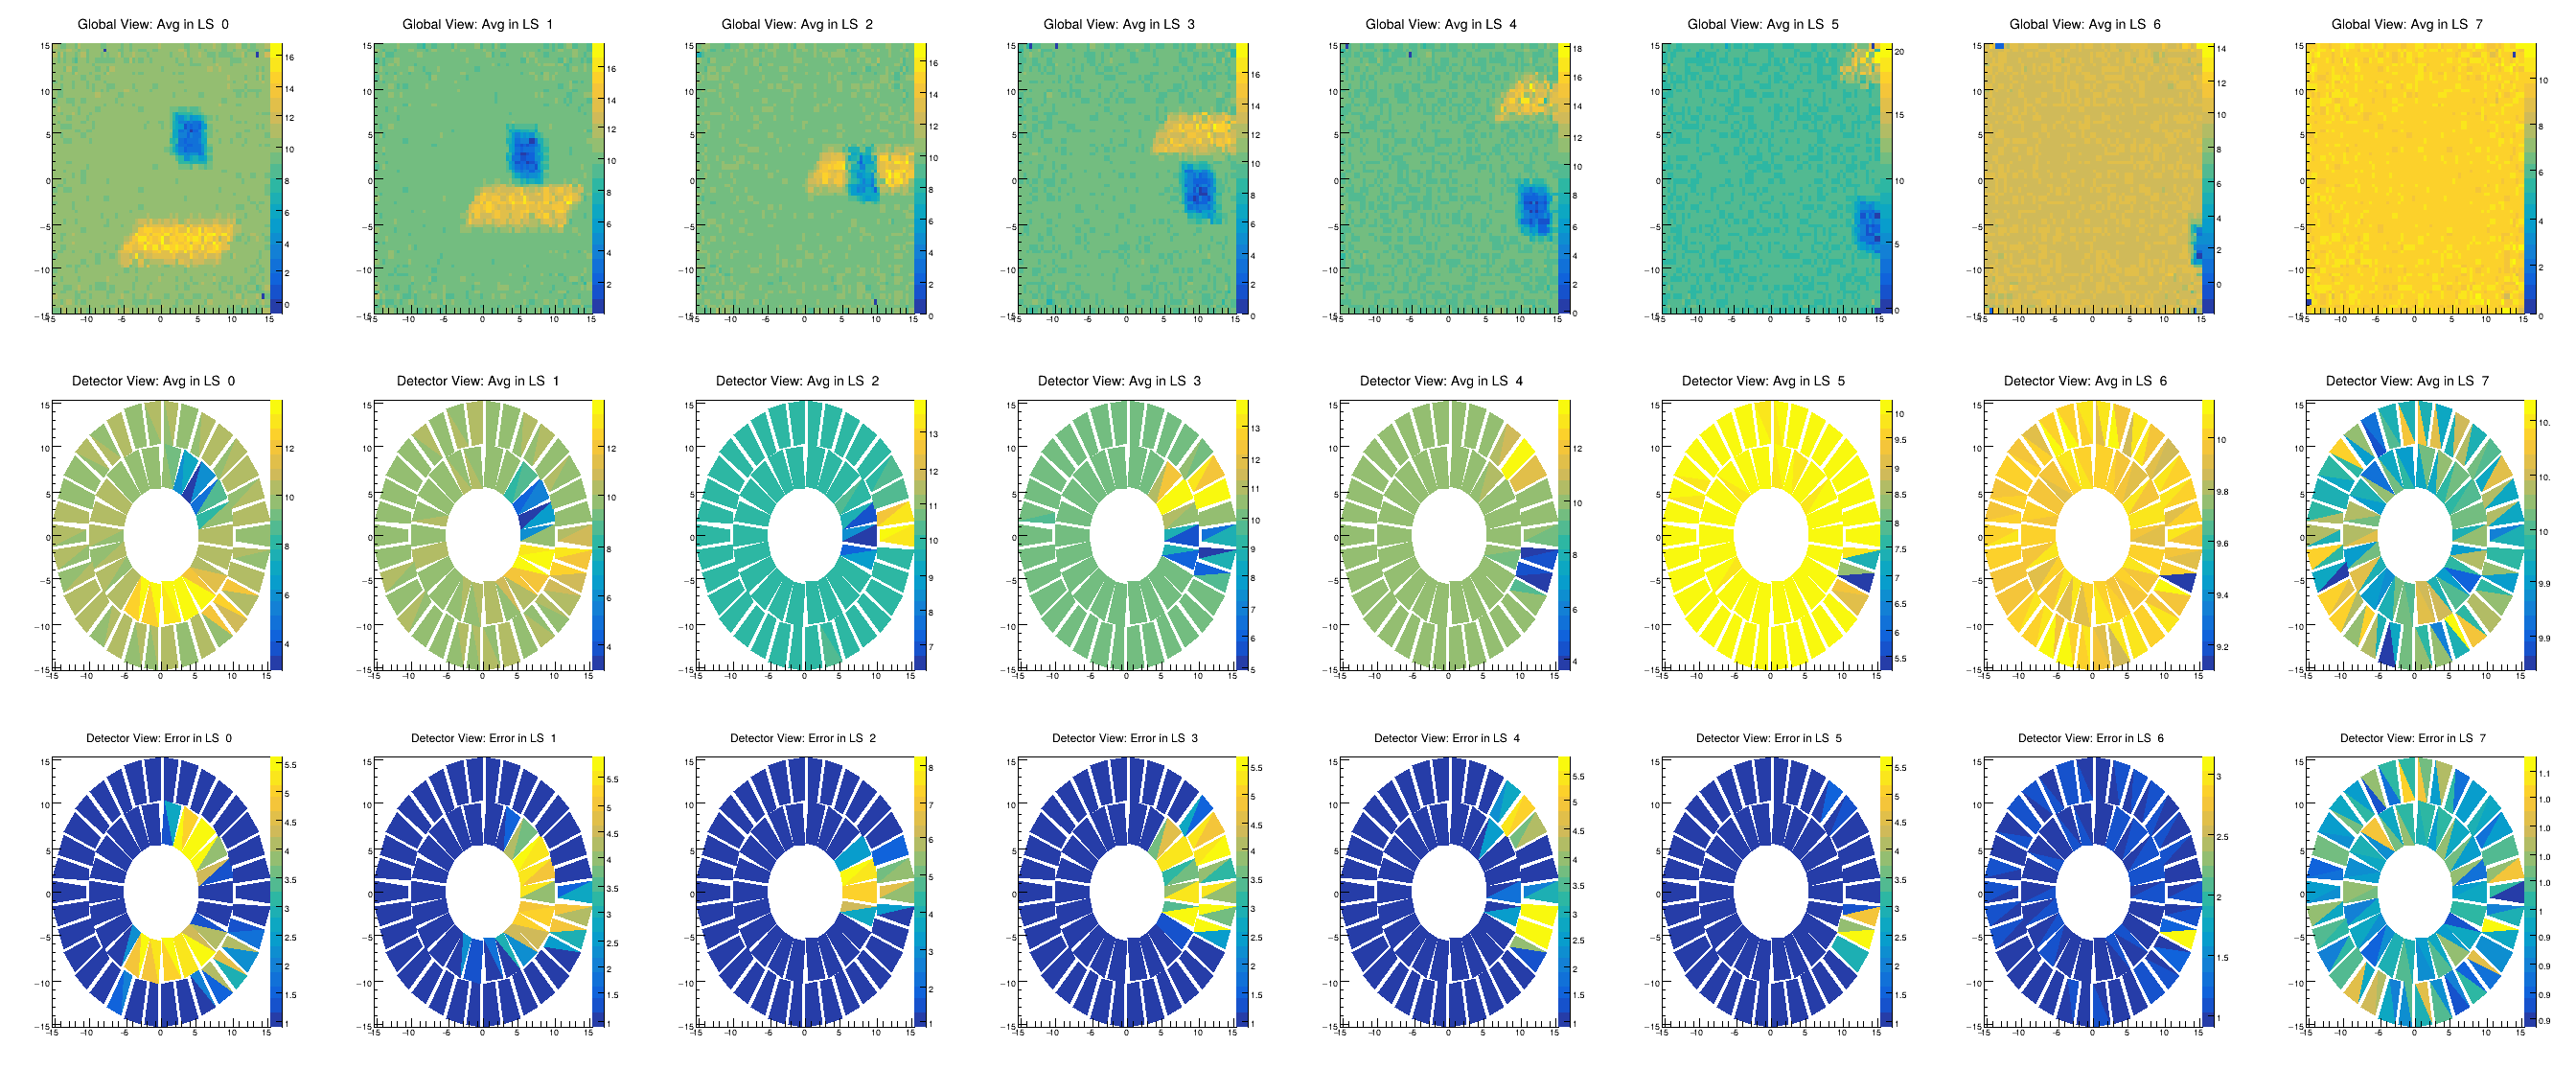
| hist042_TProfile2Poly_module_error.C | |
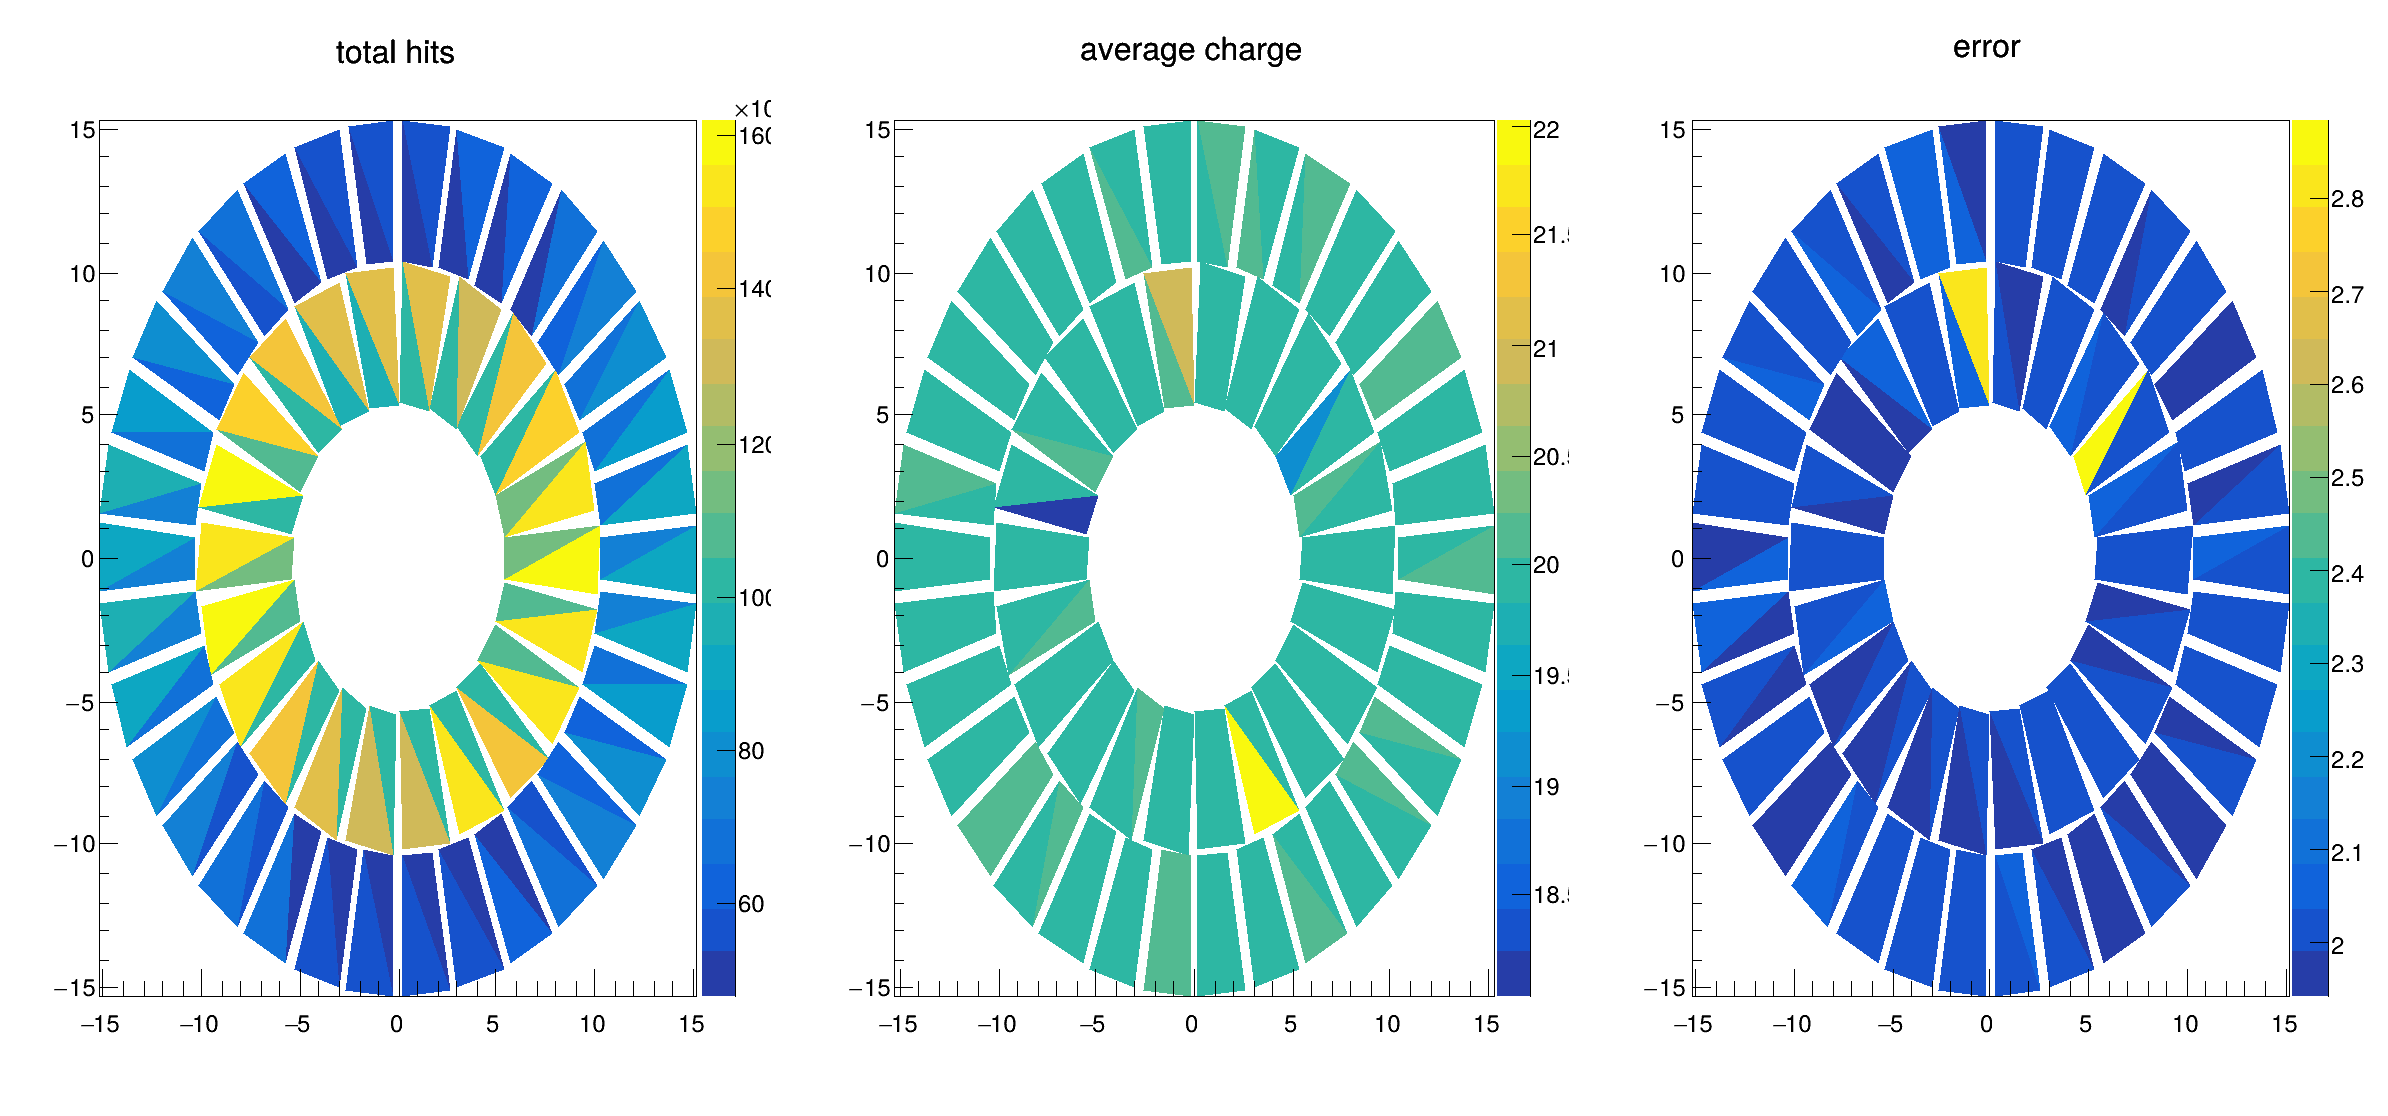 Simulate faulty detector panel w.r.t. Simulate faulty detector panel w.r.t. | |
| hist043_Graphics_highlight.C | |
| This tutorial demonstrates how the highlight mechanism can be used on an histogram. | |
| hist044_Graphics_highlight2D.C | |
| This tutorial demonstrates how the highlight mechanism can be used on an histogram. | |
| hist045_Graphics_highlight_ntuple.C | |
| This tutorial demonstrates how the highlight mechanism can be used on a ntuple. | |
| hist046_Graphics_highlight1D.C | |
| This tutorial demonstrates how the highlight mechanism can be used on an histogram. | |
| hist047_Graphics_candle_decay.C | |
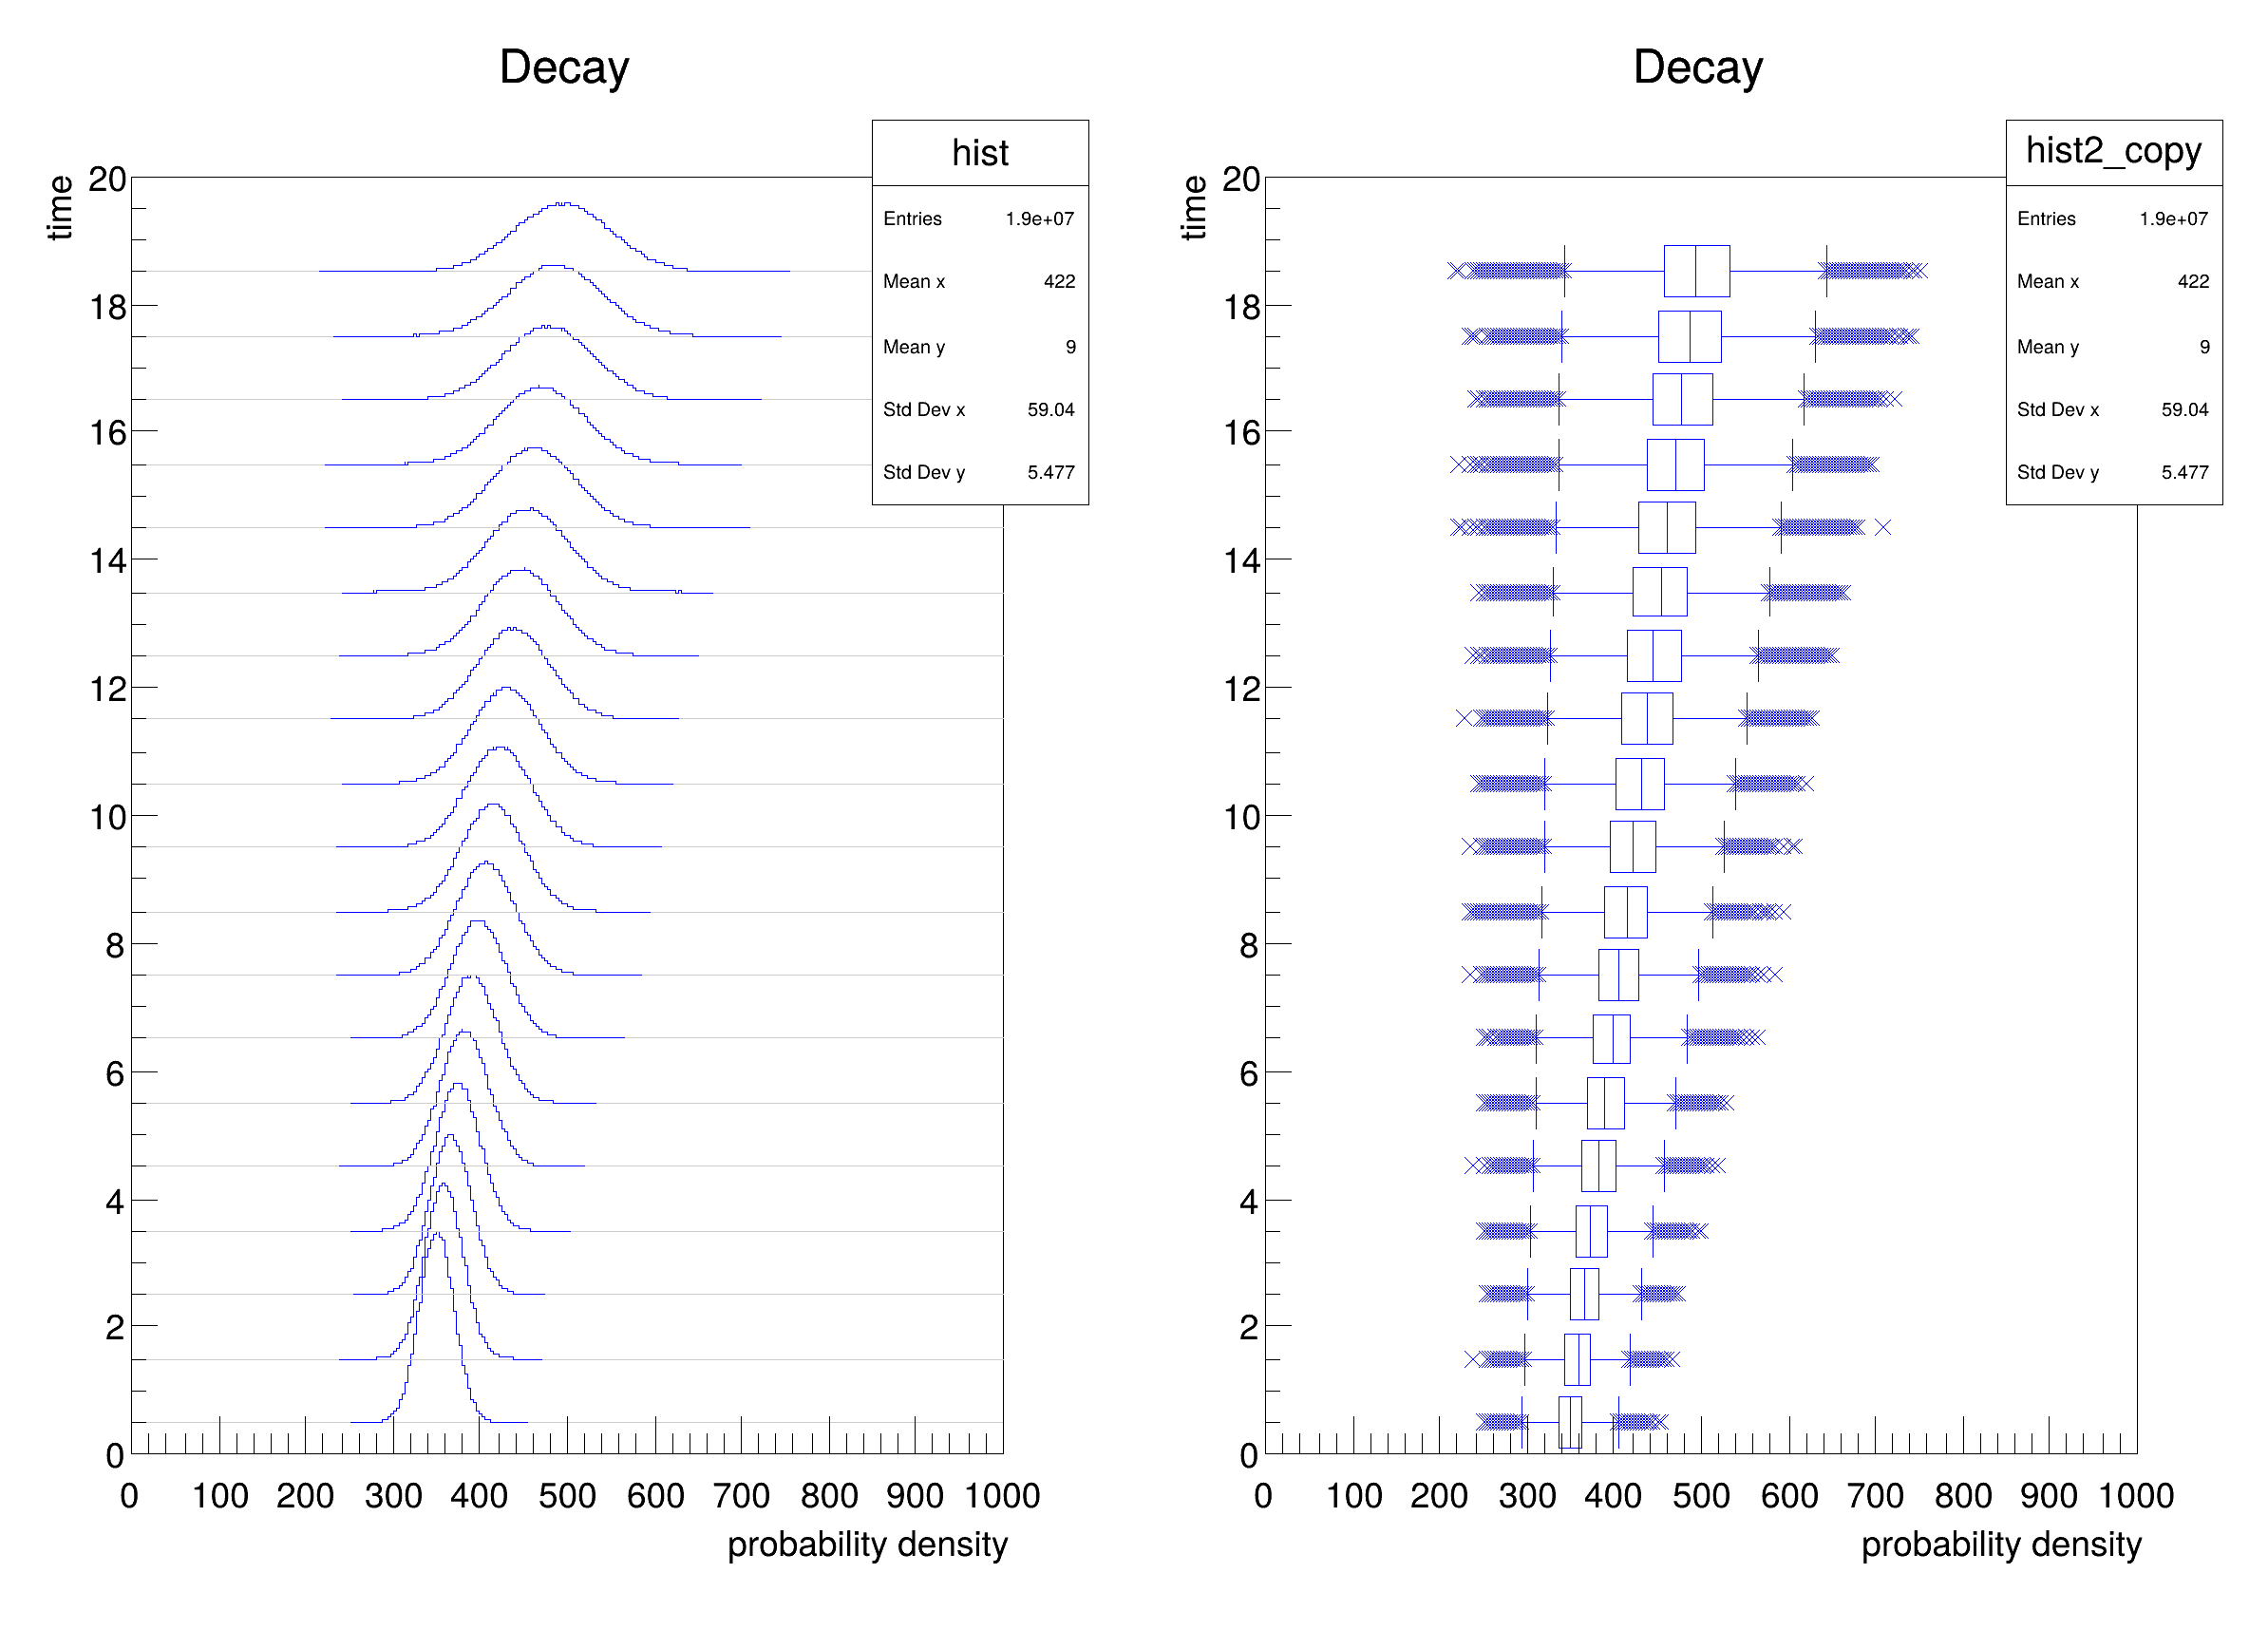 Candle Decay, illustrate a time development of a certain value. Candle Decay, illustrate a time development of a certain value. | |
| hist048_Graphics_candle_hist.C | |
 Example showing how to combine the various candle plot options. Example showing how to combine the various candle plot options. | |
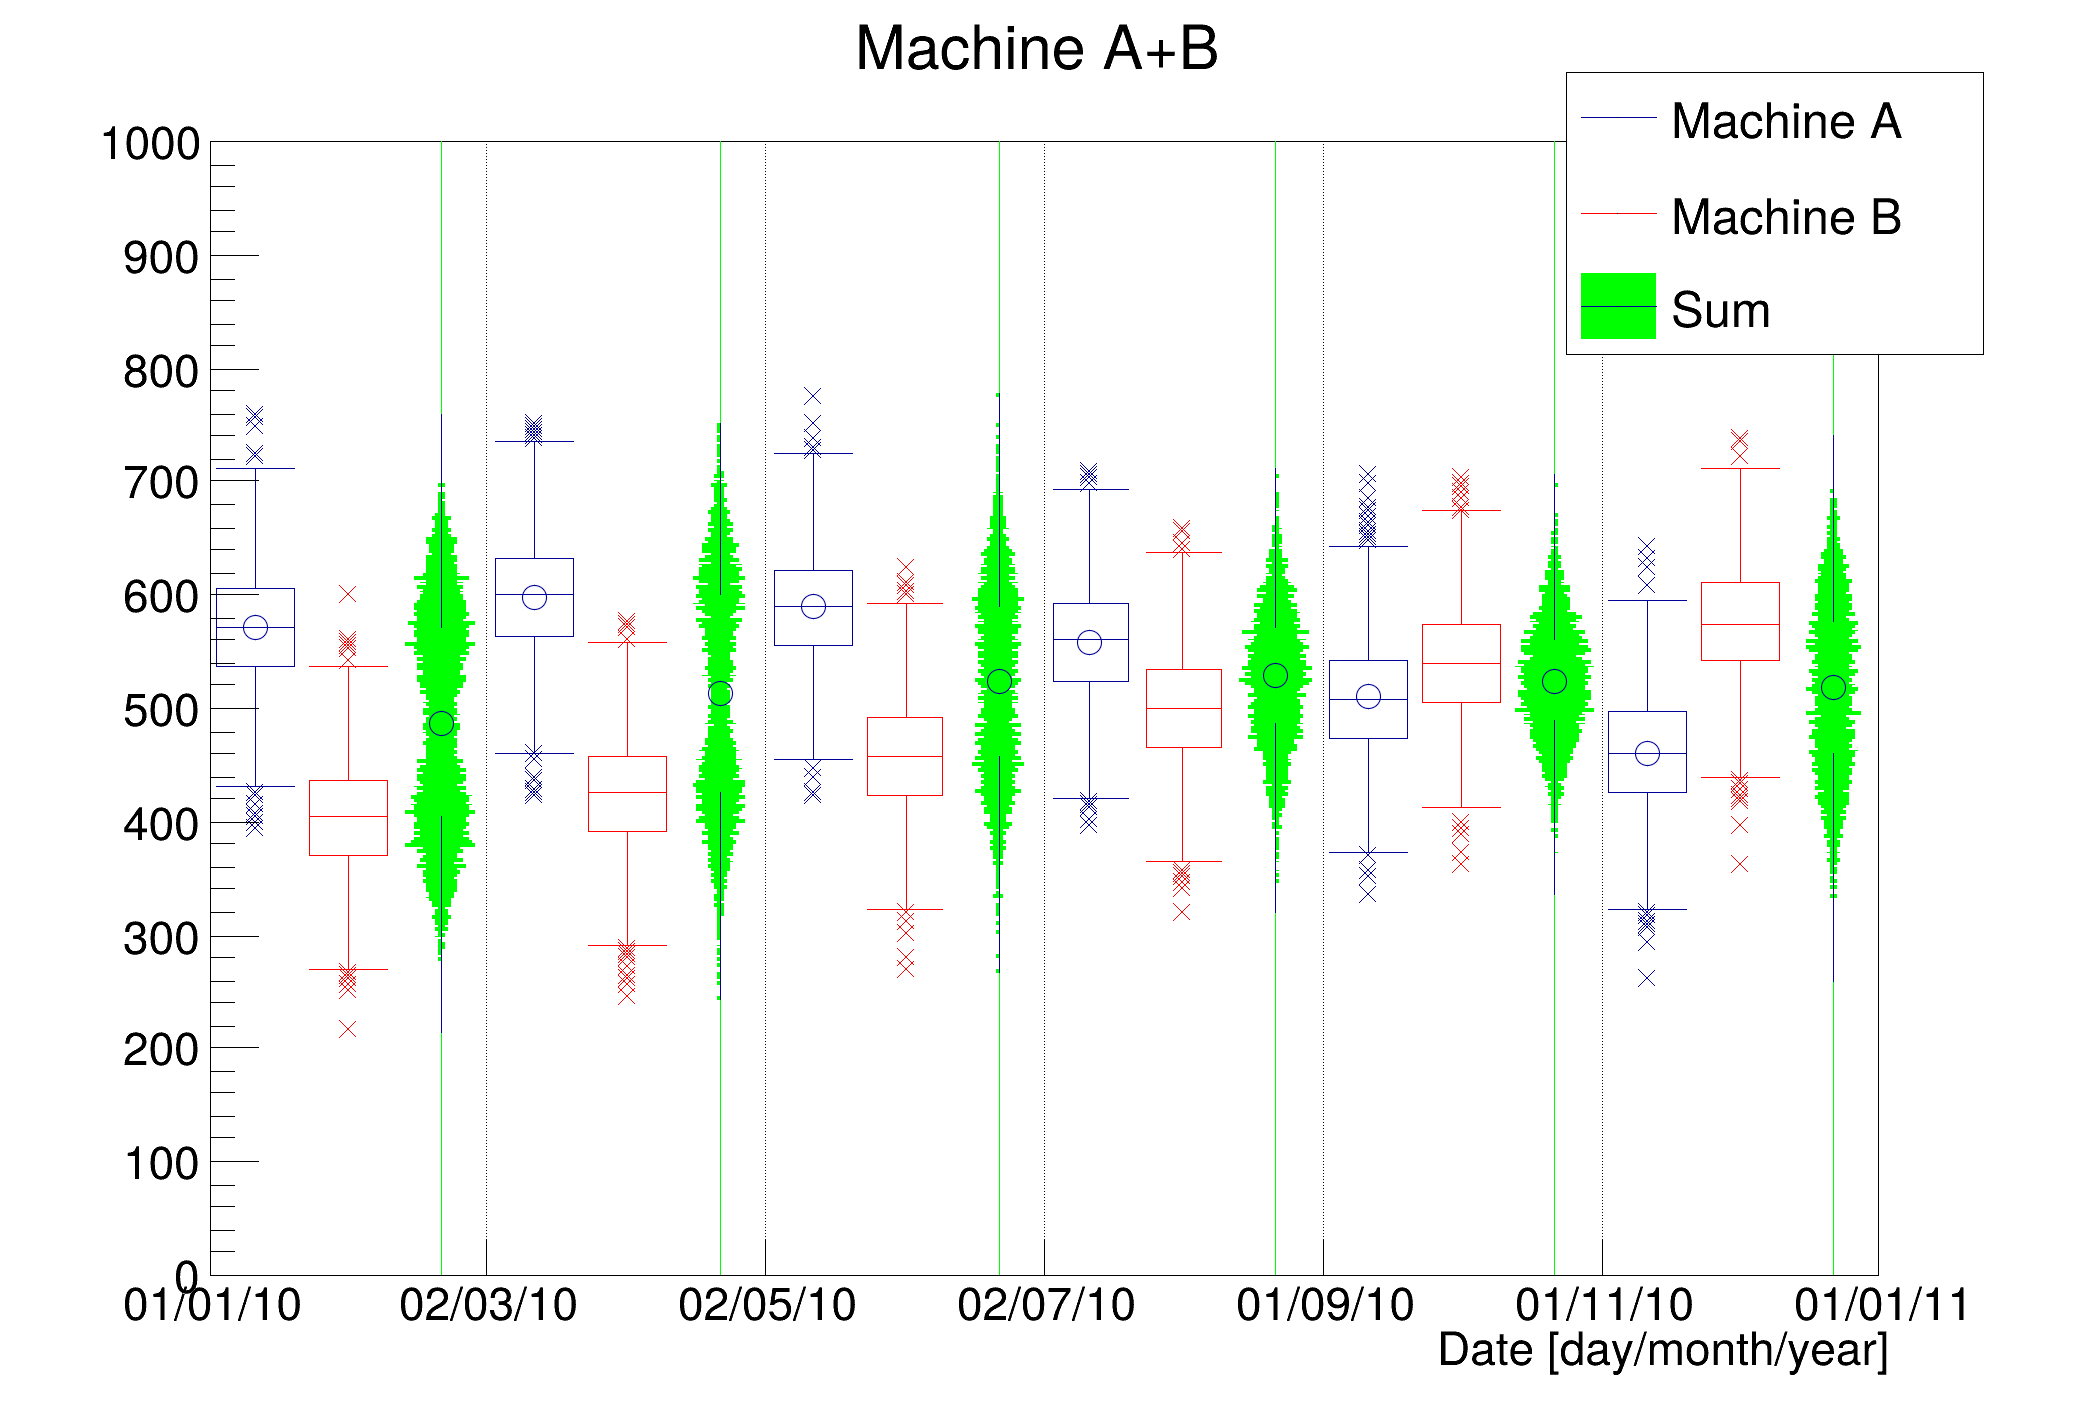
| hist049_Graphics_candle_plot.C | |
 Example of candle plot with 2-D histograms. Example of candle plot with 2-D histograms. | |
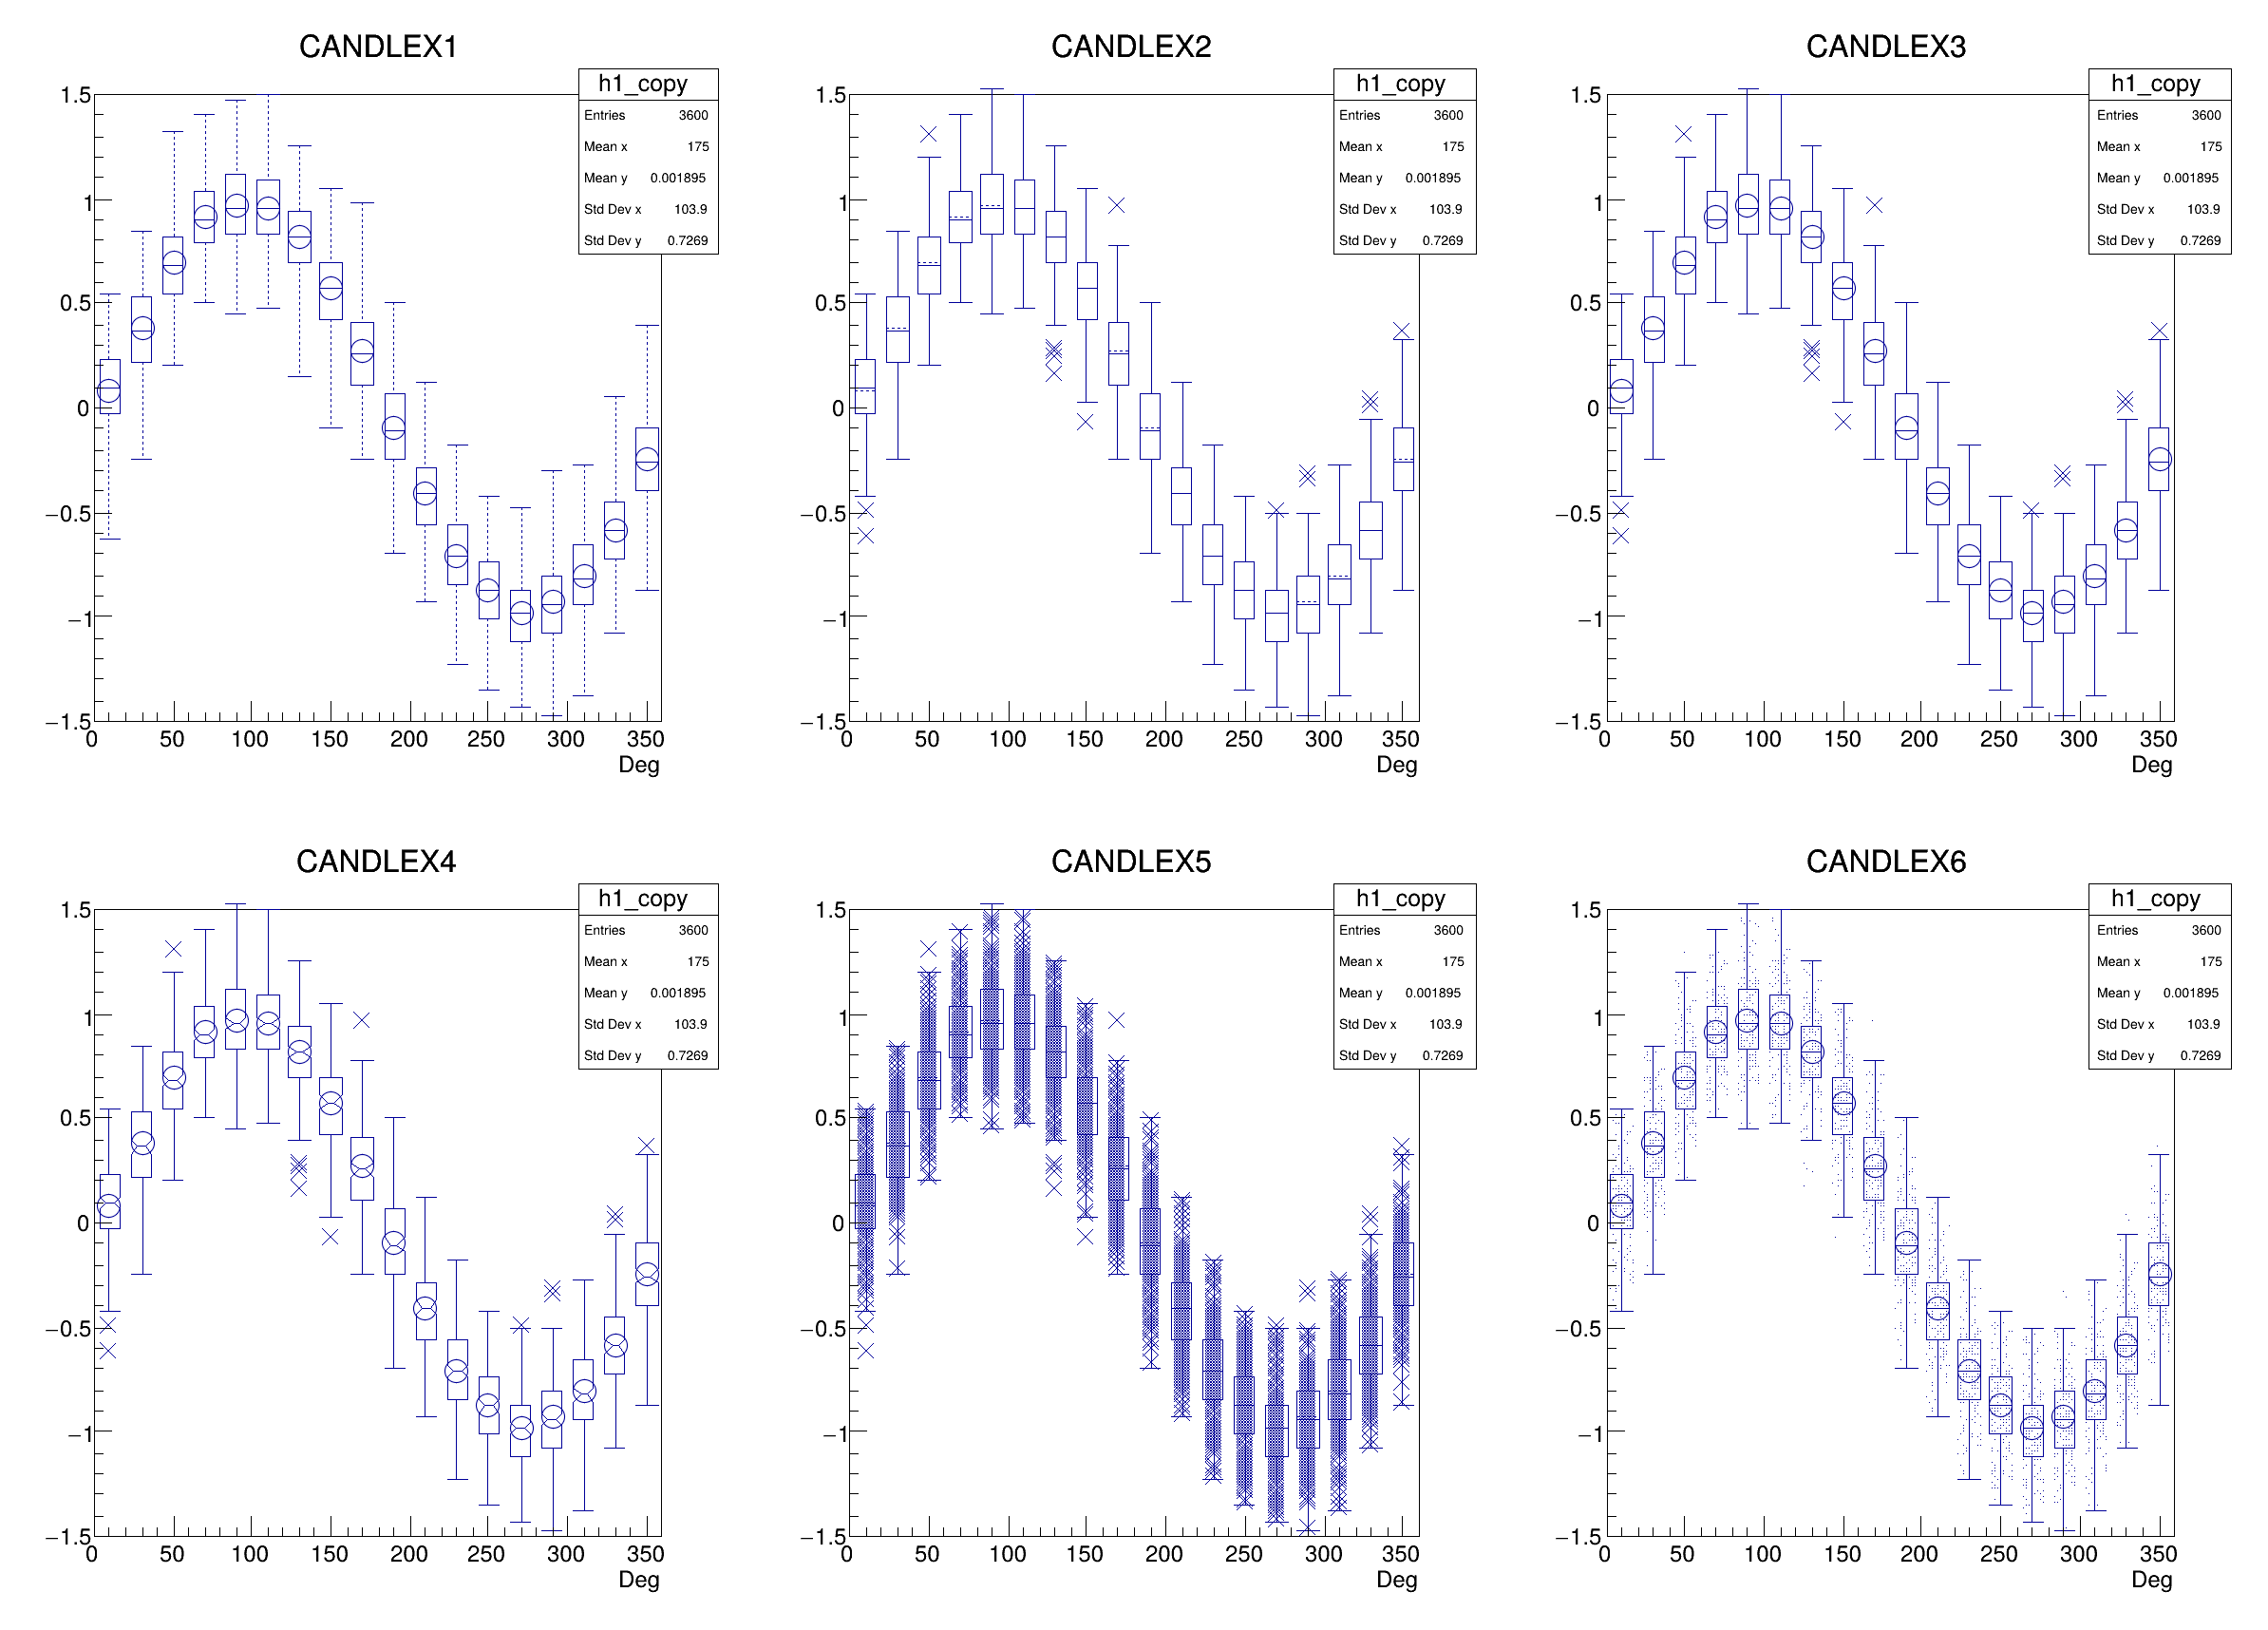
| hist050_Graphics_candle_plot_options.C | |
 Example showing how to combine the various candle plot options. Example showing how to combine the various candle plot options. | |
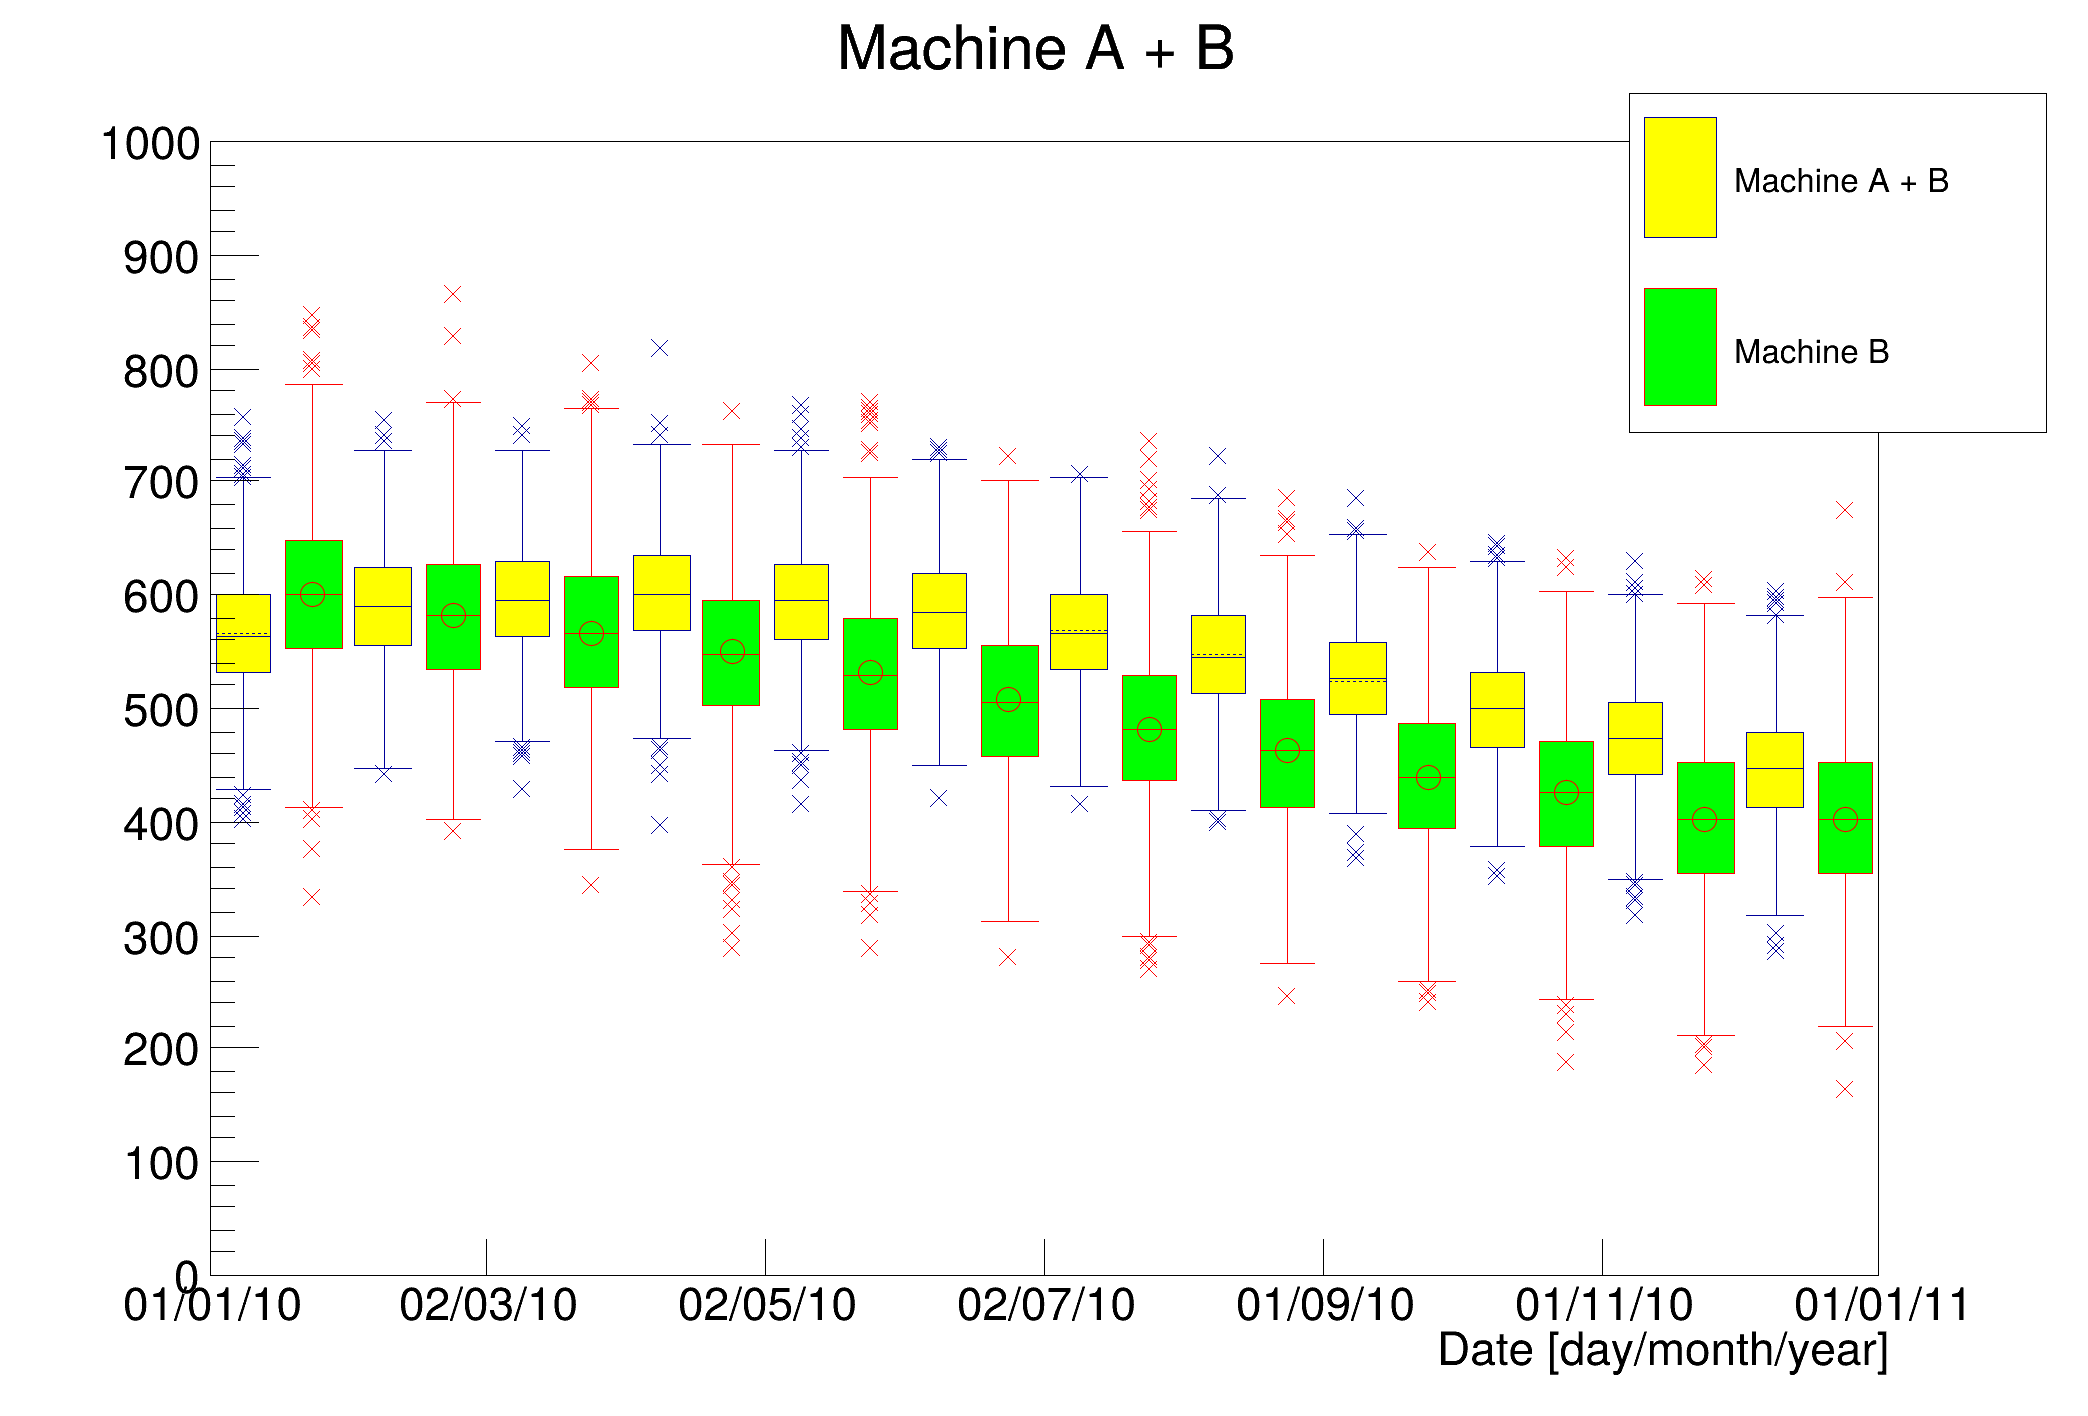
| hist051_Graphics_candle_plot_stack.C | |
 Example showing how a THStack with candle plot option. Example showing how a THStack with candle plot option. | |
| hist052_Graphics_candle_plot_whiskers.C | |
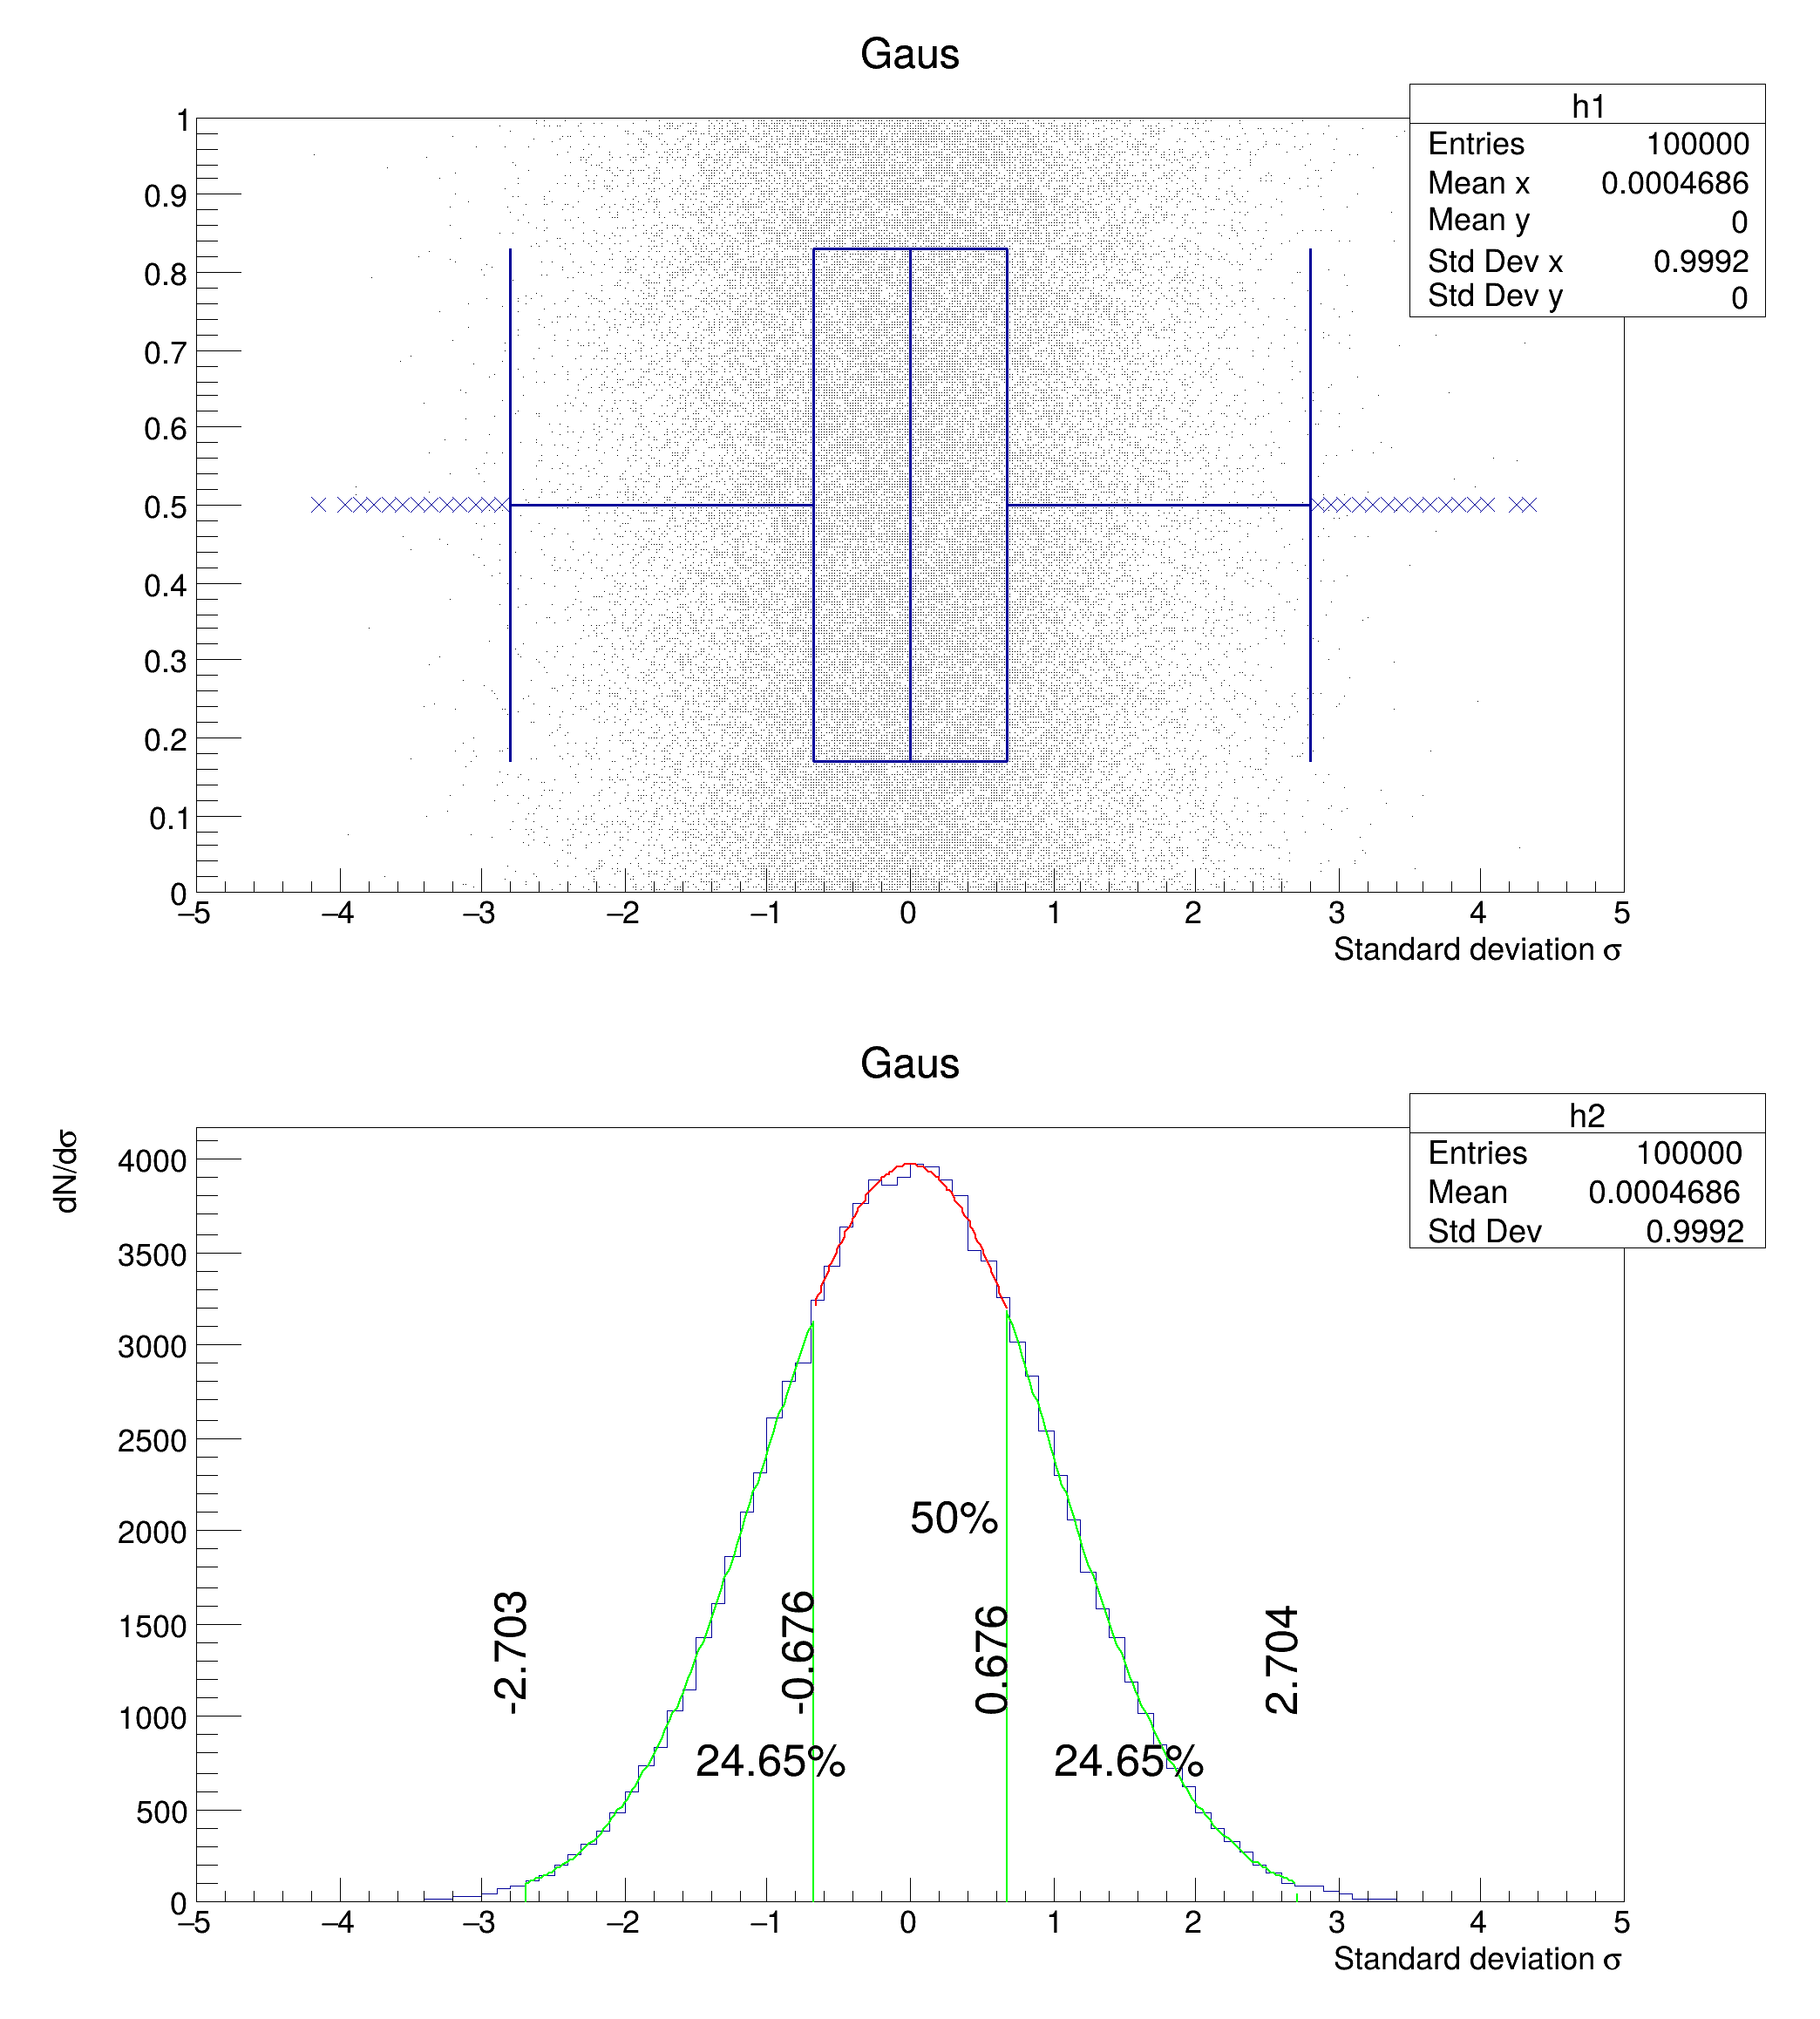 Example of candle plot showing the whiskers definition. Example of candle plot showing the whiskers definition. | |
| hist053_Graphics_candle_scaled.C | |
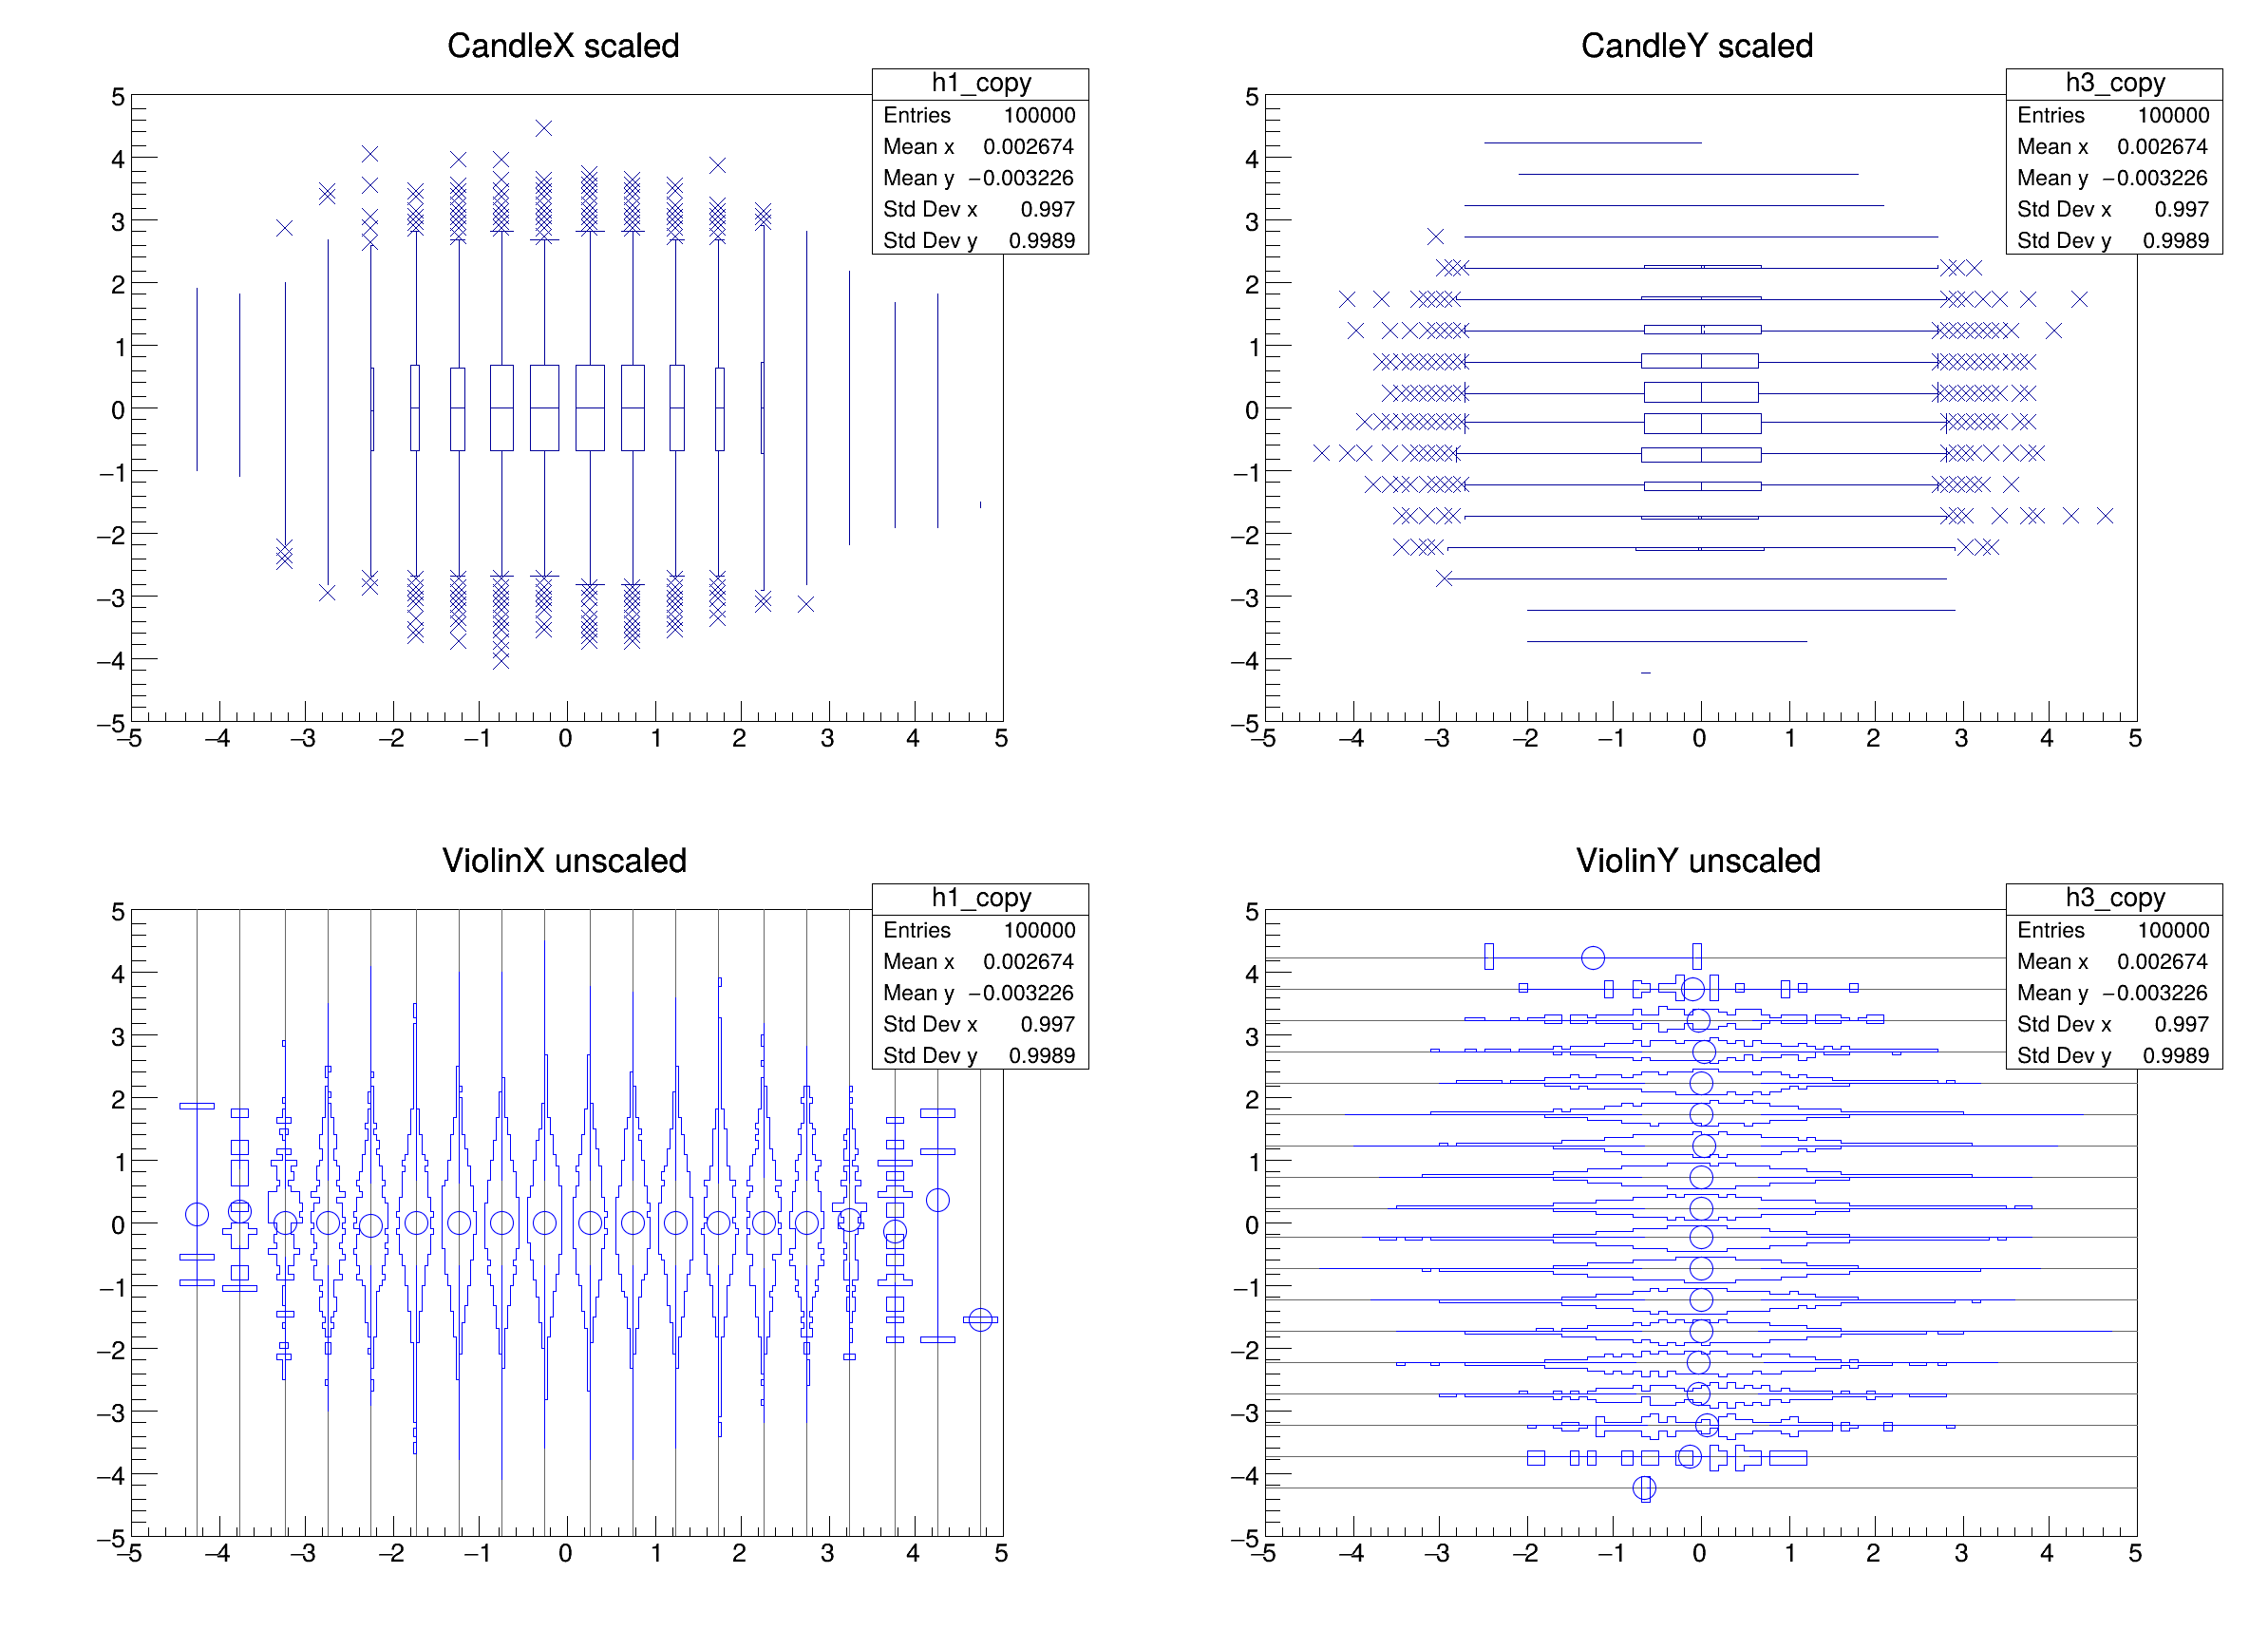 Candle Scaled, illustrates what scaling does on candle and violin charts. Candle Scaled, illustrates what scaling does on candle and violin charts. | |
| hist056_TPolyMarker_contour.C | |
| Make a contour plot and get the first contour in a TPolyMarker. | |
| hist057_TExec_th1.C | |
| Echo object at mouse position. | |
| hist058_TExec_th2.C | |
| Echo object at mouse position and show a graphics line. | |
| hist060_TH1_stats.C | |
 Edit statistics box. Edit statistics box. | |
| hist061_TH1_timeonaxis.C | |
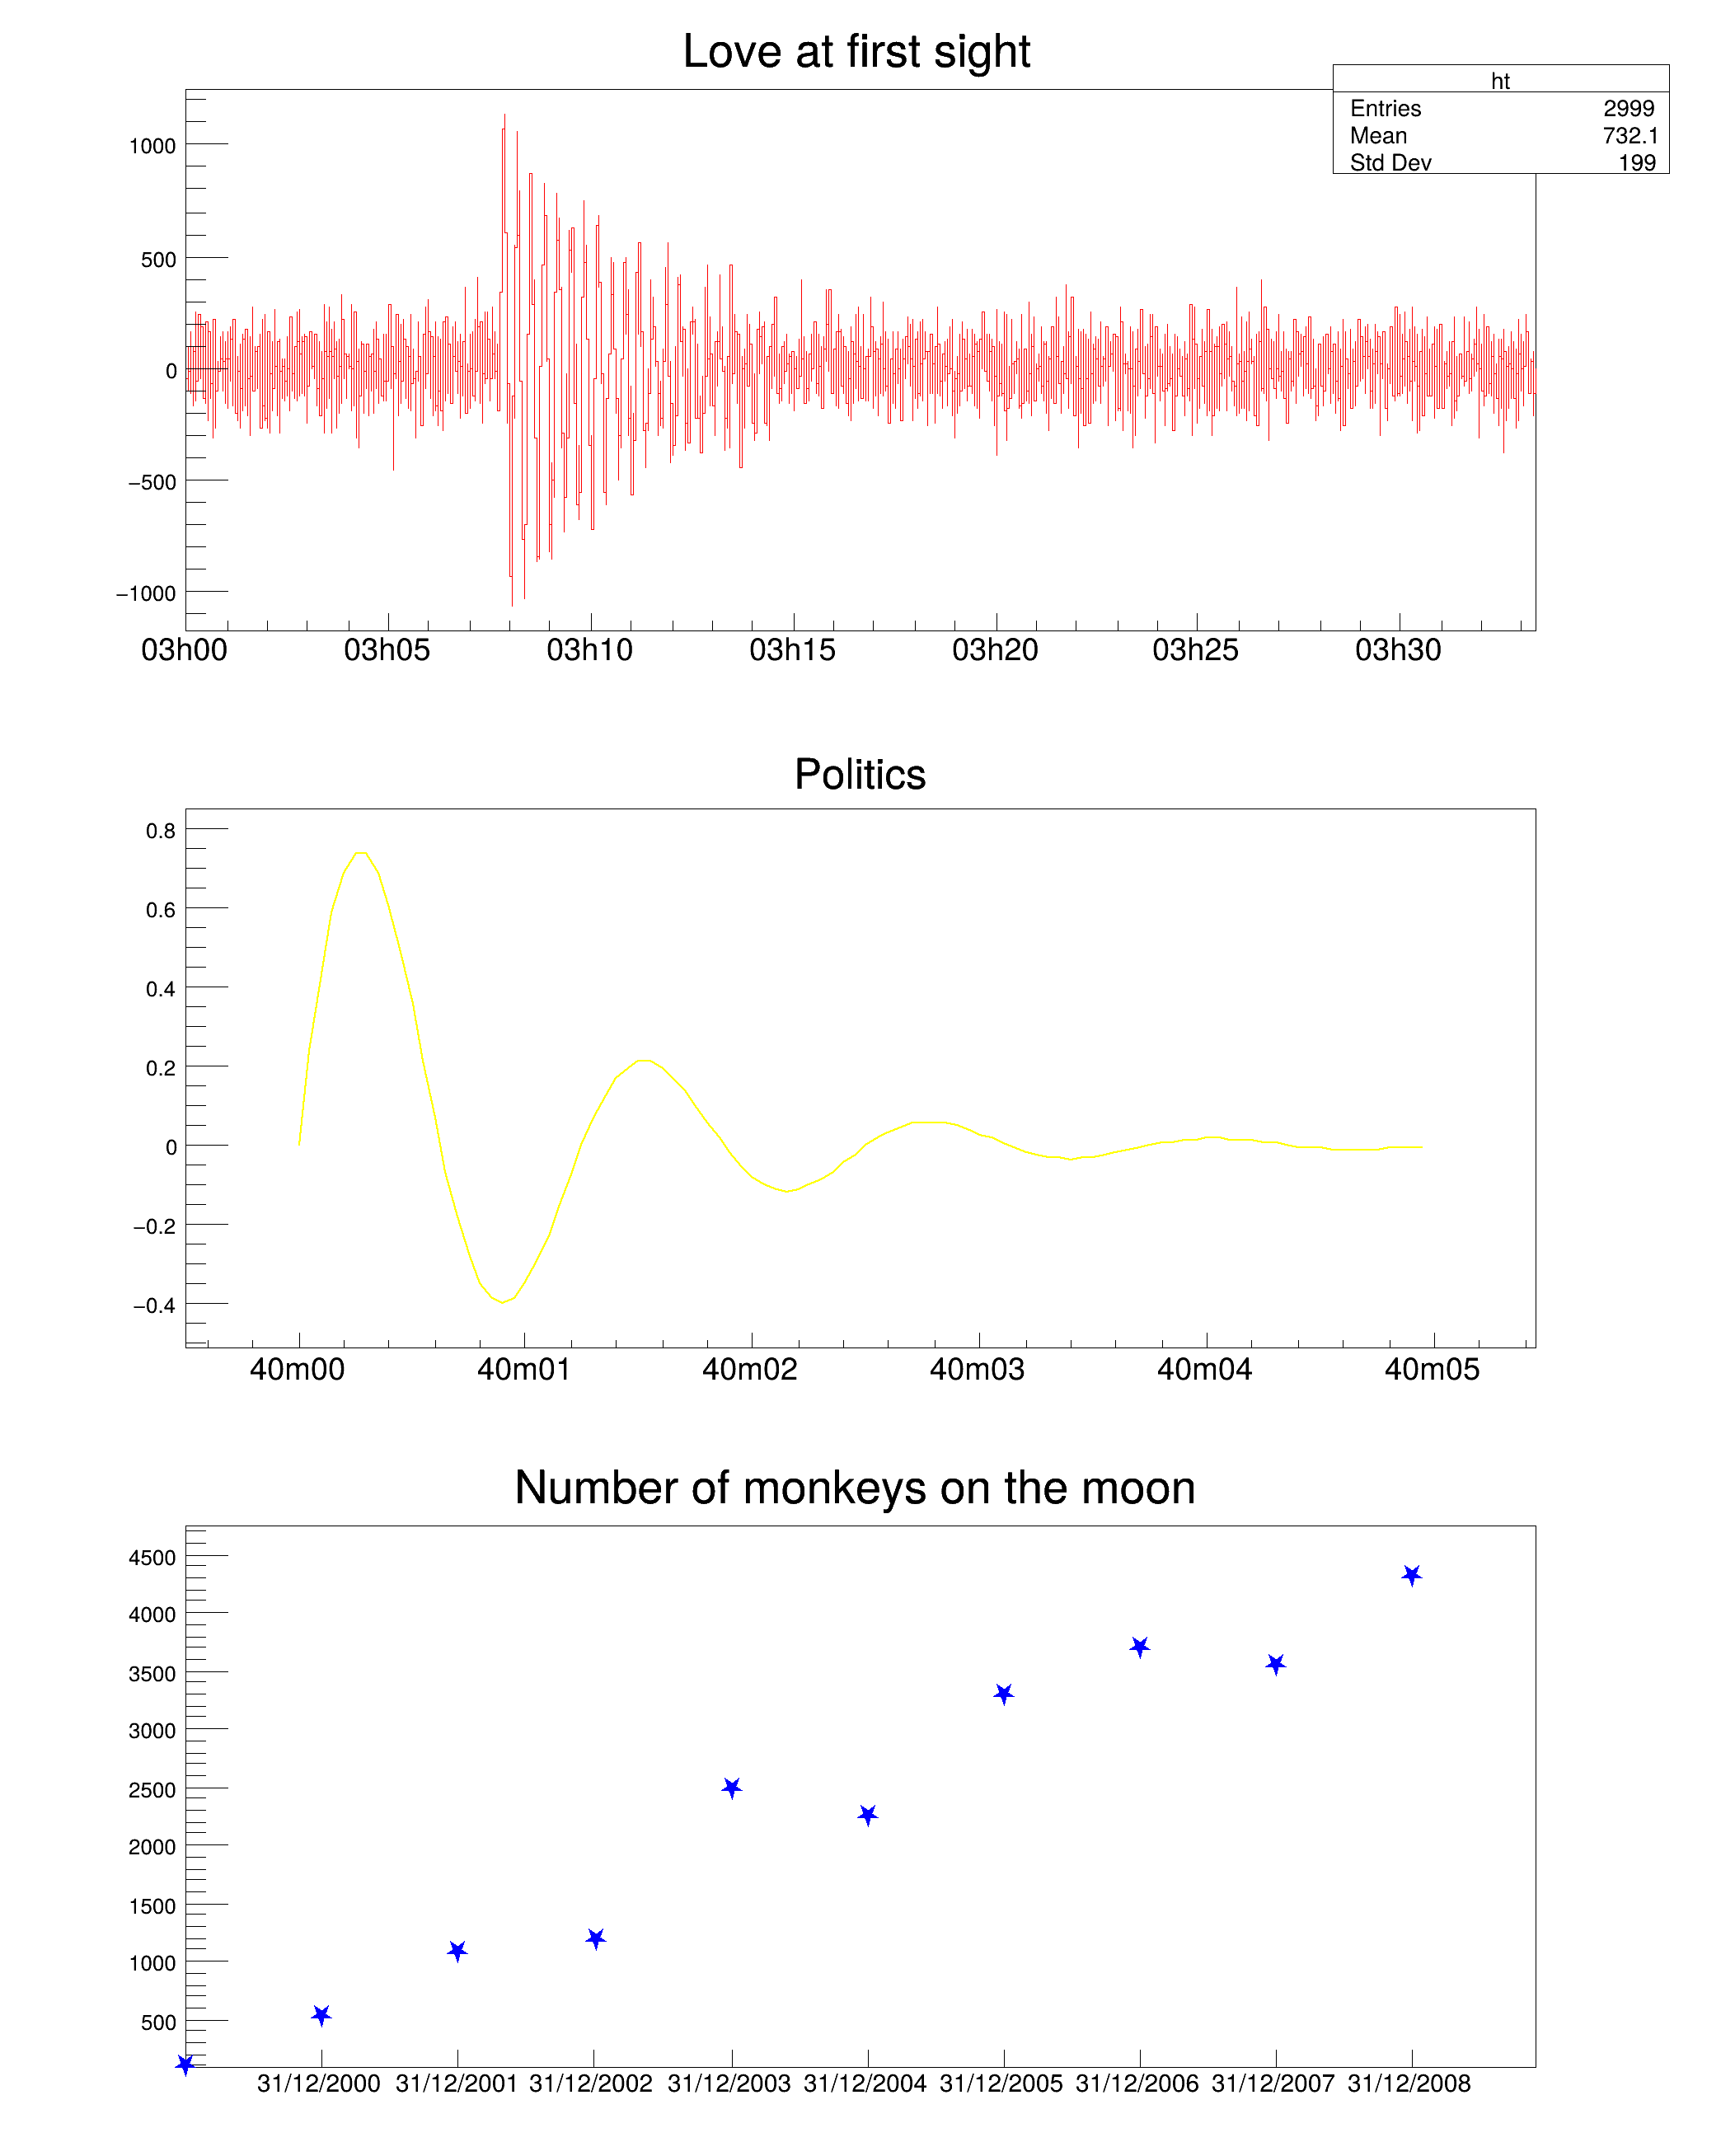 This macro illustrates the use of the time mode on the axis with different time intervals and time formats. This macro illustrates the use of the time mode on the axis with different time intervals and time formats. | |
| hist062_TH1_timeonaxis2.C | |
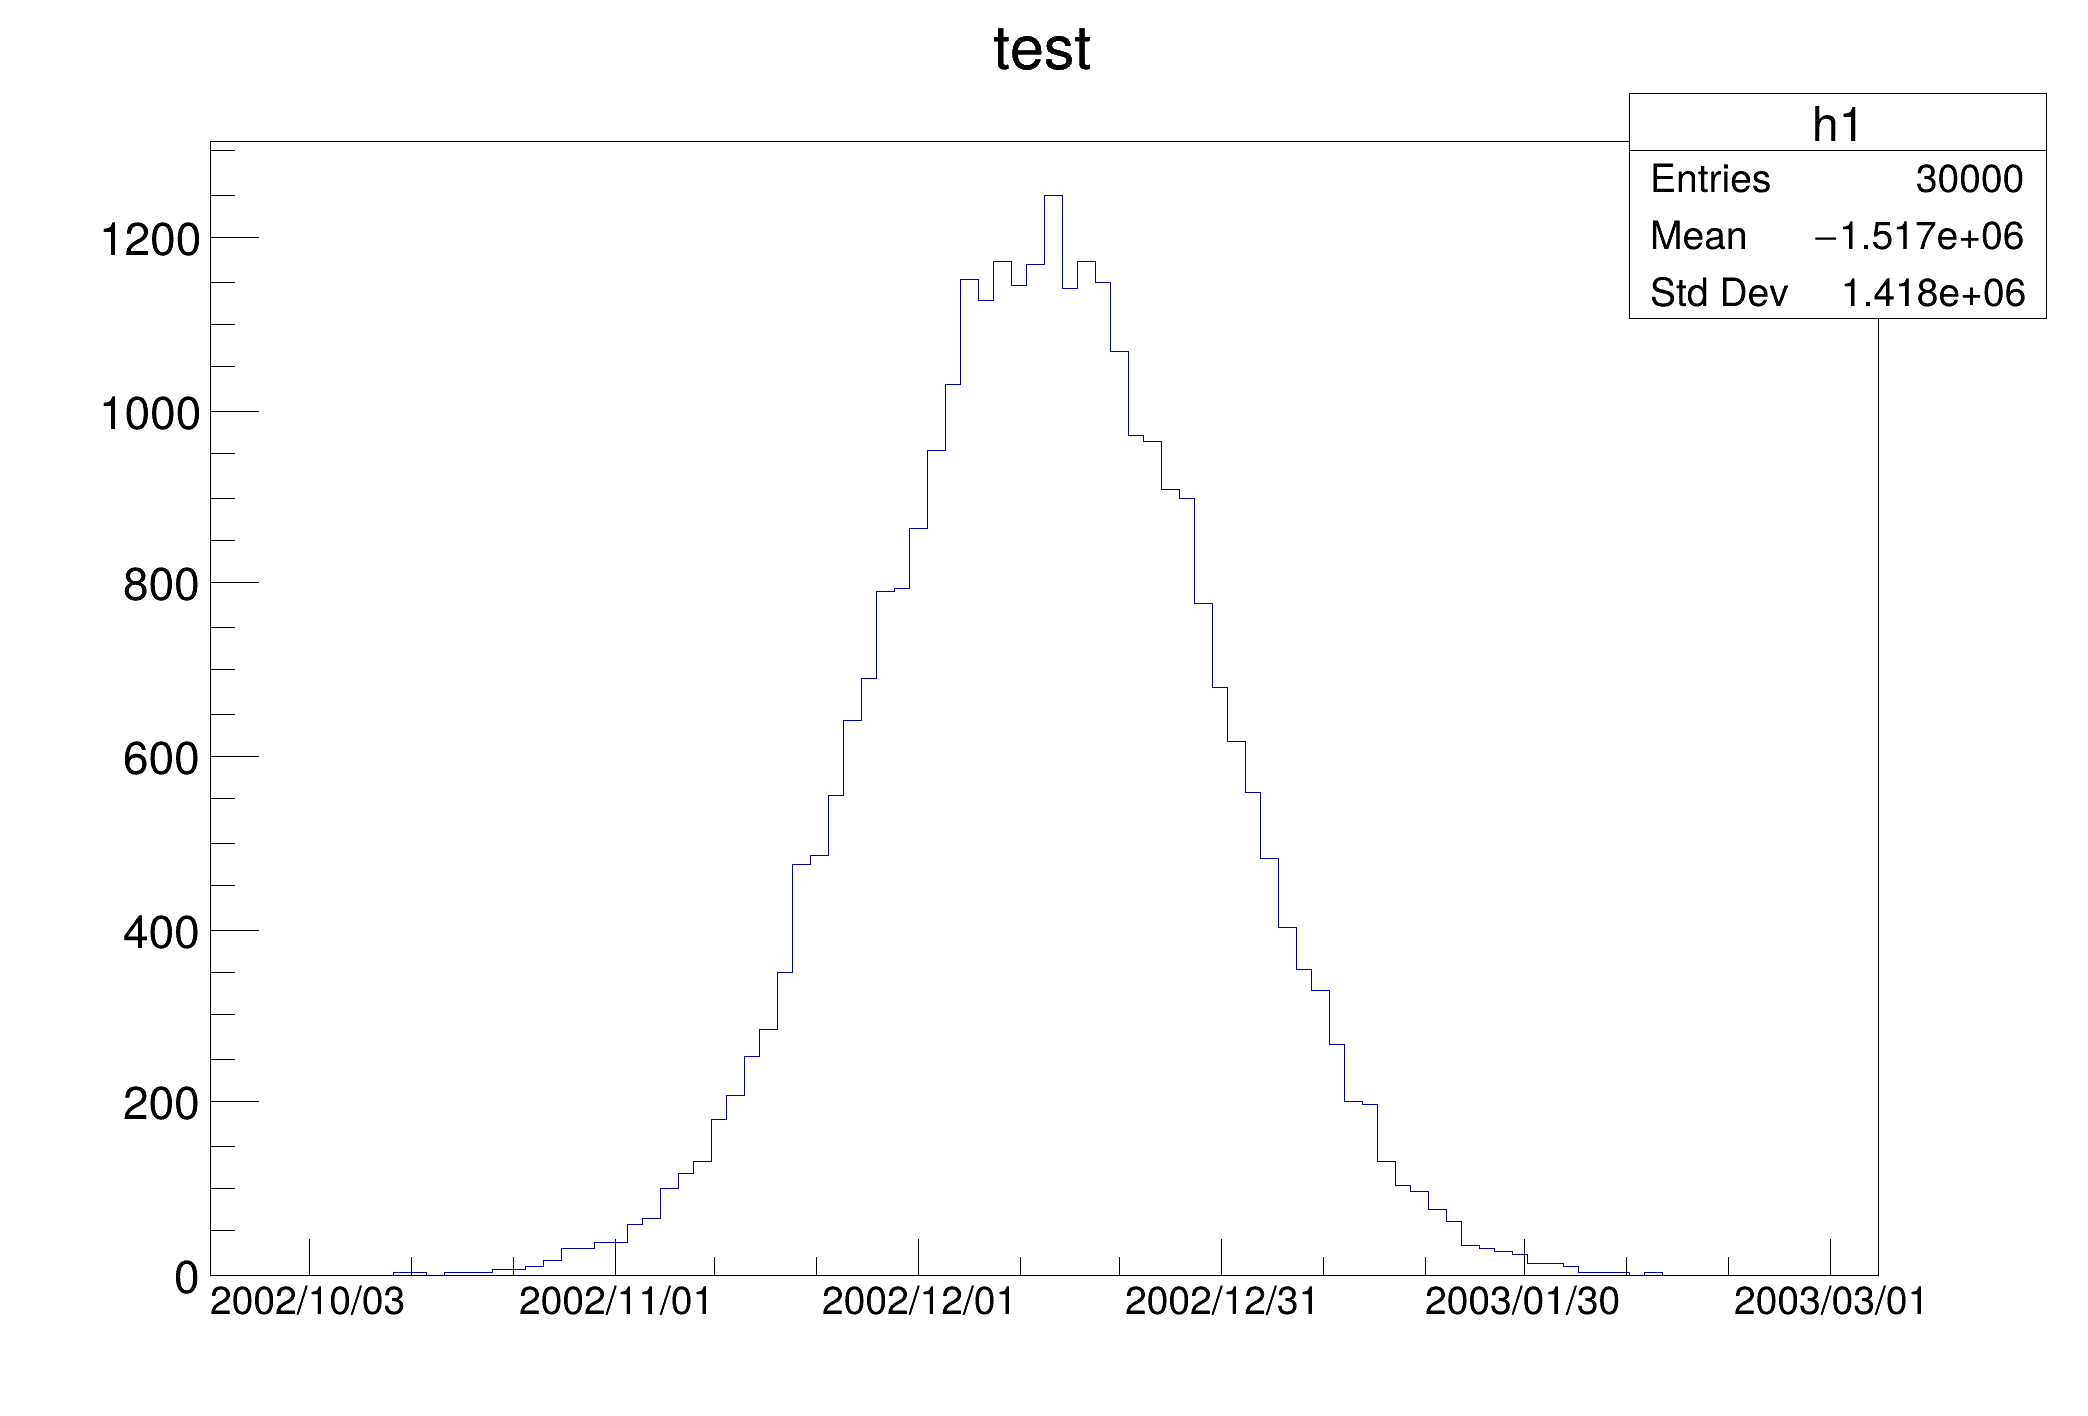 Define the time offset as 2003, January 1st. Define the time offset as 2003, January 1st. | |
| hist063_TH1_seism.C | |
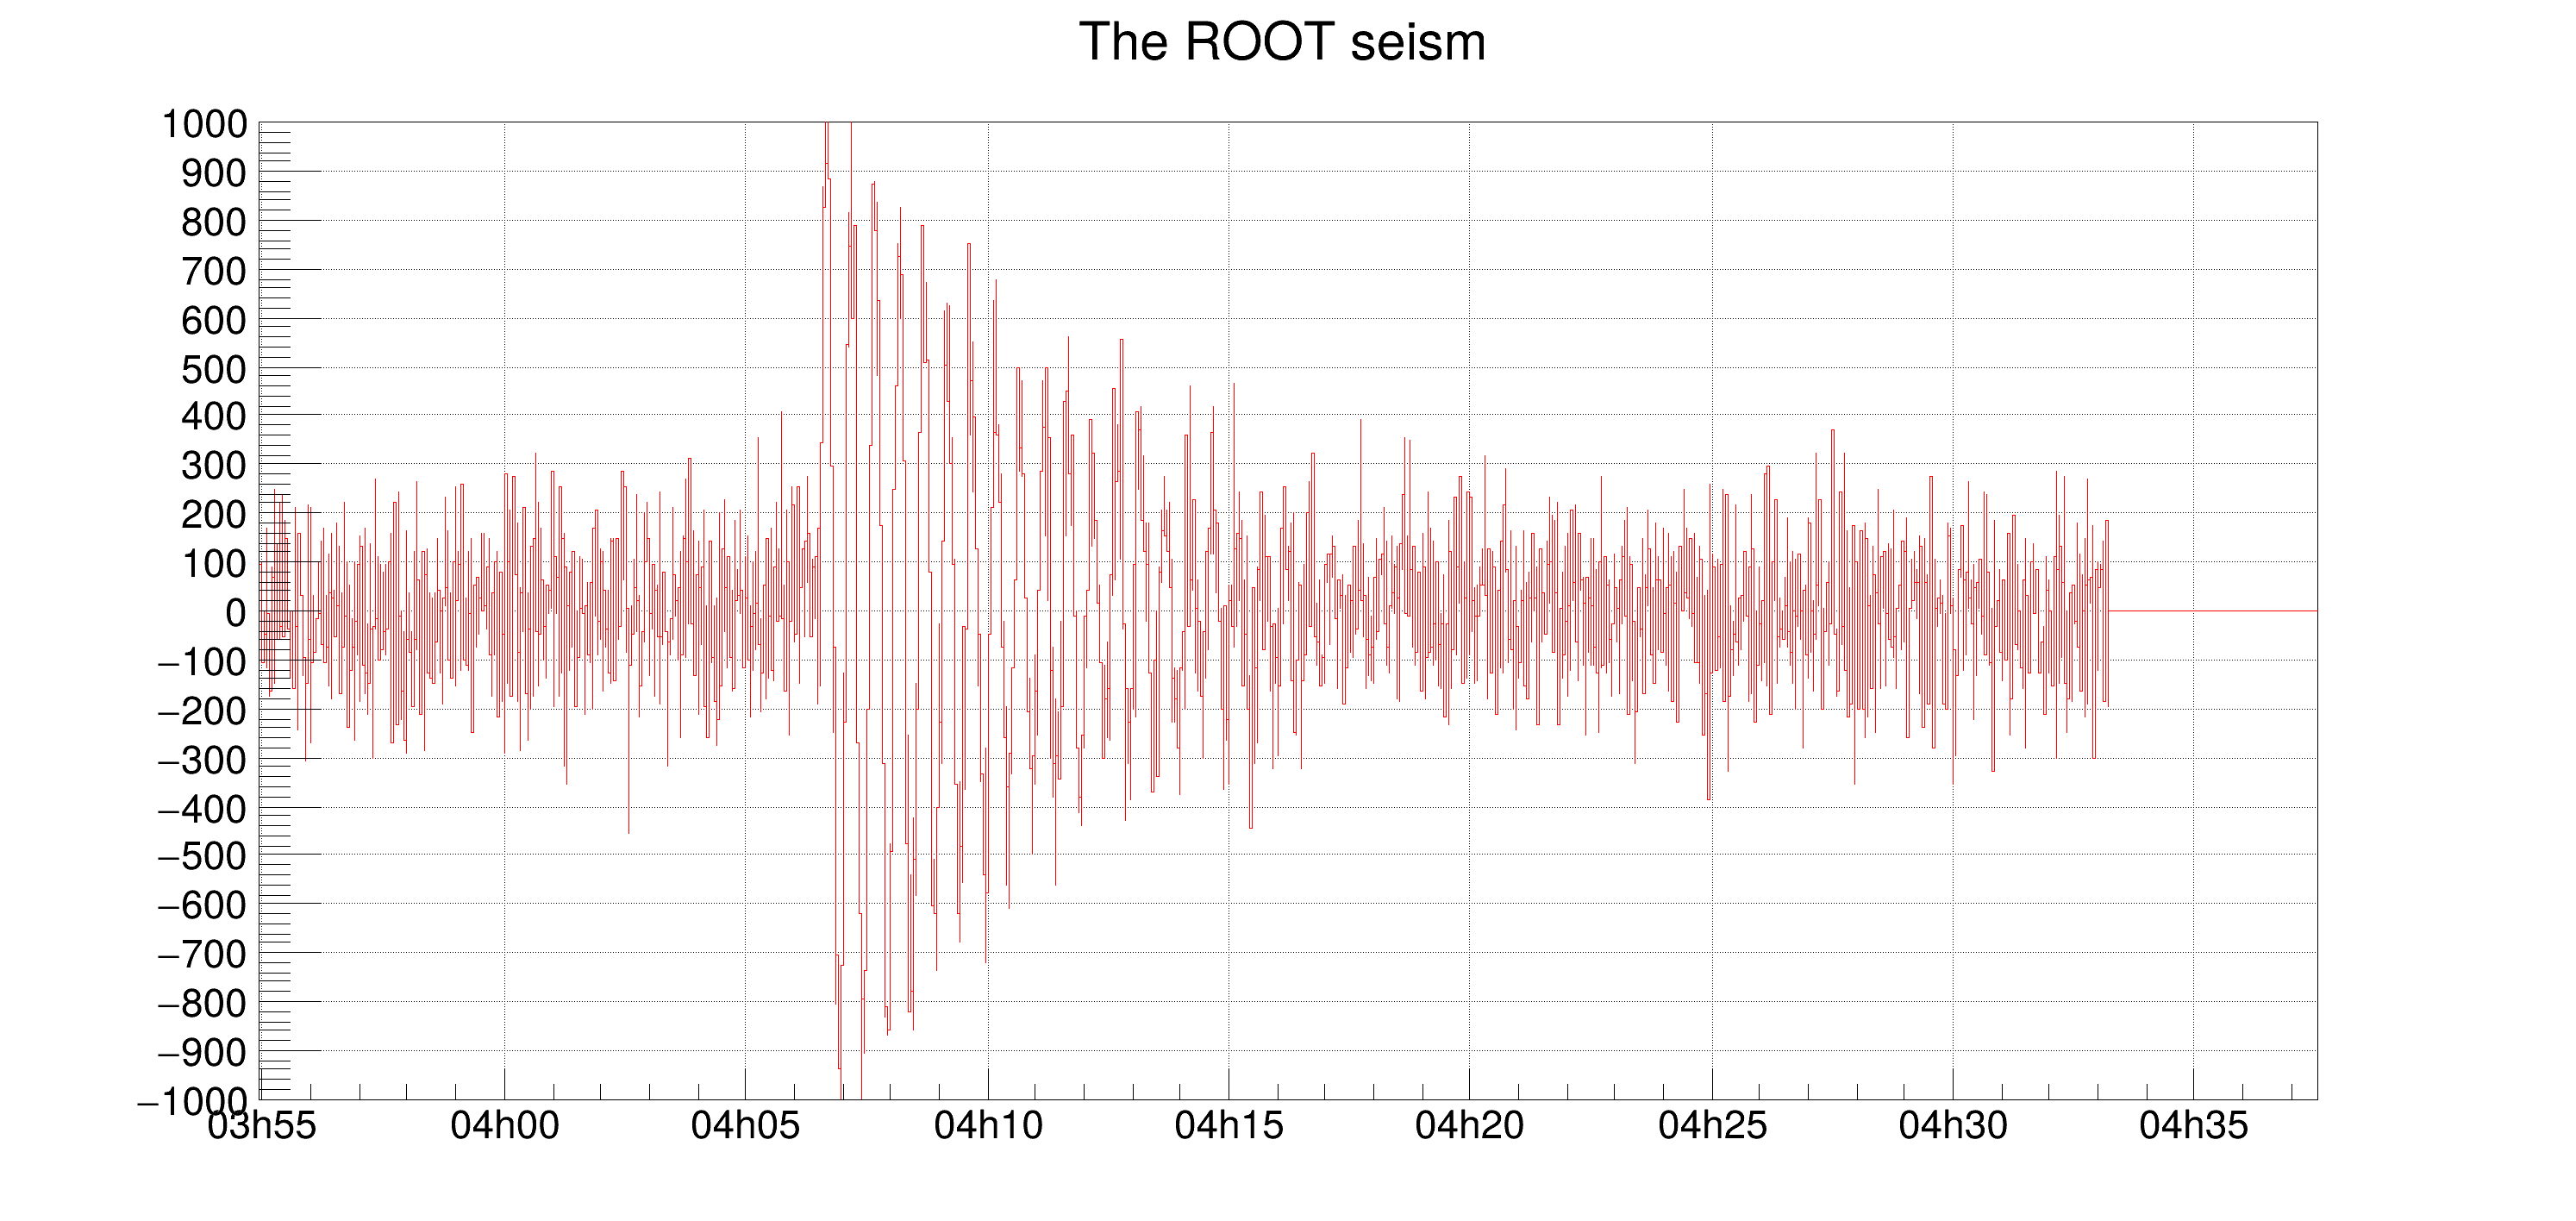 Strip chart example. Strip chart example. | |
| hist101_TH1_autobinning.C | |
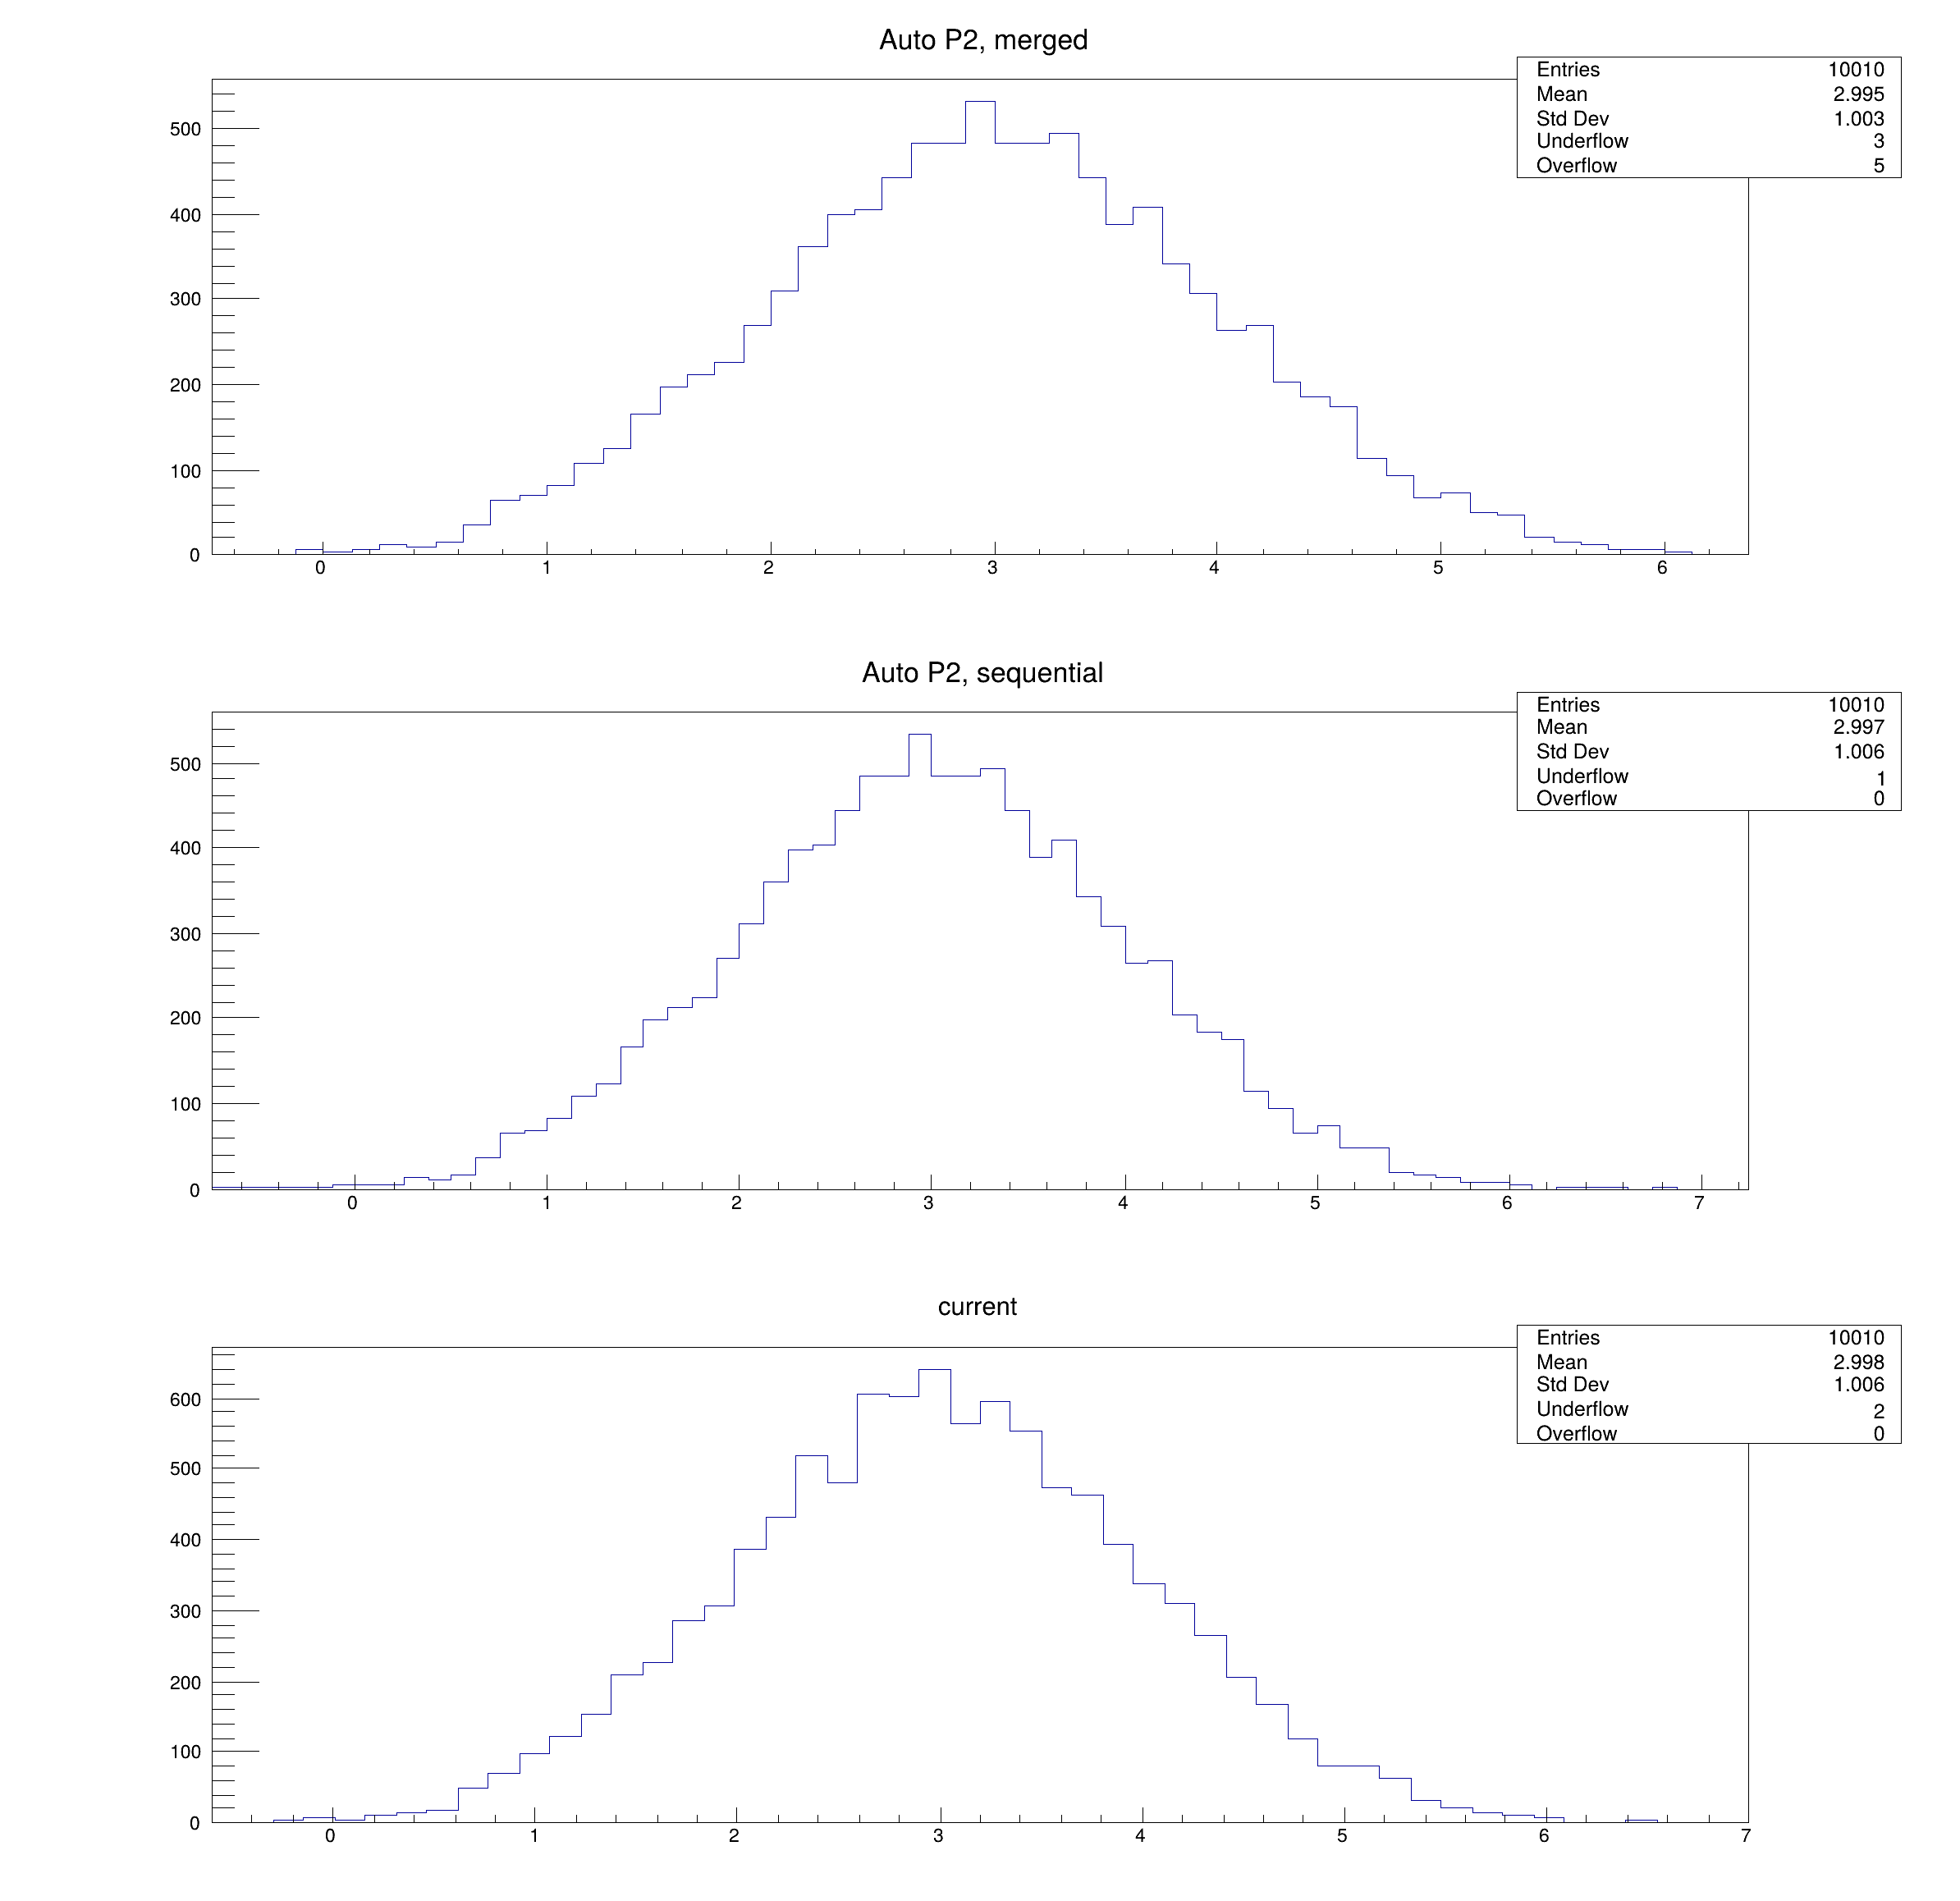 Fill multiple histograms with different functions and automatic binning. Fill multiple histograms with different functions and automatic binning. | |
| hist102_TH2_contour_list.C | |
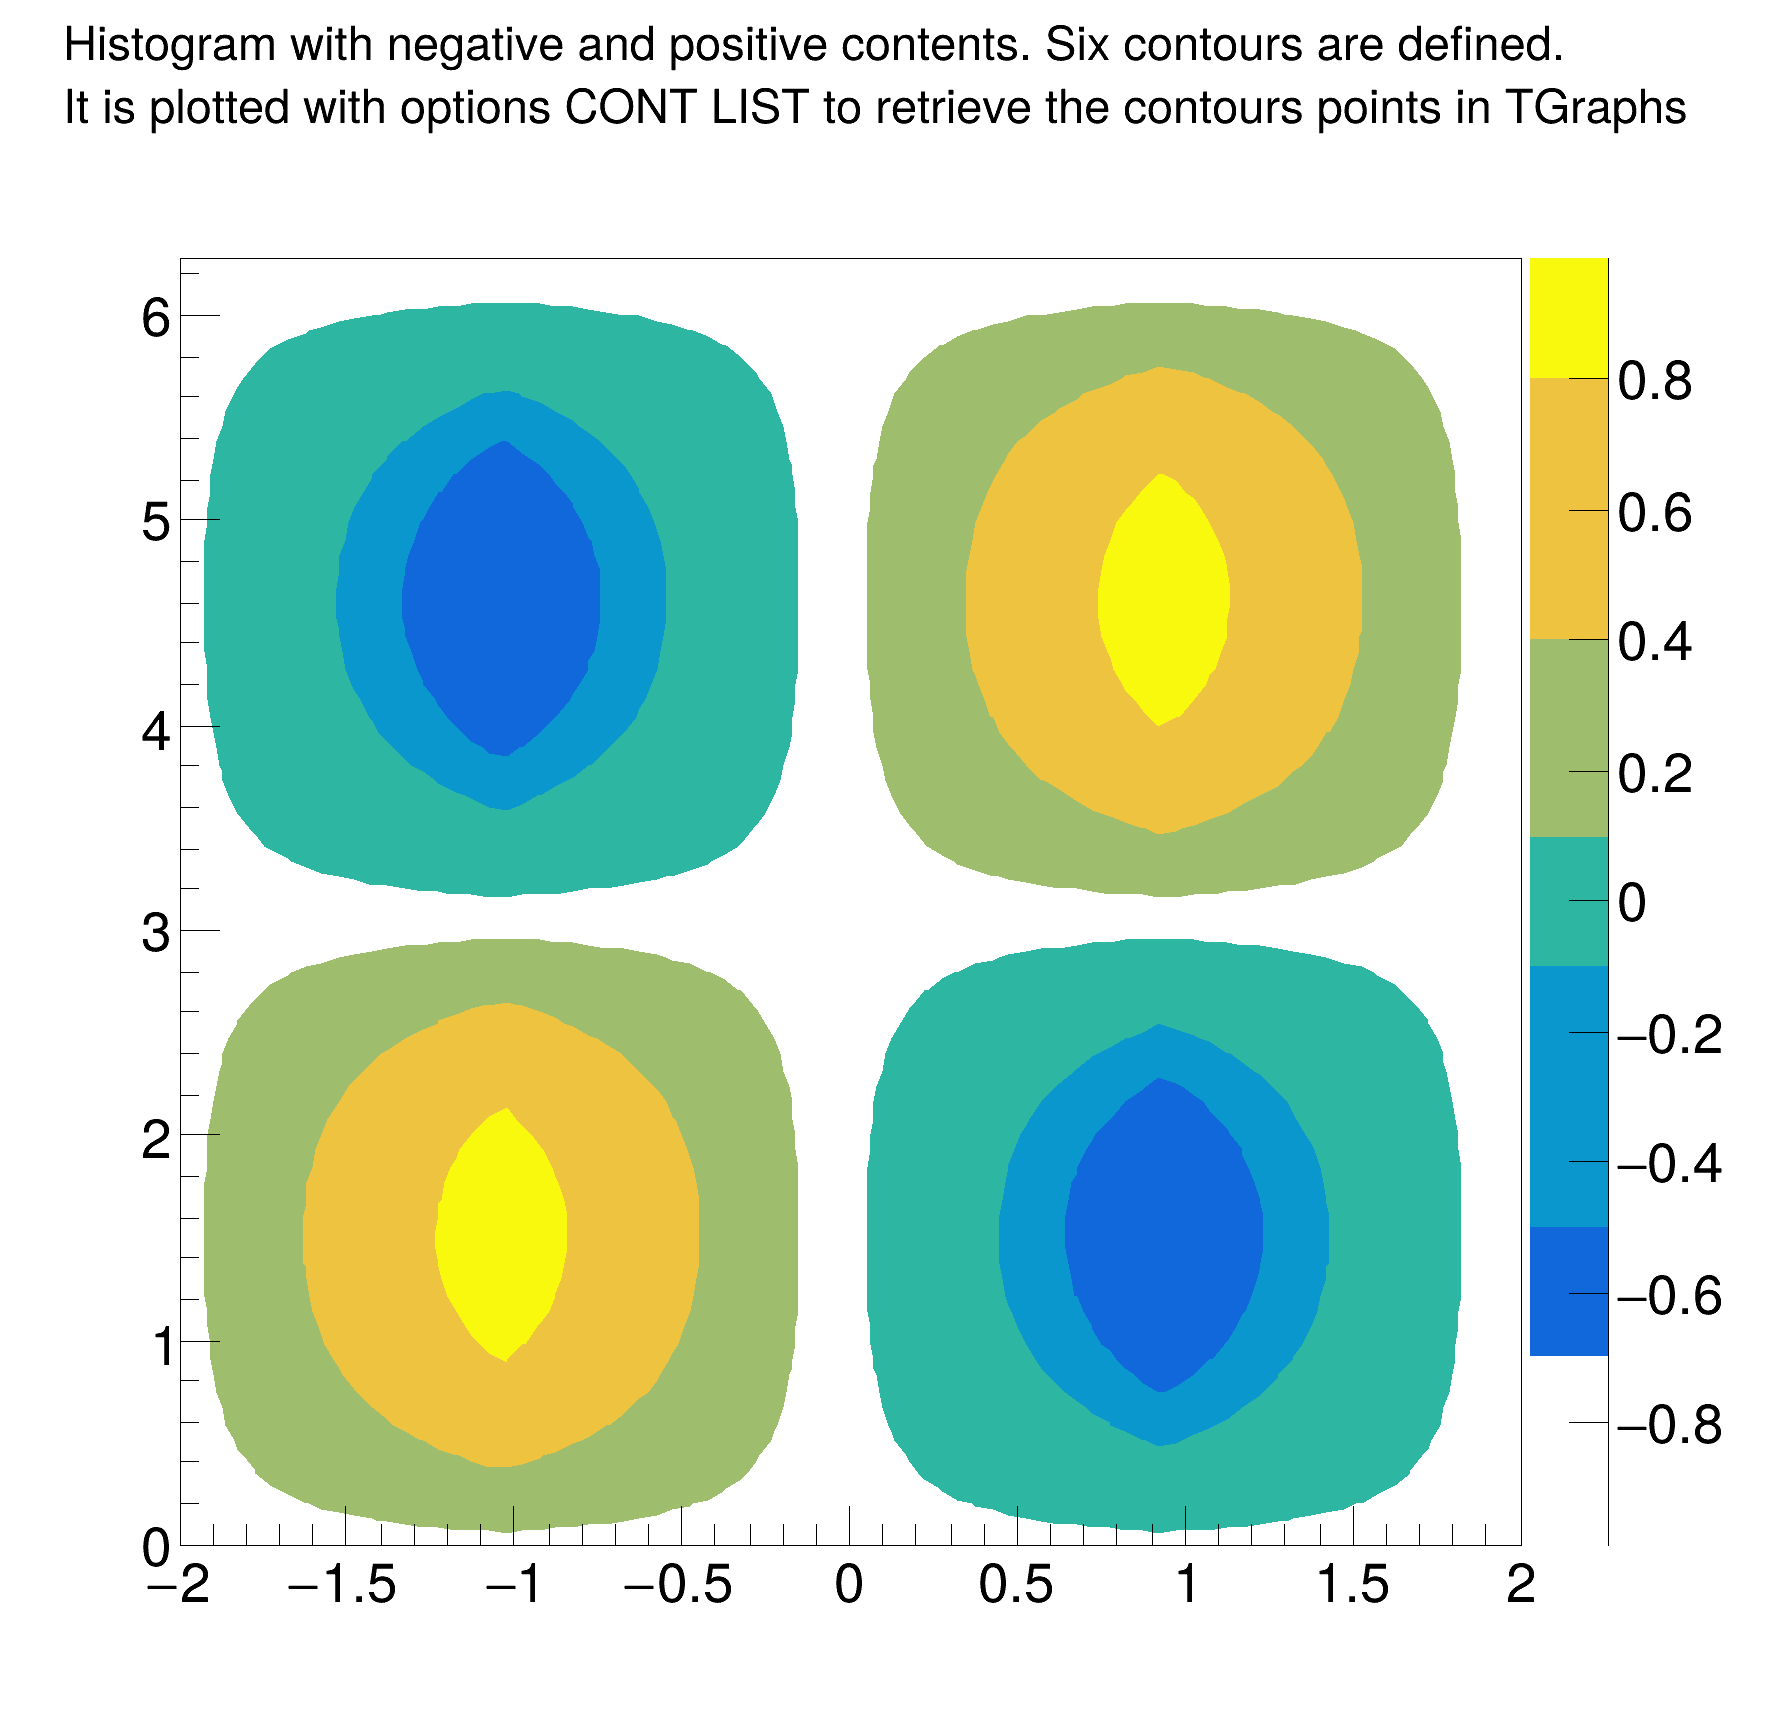 Getting Contours From TH2D. Getting Contours From TH2D. | |
| hist103_THnSparse_hist.C | |
| Evaluate the performance of THnSparse vs TH1/2/3/nF for different numbers of dimensions and bins per dimension. | |
| hist104_TH2Poly_fibonacci.C | |
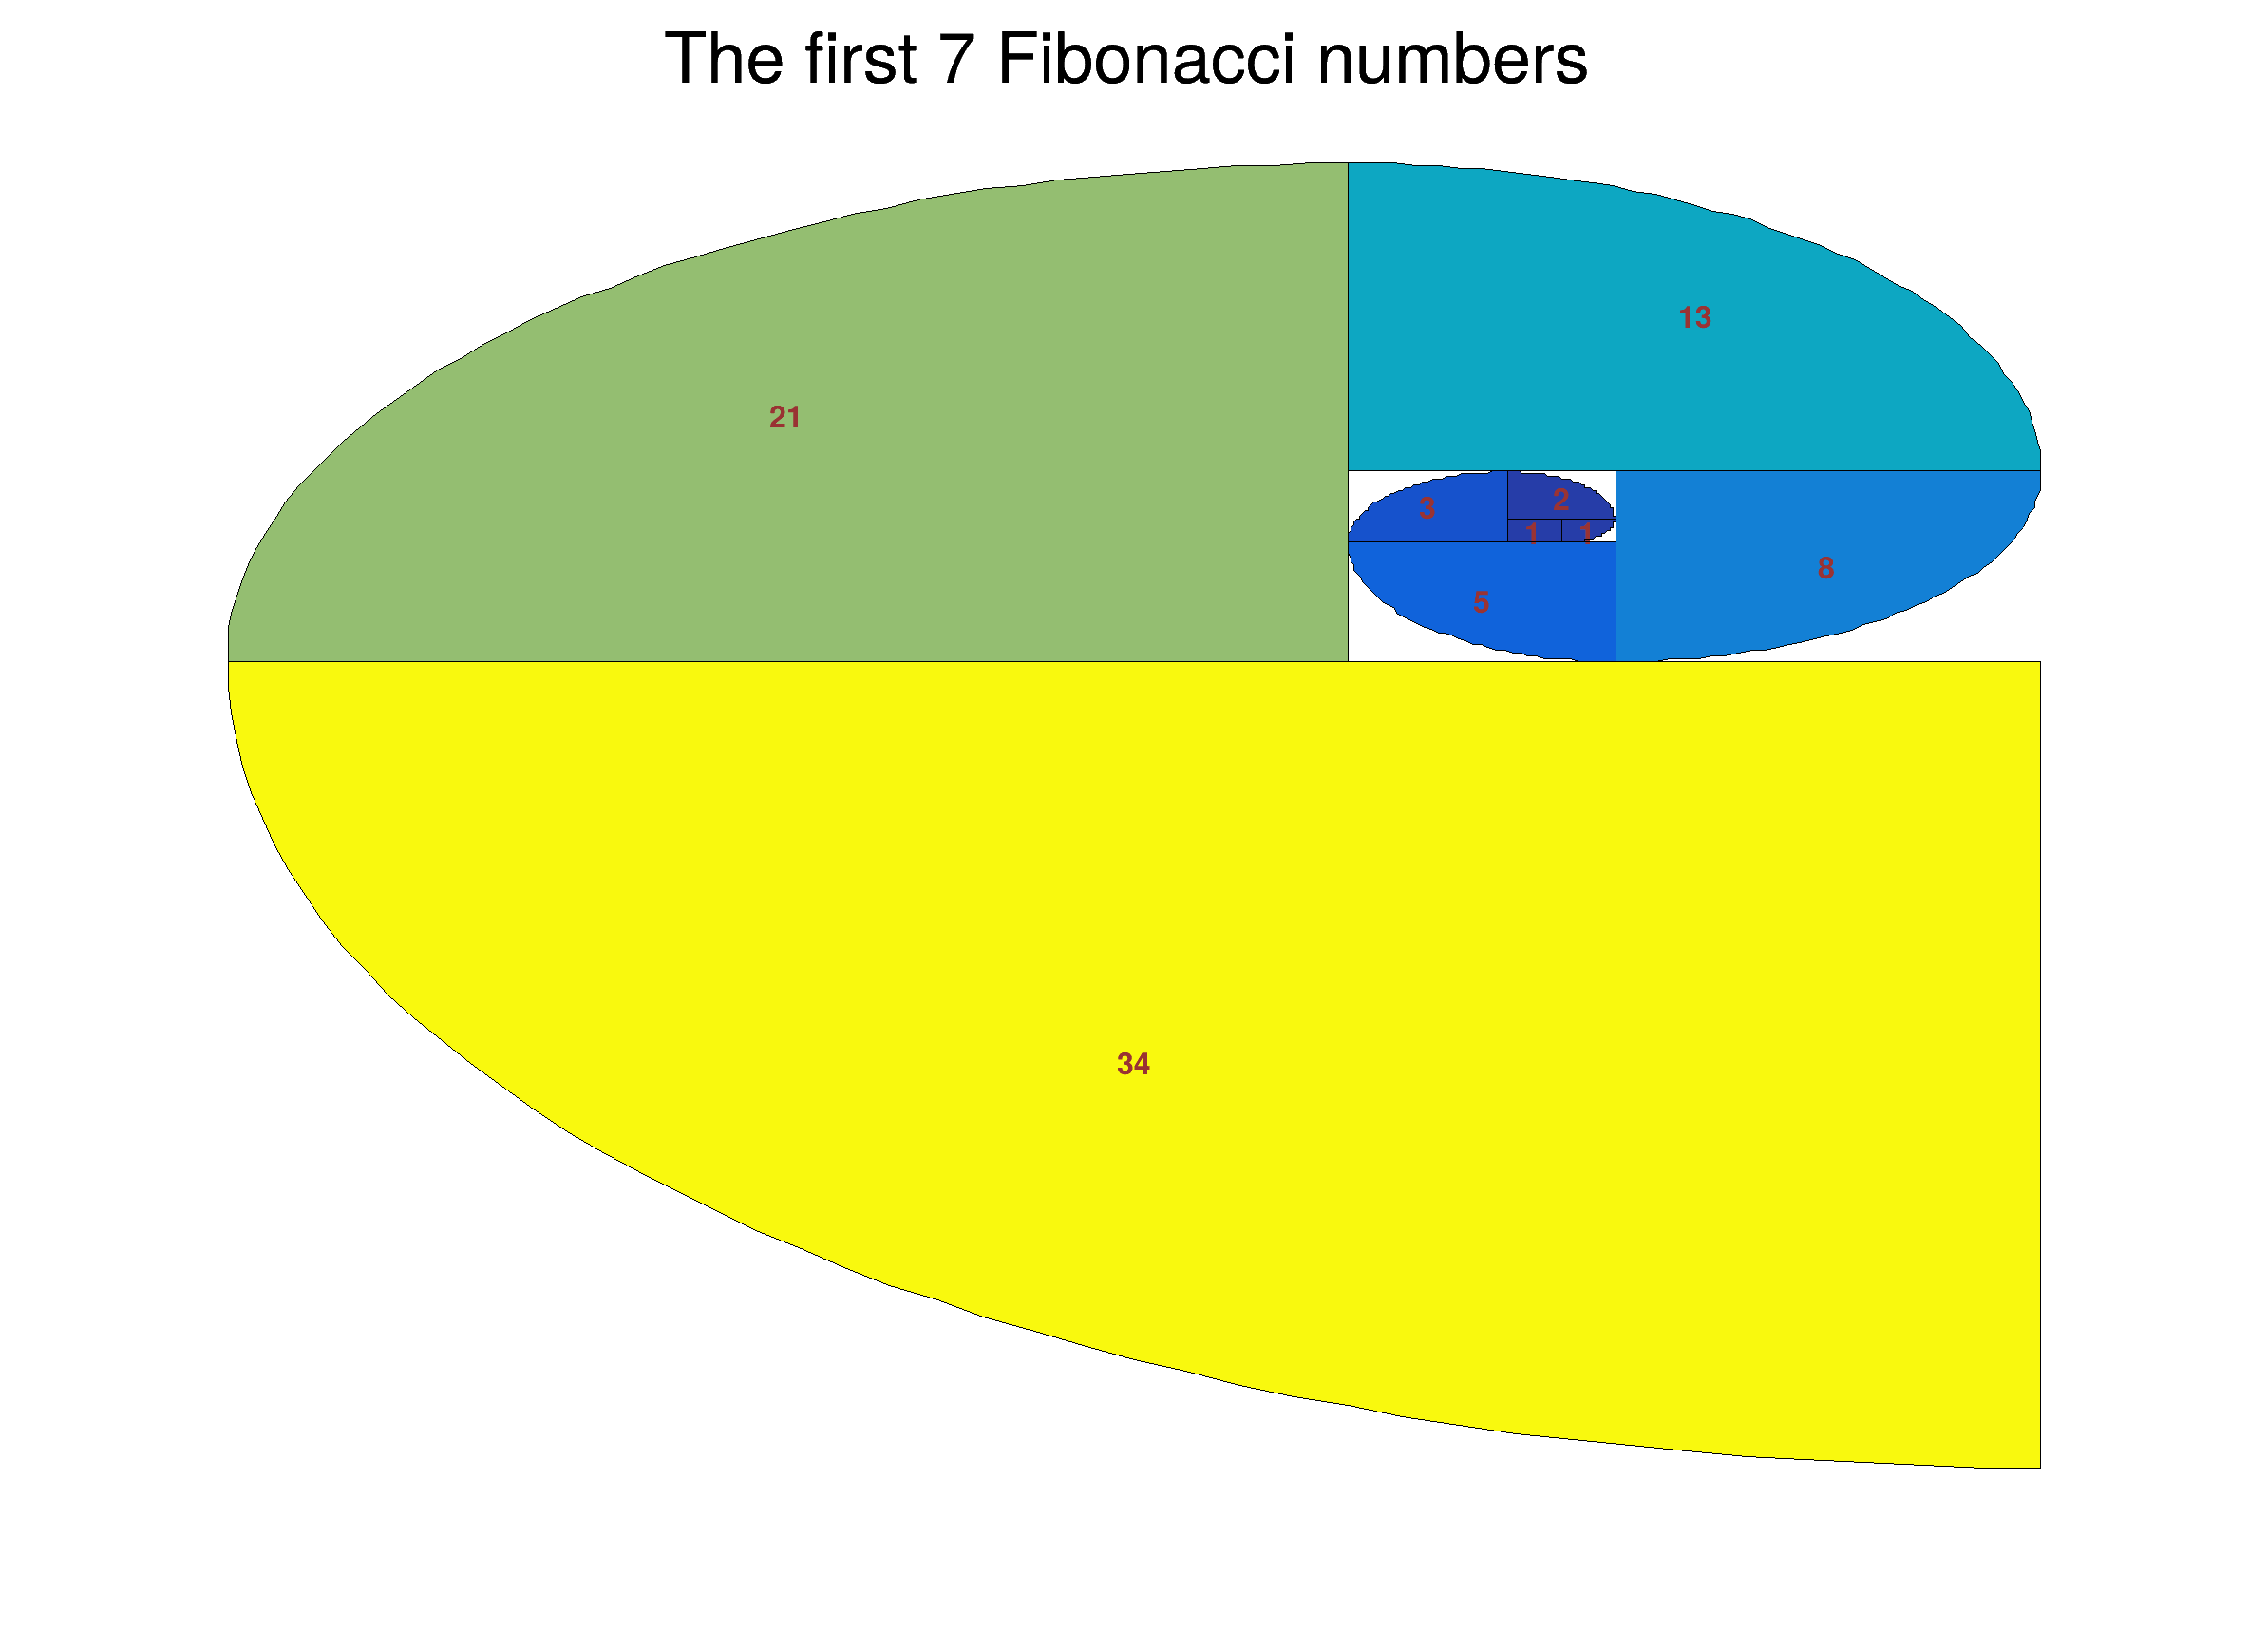 A TH2Poly build with Fibonacci numbers. A TH2Poly build with Fibonacci numbers. | |
| hist105_TExec_dynamic_slice.C | |
 Show the slice of a TH2 following the mouse position. Show the slice of a TH2 following the mouse position. | |
| hist105_TExec_dynamic_slice.py | |
| Example of function called when a mouse event occurs in a pad. | |
