

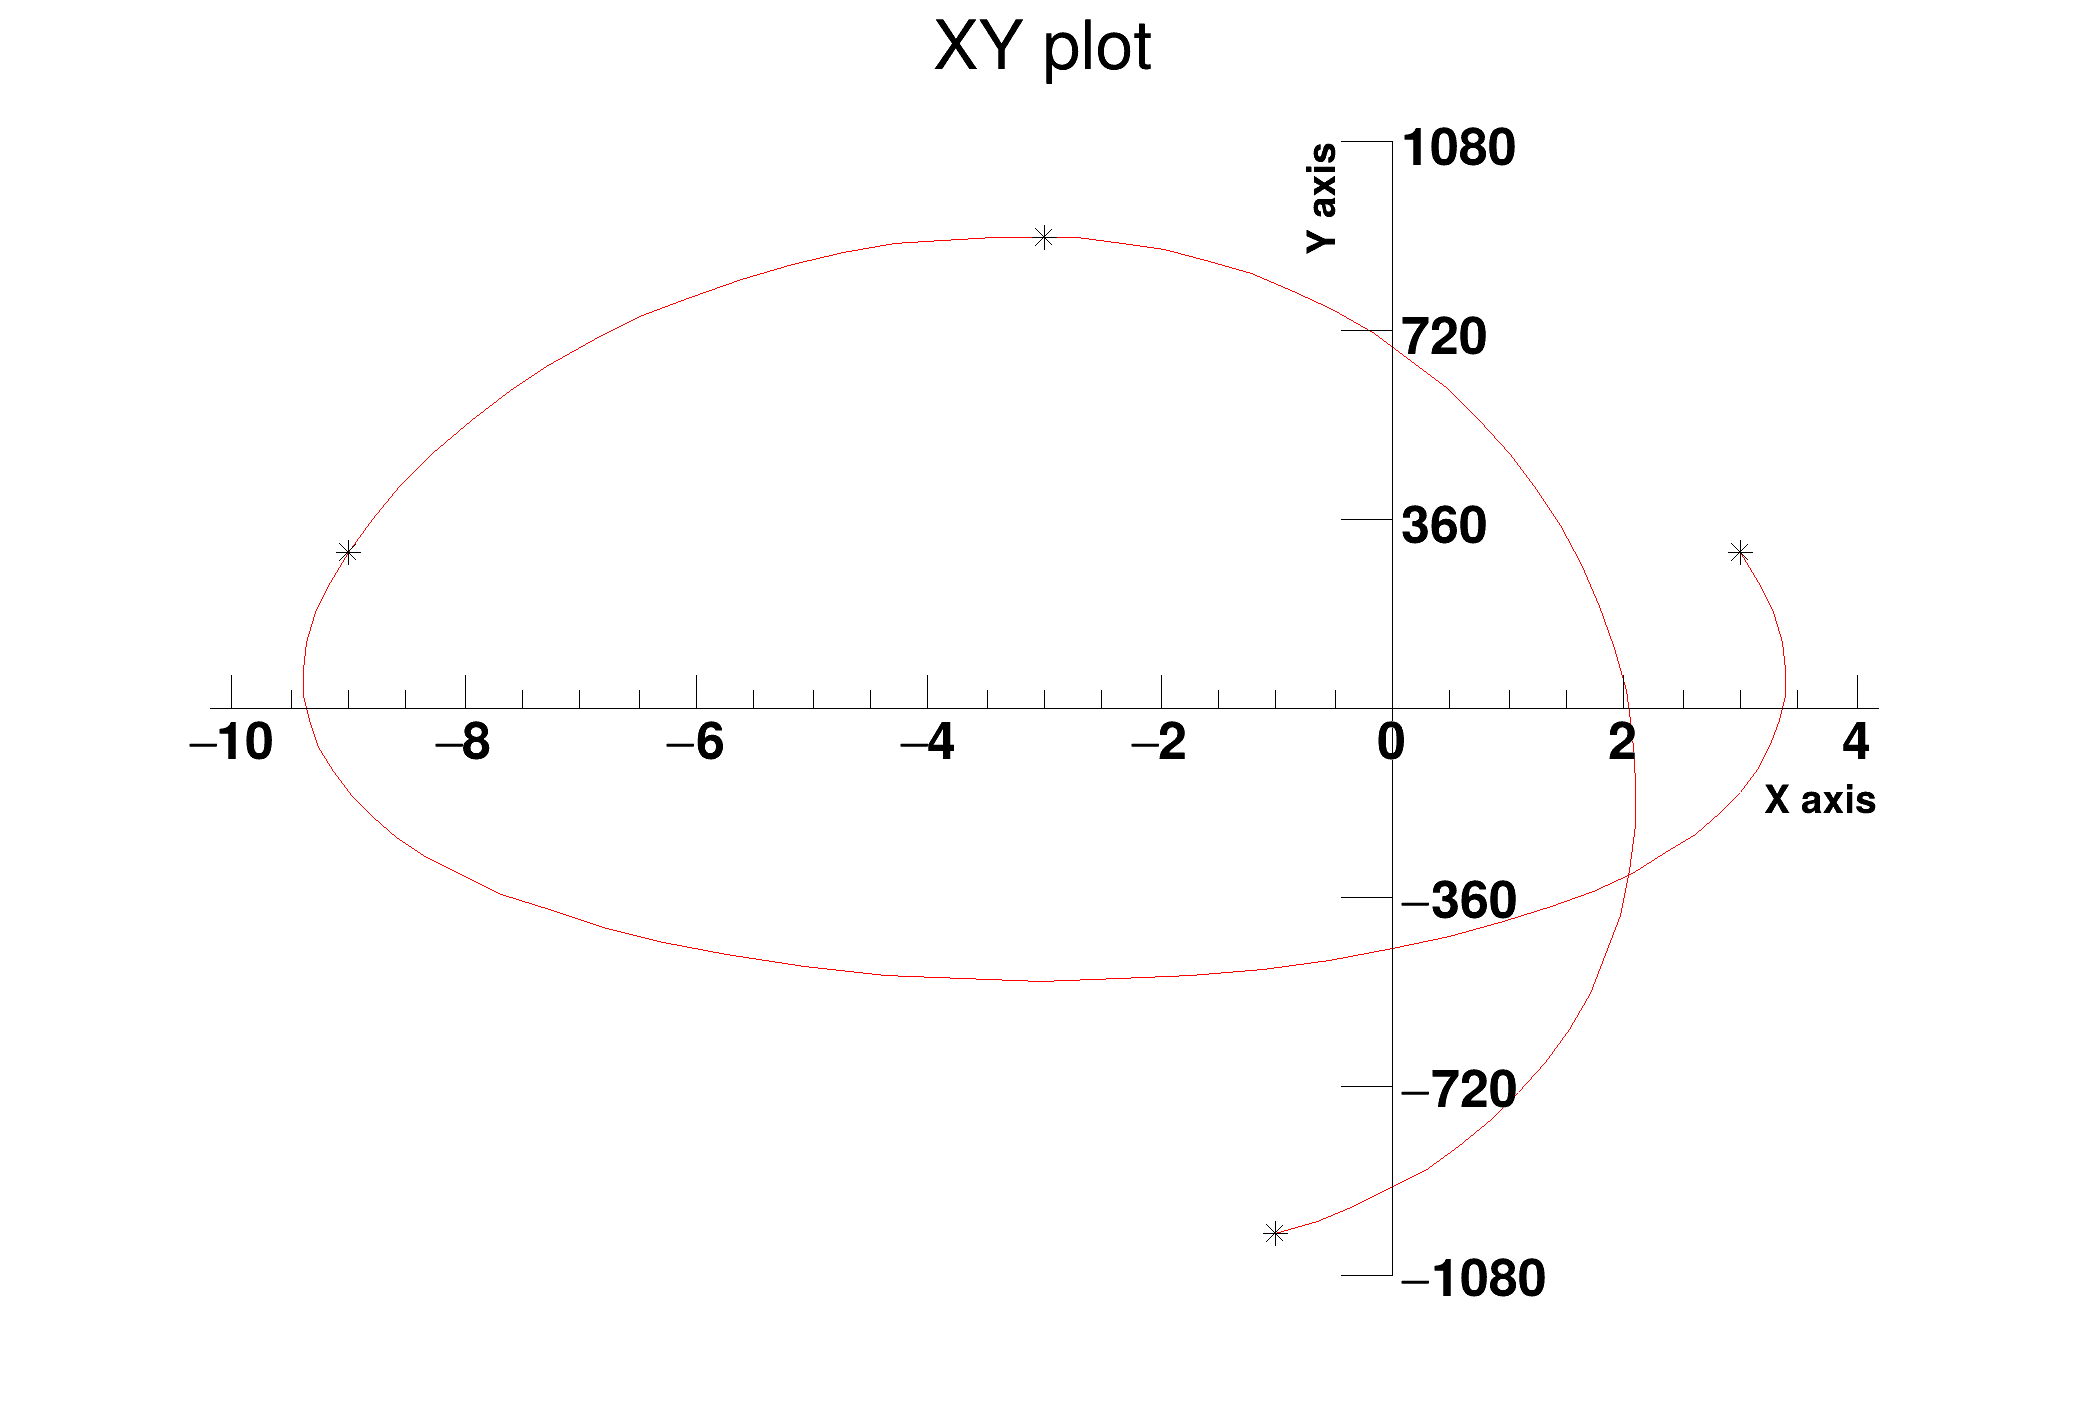
 Example showing how to produce a plot with an orthogonal axis system centered at (0,0).
hpu�
void xyplot()
{
c->SetFrameBorderMode(0);
gr->GetHistogram()->GetYaxis()->SetTickLength(0);
gr->GetHistogram()->GetXaxis()->SetTickLength(0);
gr->GetHistogram()->GetYaxis()->SetLabelSize(0);
gr->GetHistogram()->GetXaxis()->SetLabelSize(0);
gr->GetHistogram()->GetXaxis()->SetAxisColor(0);
gr->GetHistogram()->GetYaxis()->SetAxisColor(0);
}
int Int_t
Signed integer 4 bytes (int).
double Double_t
Double 8 bytes.
virtual void SetTextAlign(Short_t align=11)
Set the text alignment.
virtual void SetTextAngle(Float_t tangle=0)
Set the text angle.
virtual void SetTextSize(Float_t tsize=1)
Set the text size.
void ChangeLabel(Int_t labNum=0, Double_t labAngle=-1., Double_t labSize=-1., Int_t labAlign=-1, Int_t labColor=-1, Int_t labFont=-1, const TString &labText="")
virtual void Draw(Option_t *option="")
Default Draw method for all objects.
- Date
- January 2017
- Author
- Olivier Couet
Definition in file xyplot.C.

