void write_histograms()
{
TFile f(
"ht.root",
"recreate");
auto T =
new TTree(
"T",
"test");
auto hpx =
new TH1F(
"hpx",
"This is the px distribution", 100, -4, 4);
auto hpxpy =
new TH2F(
"hpxpy",
"py vs px", 40, -4, 4, 40, -4, 4);
auto hprof =
new TProfile(
"hprof",
"Profile of pz versus px", 100, -4, 4, 0, 20);
T->Branch("hpx", "TH1F", &hpx, 32000, 0);
T->Branch("hpxpy", "TH2F", &hpxpy, 32000, 0);
T->Branch("hprof", "TProfile", &hprof, 32000, 0);
for (
Int_t i = 0; i < 25000; i++) {
if (i % 1000 == 0)
printf("at entry: %d\n", i);
pz = px * px + py * py;
hpx->Fill(px);
hpxpy->Fill(px ,py);
hprof->Fill(px, pz);
T->Fill();
}
T->Print();
}
void read_histogram1()
{
T->SetBranchAddress("hpx", &hpx);
T->SetBranchAddress("hpxpy", &hpxpy);
T->SetBranchAddress("hprof", &hprof);
T->GetEntry(12345);
auto c1 =
new TCanvas(
"c1",
"test", 10, 10, 600, 1000);
hpx->Draw();
hpxpy->Draw();
}
void read_histogram2()
{
auto c1 =
new TCanvas(
"c1",
"test", 10, 10, 600, 1000);
T->Draw("hpx.Draw()", "", "goff", 1, 12345);
T->Draw("hpxpy.Draw()", "", "goff", 1, 12345);
T->Draw("hprof.Draw()", "", "goff", 1, 12345);
}
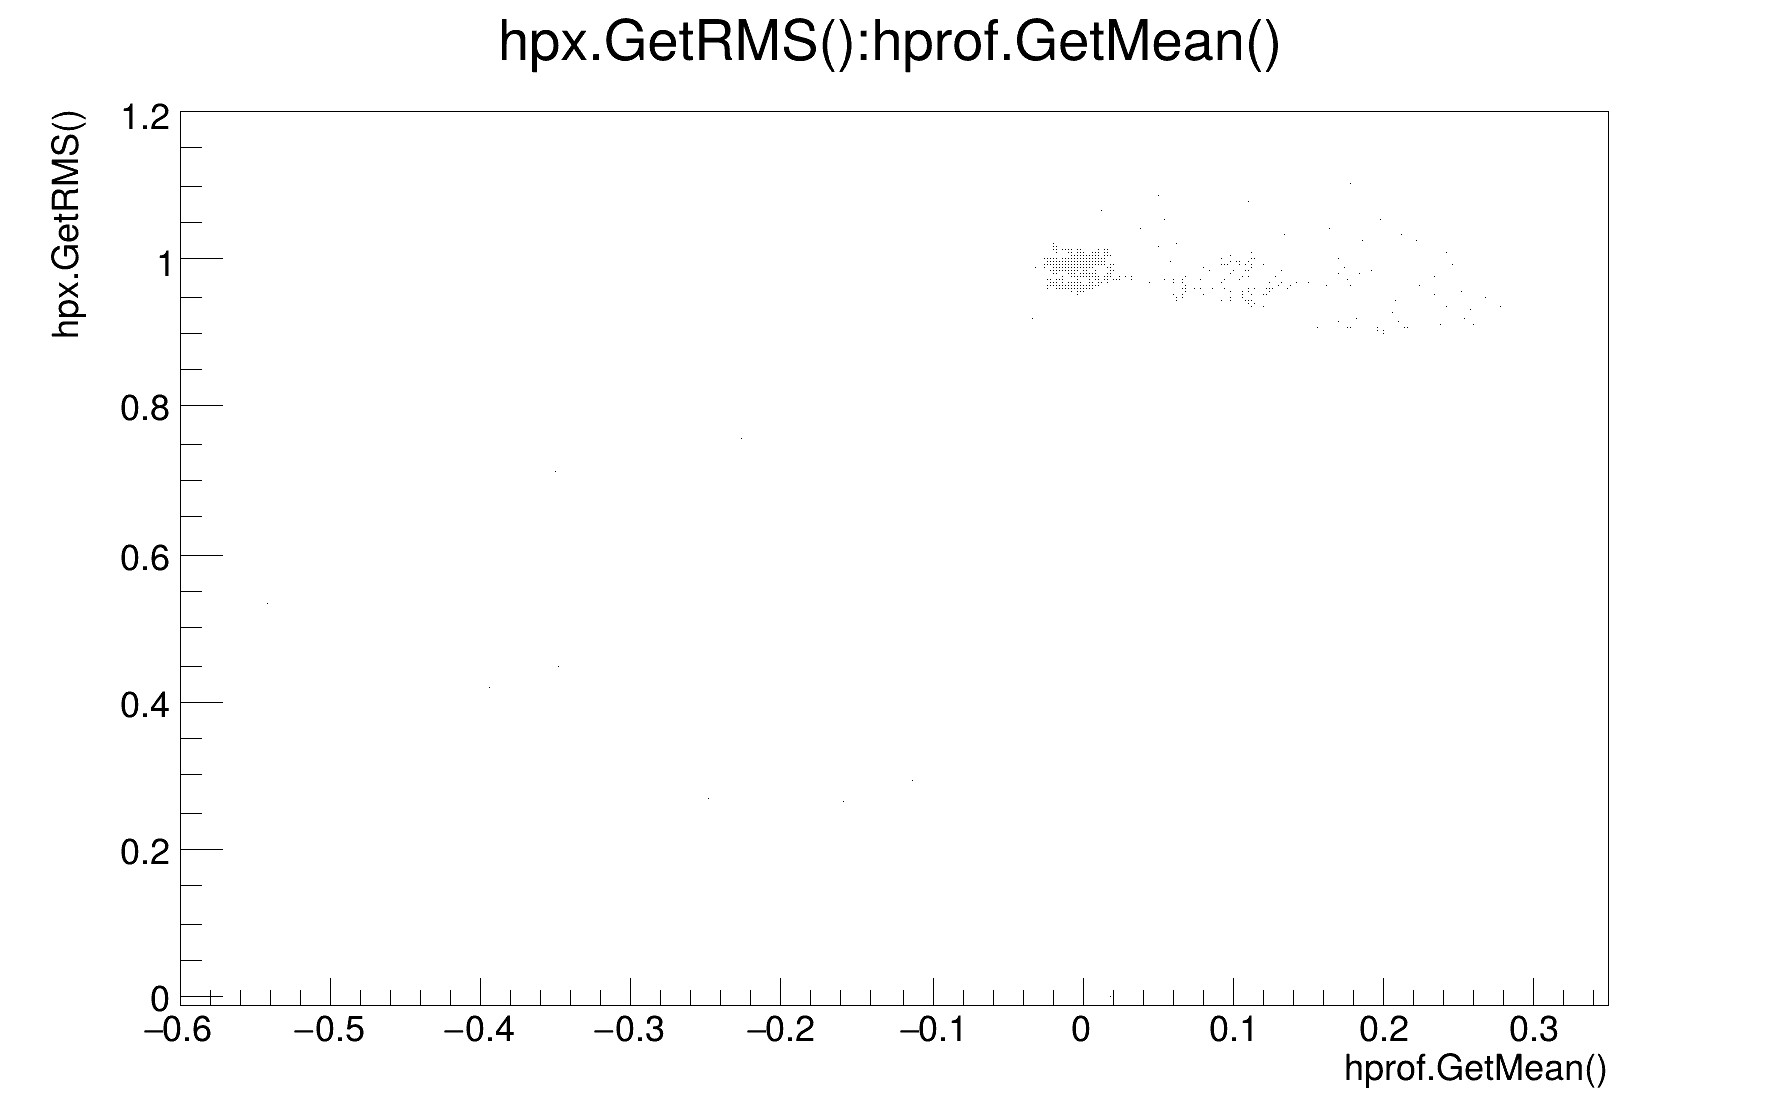
void read_histogram3()
{
auto c1 =
new TCanvas(
"c1",
"test", 10, 10, 600, 400);
T->Draw("hpx.GetRMS():hprof.GetMean()");
}
void tree201_histograms()
{
write_histograms();
read_histogram1();
read_histogram2();
read_histogram3();
}
int Int_t
Signed integer 4 bytes (int).
float Float_t
Float 4 bytes (float).
externTBenchmark * gBenchmark
static TFile * Open(const char *name, Option_t *option="", const char *ftitle="", Int_t compress=ROOT::RCompressionSetting::EDefaults::kUseCompiledDefault, Int_t netopt=0)
1-D histogram with a float per channel (see TH1 documentation)
void Draw(Option_t *option="") override
Default Draw method for all objects.
2-D histogram with a float per channel (see TH1 documentation)
A TTree represents a columnar dataset.