

 Plot the Amplitude of a Hydrogen Atom.
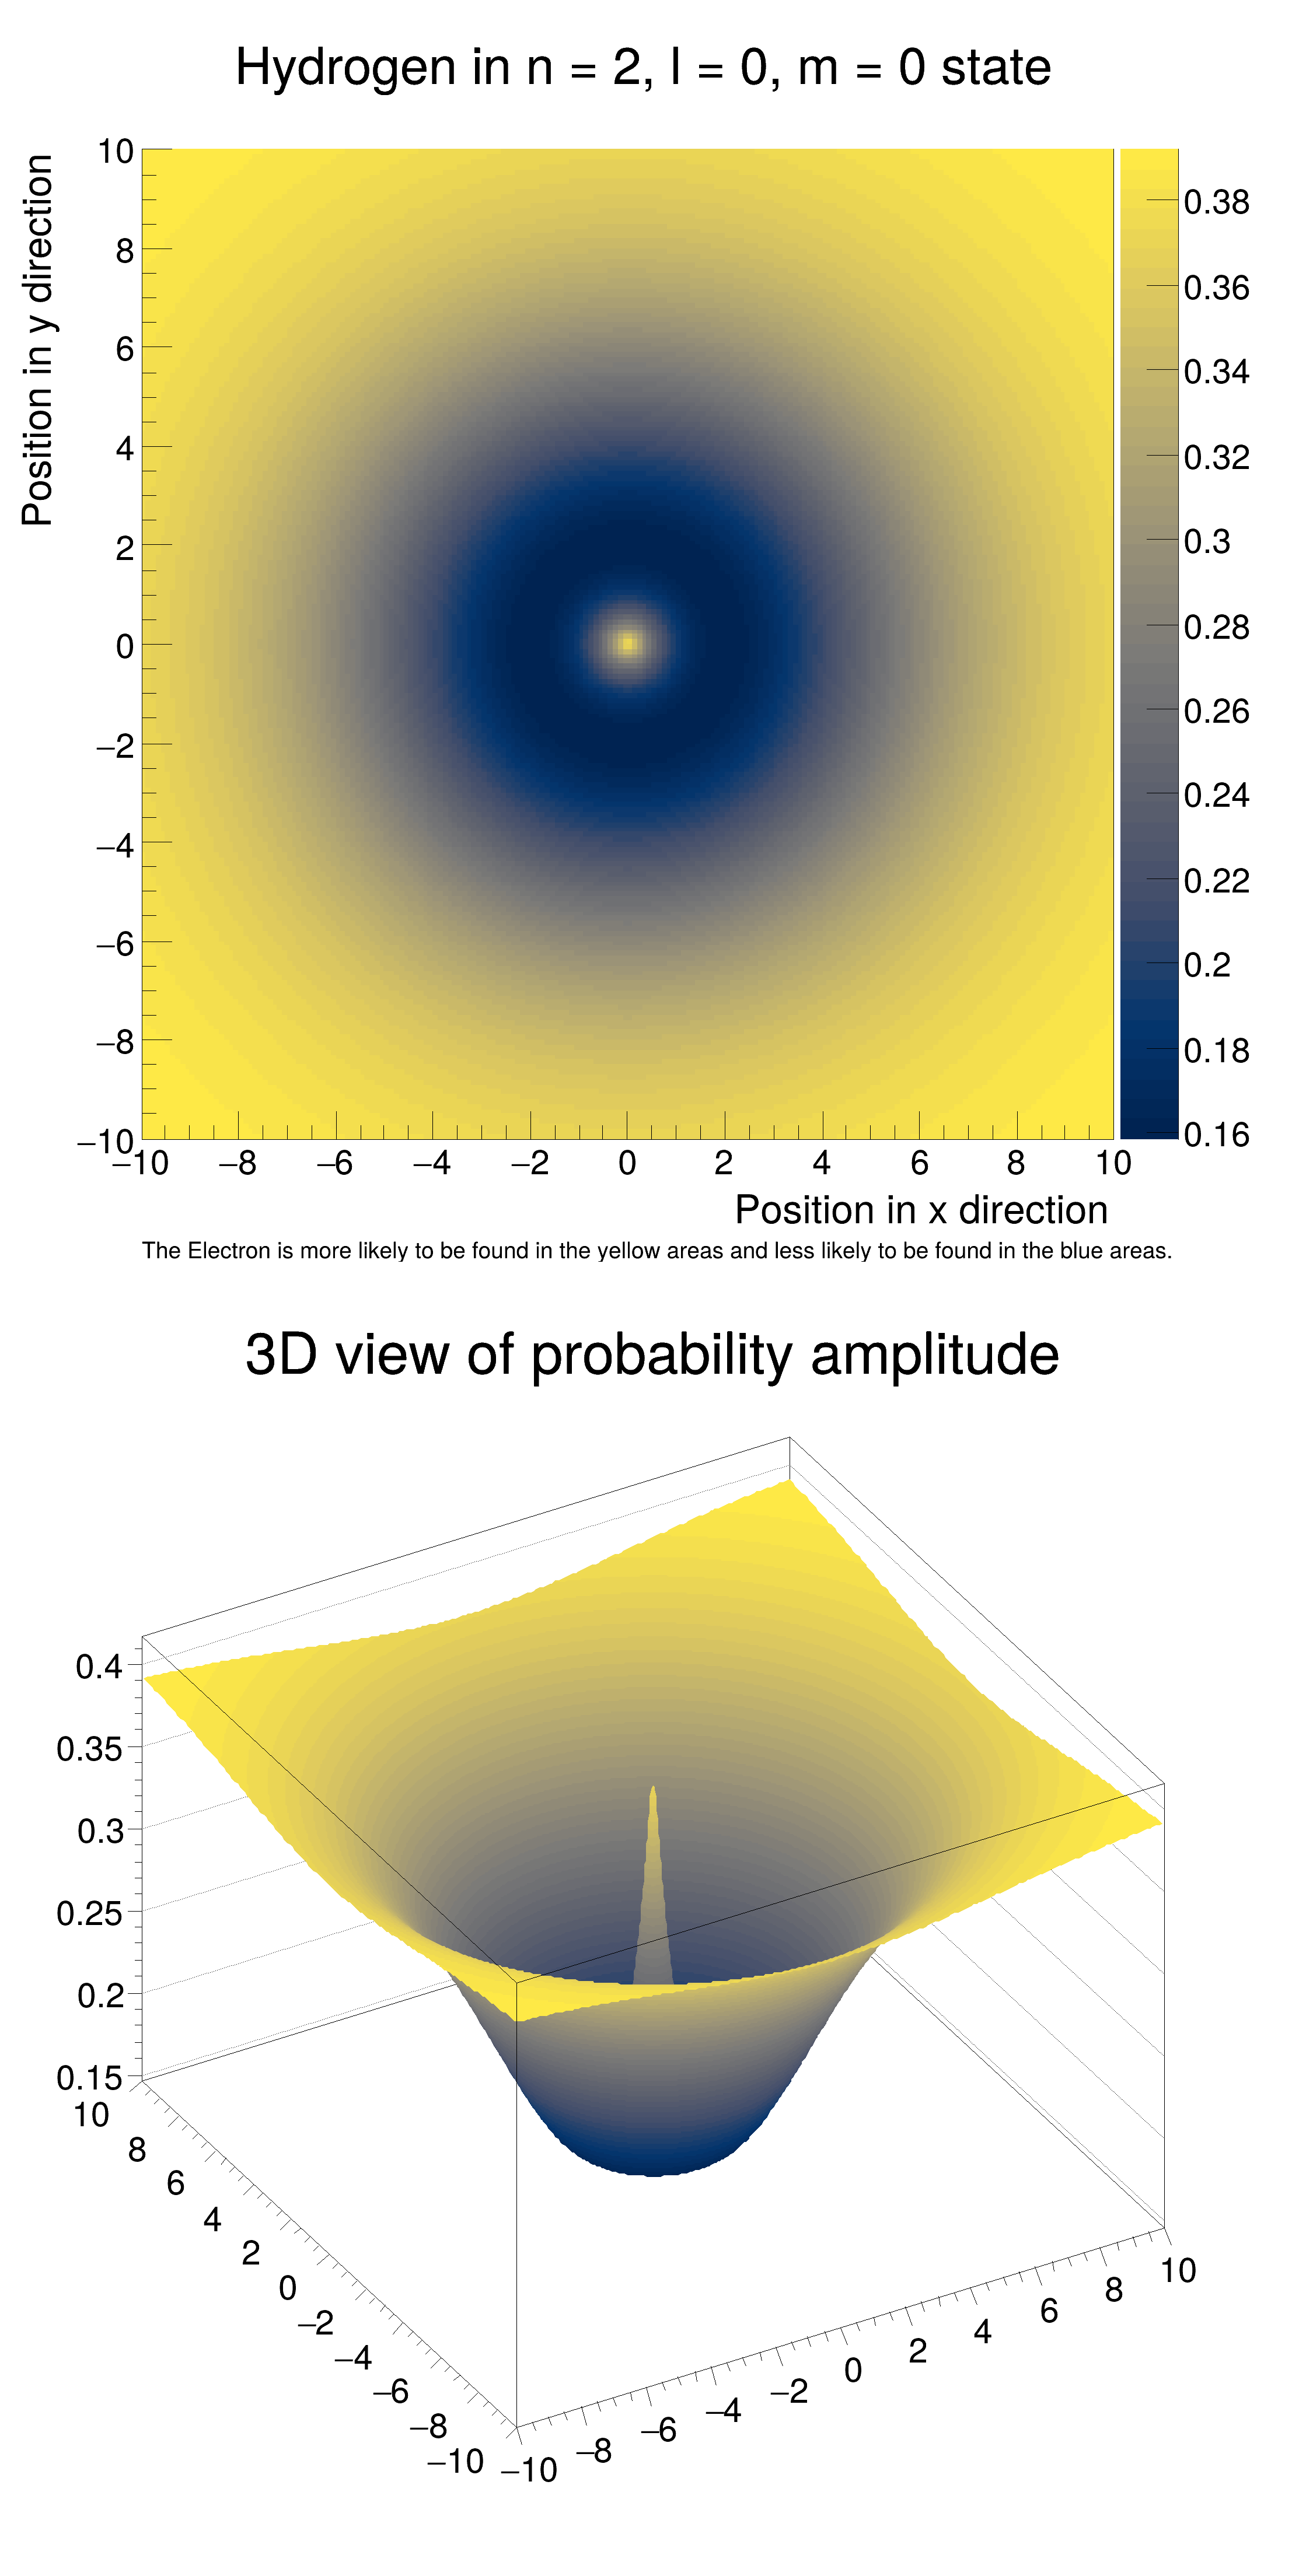
Visualize the Amplitude of a Hydrogen Atom in the n = 2, l = 0, m = 0 state. Demonstrates how TH2F can be used in Quantum Mechanics.
The formula for Hydrogen in this energy state is \( \psi_{200} = \frac{1}{4\sqrt{2\pi}a_0
^{\frac{3}{2}}}(2-\frac{\sqrt{x^2+y^2}}{a_0})e^{-\frac{\sqrt{x^2+y^2}}{2a_0}} \)
#include <cmath>
double WaveFunction(
double x,
double y)
{
double r = sqrt(
x *
x +
y *
y);
double w = (1 / pow((4 * sqrt(2 *
TMath::Pi()) * 1), 1.5)) *
}
void schroedinger_hydrogen()
{
"Hydrogen in n = 2, l = 0, m = 0 state; Position in x direction; Position in y direction", 200,
-10, 10, 200, -10, 10);
for (float i = -10; i < 10; i += 0.01) {
for (float j = -10; j < 10; j += 0.01) {
h2D->
Fill(i, j, WaveFunction(i, j));
}
}
c1_1->SetRightMargin(0.14);
-10, -12.43,
"The Electron is more likely to be found in the yellow areas and less likely to be found in the blue areas.");
c1_2->SetTheta(42.);
h2Dc->
SetTitle(
"3D view of probability amplitude;;");
}
Option_t Option_t TPoint TPoint const char GetTextMagnitude GetFillStyle GetLineColor GetLineWidth GetMarkerStyle GetTextAlign GetTextColor GetTextSize void w
Option_t Option_t TPoint TPoint const char GetTextMagnitude GetFillStyle GetLineColor GetLineWidth GetMarkerStyle GetTextAlign GetTextColor GetTextSize void char Point_t Rectangle_t WindowAttributes_t Float_t r
virtual void SetLabelSize(Float_t size=0.04)
Set size of axis labels.
void SetTitle(const char *title) override
Set the title of the TNamed.
virtual void SetContour(Int_t nlevels, const Double_t *levels=nullptr)
void Draw(Option_t *option="") override
Default Draw method for all objects.
TObject * Clone(const char *newname="") const override
Make a clone of an object using the Streamer facility.
2-D histogram with a double per channel (see TH1 documentation)
2-D histogram with a float per channel (see TH1 documentation)
Int_t Fill(Double_t) override
Invalid Fill method.
constexpr Double_t E()
Base of natural log: .
- Author
- Advait Dhingra
Definition in file schroedinger_hydrogen.C.

