

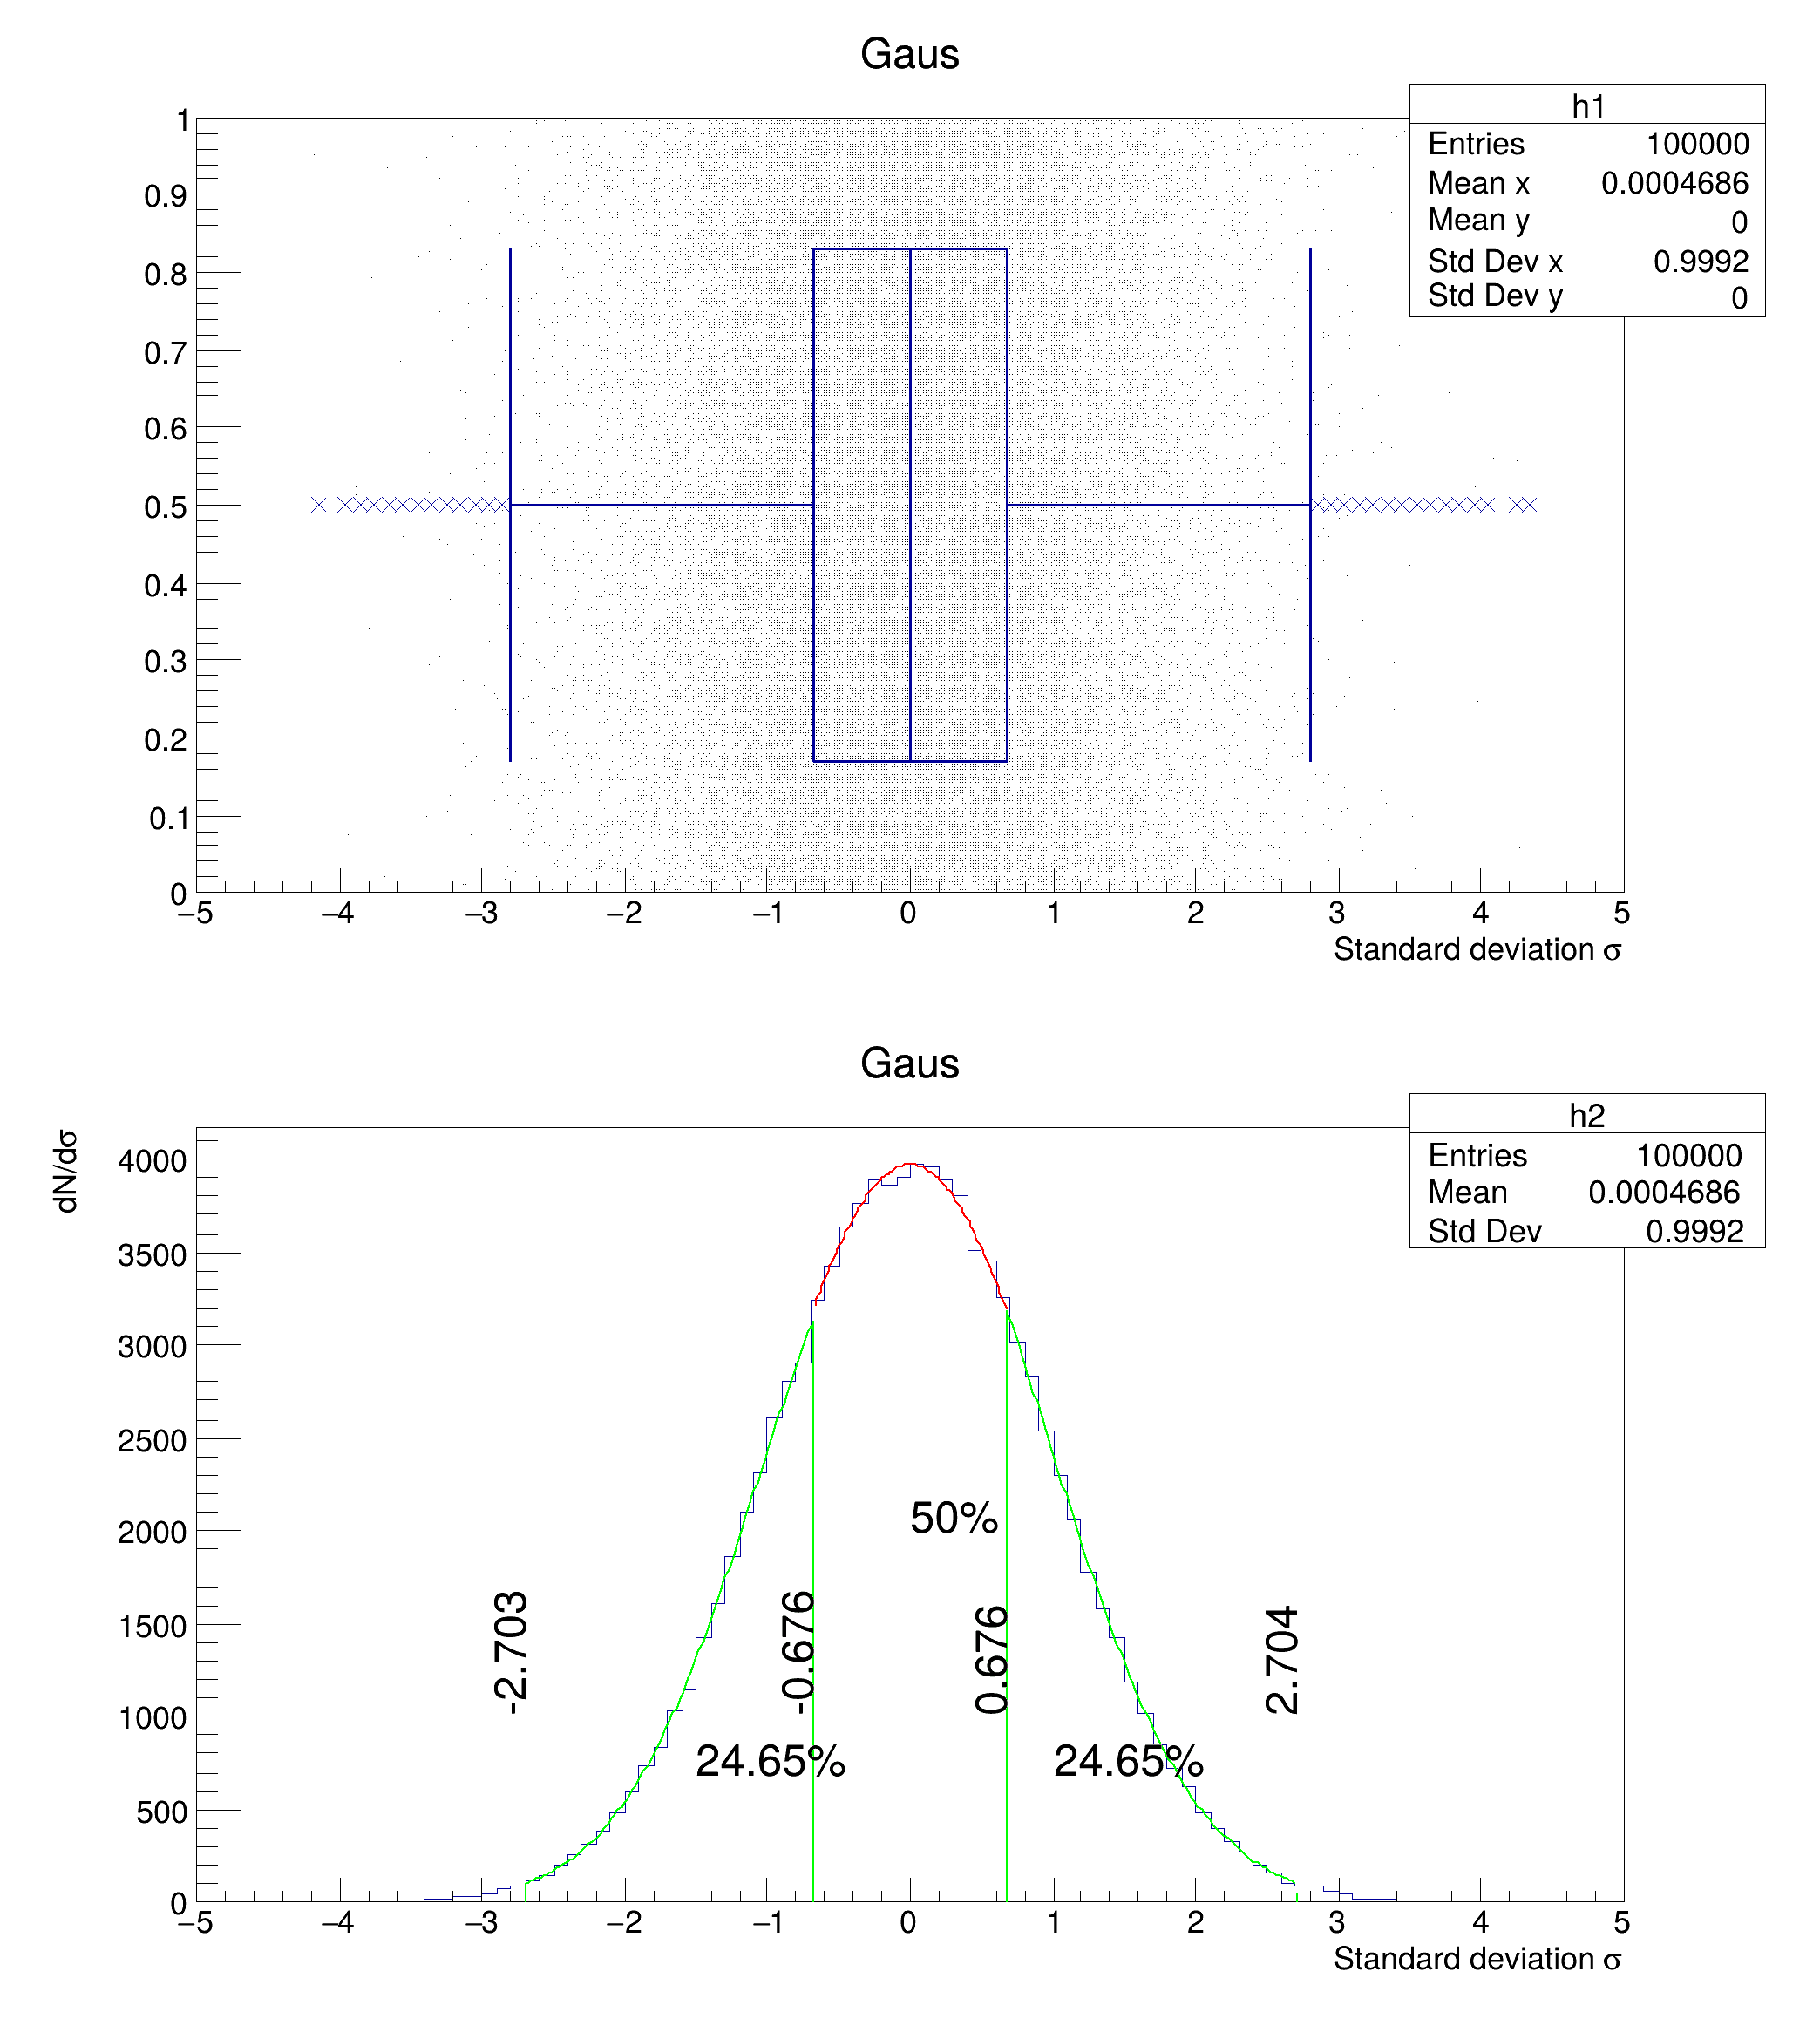
 Example of candle plot showing the whiskers definition.
Q1 (-25%): -0.675525 Median: 0.00168511 Q3 (+25%): 0.676189
****************************************
Minimizer is Minuit2 / Migrad
Chi2 = 11.7941
NDf = 17
Edm = 1.90451e-06
NCalls = 131
Constant = 3728.5 +/- 182.158
Mean = -0.110704 +/- 0.0721071
Sigma = 0.959495 +/- 0.0251539 (limited)
****************************************
Minimizer is Minuit2 / Migrad
Chi2 = 8.0469
NDf = 17
Edm = 1.56503e-05
NCalls = 132
Constant = 4071.09 +/- 244.49
Mean = -0.0289155 +/- 0.087166
Sigma = 1.00961 +/- 0.0288274 (limited)
****************************************
Minimizer is Minuit2 / Migrad
Chi2 = 6.93238
NDf = 11
Edm = 3.27955e-08
NCalls = 107
Constant = 3970.02 +/- 25.7596
Mean = -0.000189021 +/- 0.0118284
Sigma = 1.02465 +/- 0.0335469 (limited)
void hist052_Graphics_candle_plot_whiskers()
{
auto c1 =
new TCanvas(
"c1",
"Candle Presets", 700, 800);
auto h1 =
new TH2I(
"h1",
"Gaus", 100, -5, 5, 1, 0, 1);
auto h2 =
new TH1I(
"h2",
"Gaus", 100, -5, 5);
h1->GetXaxis()->SetTitle(
"Standard deviation #sigma");
h2->GetXaxis()->SetTitle("Standard deviation #sigma");
h2->GetYaxis()->SetTitle("dN/d#sigma");
float myRand;
for (int i = 0; i < 100000; i++) {
myRand = rng->Gaus(0, 1);
h2->Fill(myRand);
}
p[0] = 0.25;
p[1] = 0.5;
p[2] = 0.75;
h2->GetQuantiles(3,
q, p);
cout <<
"Q1 (-25%): " <<
q[0] <<
" Median: " <<
q[1] <<
" Q3 (+25%): " <<
q[2] << endl;
double iqr =
q[2] -
q[0];
auto mygaus_1_middle =
new TF1(
"mygaus_1_middle",
"gaus",
q[0],
q[2]);
auto mygaus_1_left =
new TF1(
"mygaus_1_left",
"gaus",
q[0] - 1.5 * iqr,
q[0]);
mygaus_1_left->SetLineColor(
kGreen);
auto mygaus_1_right =
new TF1(
"mygaus_1_right",
"gaus",
q[2],
q[2] + 1.5 * iqr);
mygaus_1_right->SetLineColor(
kGreen);
h1->Draw(
"candley2 scat");
h2->Draw("");
h2->Fit("mygaus_1_left", "R");
mygaus_1_left->Draw("same");
auto l3 =
new TLine(
q[0] - 1.5 * iqr, 0,
q[0] - 1.5 * iqr, mygaus_1_left->Eval(
q[0] - 1.5 * iqr));
l3->SetLineWidth(2);
l3->Draw("");
auto l1 =
new TLine(
q[0], 0,
q[0], mygaus_1_left->Eval(
q[0]));
l1->SetLineWidth(2);
l1->Draw("");
h2->Fit("mygaus_1_right", "R", "");
mygaus_1_right->Draw("same");
auto l4 =
new TLine(
q[2] + 1.5 * iqr, 0,
q[2] + 1.5 * iqr, mygaus_1_left->Eval(
q[2] + 1.5 * iqr));
l4->SetLineWidth(2);
l4->Draw("");
auto l5 =
new TLine(
q[2], 0,
q[2], mygaus_1_right->Eval(
q[2]));
l5->SetLineWidth(2);
l5->Draw("");
h2->Fit("mygaus_1_middle", "R");
mygaus_1_middle->Draw("same");
t.
DrawText(0, mygaus_1_middle->Eval(0) / 2,
"50%");
t.
DrawText(-1.5, mygaus_1_middle->Eval(-1.5) / 2,
"24.65%");
t.
DrawText(+1, mygaus_1_middle->Eval(+1.5) / 2,
"24.65%");
}
double Double_t
Double 8 bytes.
char * Form(const char *fmt,...)
Formats a string in a circular formatting buffer.
virtual void SetTextAngle(Float_t tangle=0)
Set the text angle.
virtual void SetTextFont(Font_t tfont=62)
Set the text font.
1-D histogram with an int per channel (see TH1 documentation)
2-D histogram with an int per channel (see TH1 documentation)
Use the TLine constructor to create a simple line.
This is the base class for the ROOT Random number generators.
virtual TText * DrawText(Double_t x, Double_t y, const char *text)
- Date
- June 2022
- Author
- Georg Troska
Definition in file hist052_Graphics_candle_plot_whiskers.C.

