void hist049_Graphics_candle_plot()
{
TDatime dateBegin(2010, 1, 1, 0, 0, 0);
TDatime dateEnd(2011, 1, 1, 0, 0, 0);
auto h1 =
new TH2I(
"h1",
"Machine A + B", 12, dateBegin.Convert(), dateEnd.Convert(), 1000, 0, 1000);
auto h2 =
new TH2I(
"h2",
"Machine B", 12, dateBegin.Convert(), dateEnd.Convert(), 1000, 0, 1000);
h1->GetXaxis()->SetTimeDisplay(1);
h1->GetXaxis()->SetTimeFormat(
"%d/%m/%y");
h1->GetXaxis()->SetNdivisions(-6);
h1->GetXaxis()->SetTitle(
"Date [day/month/year]");
float Rand;
for (int i = dateBegin.Convert(); i < dateEnd.Convert(); i += 86400 * 30) {
for (int j = 0; j < 1000; j++) {
Rand =
gRandom->Gaus(500 + sin(i / 10000000.) * 100, 50);
Rand =
gRandom->Gaus(500 + sin(i / 11000000.) * 100, 70);
h2->Fill(i, Rand);
}
}
h2->SetBarWidth(0.4);
h2->SetBarOffset(0.25);
h2->Draw("candle3 same");
gPad->BuildLegend(0.78, 0.695, 0.980, 0.935,
"",
"f");
}
This class stores the date and time with a precision of one second in an unsigned 32 bit word (950130...
2-D histogram with an int per channel (see TH1 documentation)

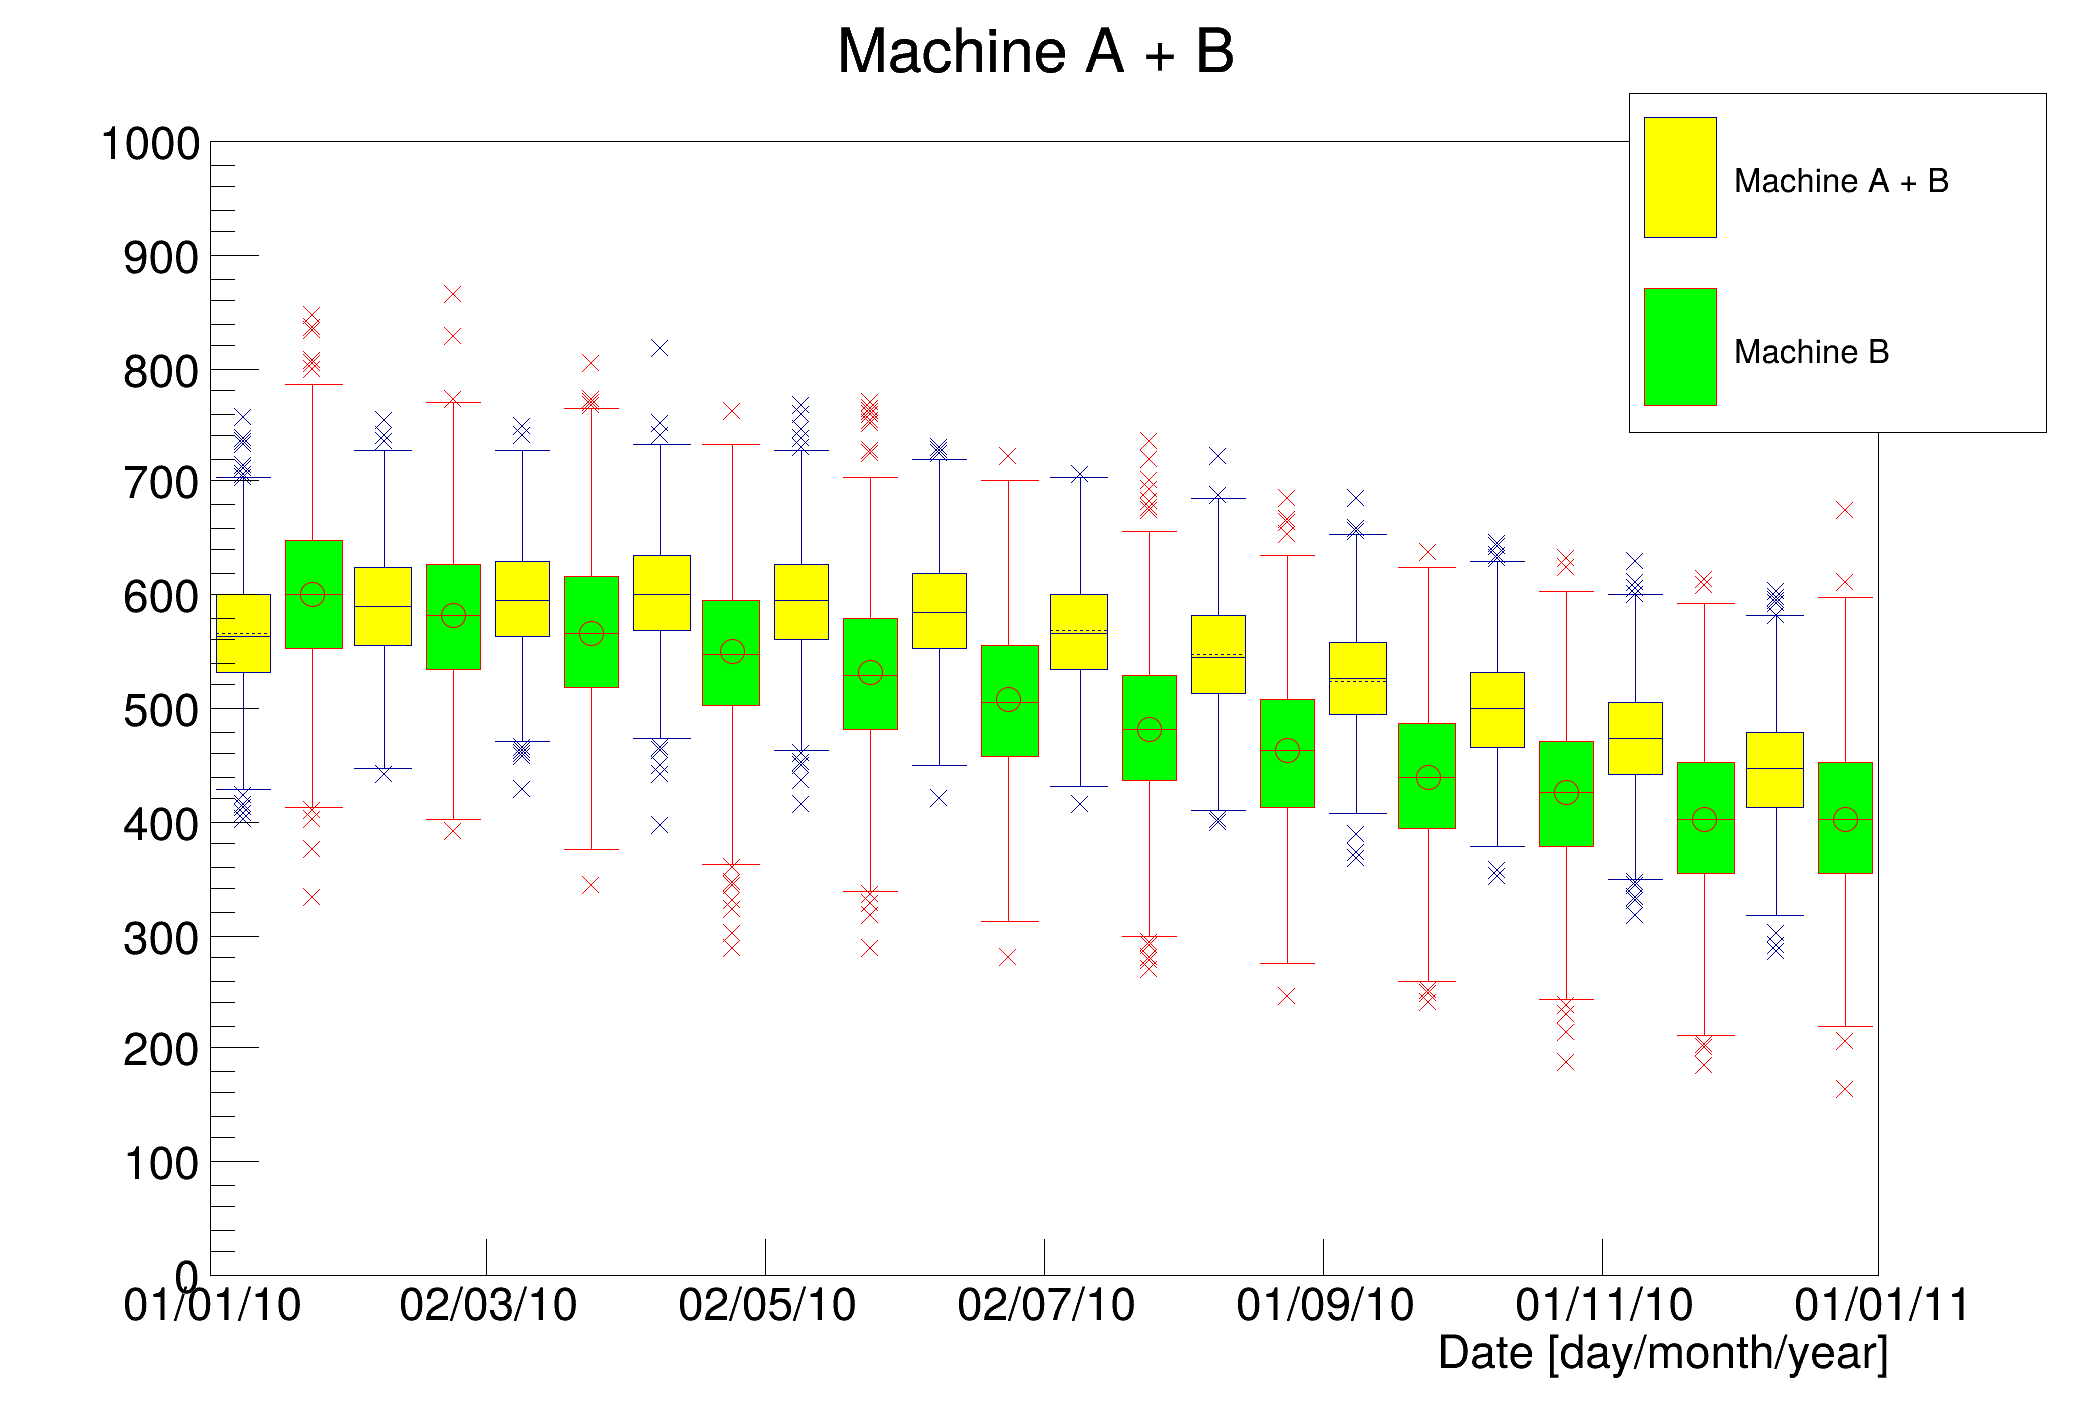 Example of candle plot with 2-D histograms.
