

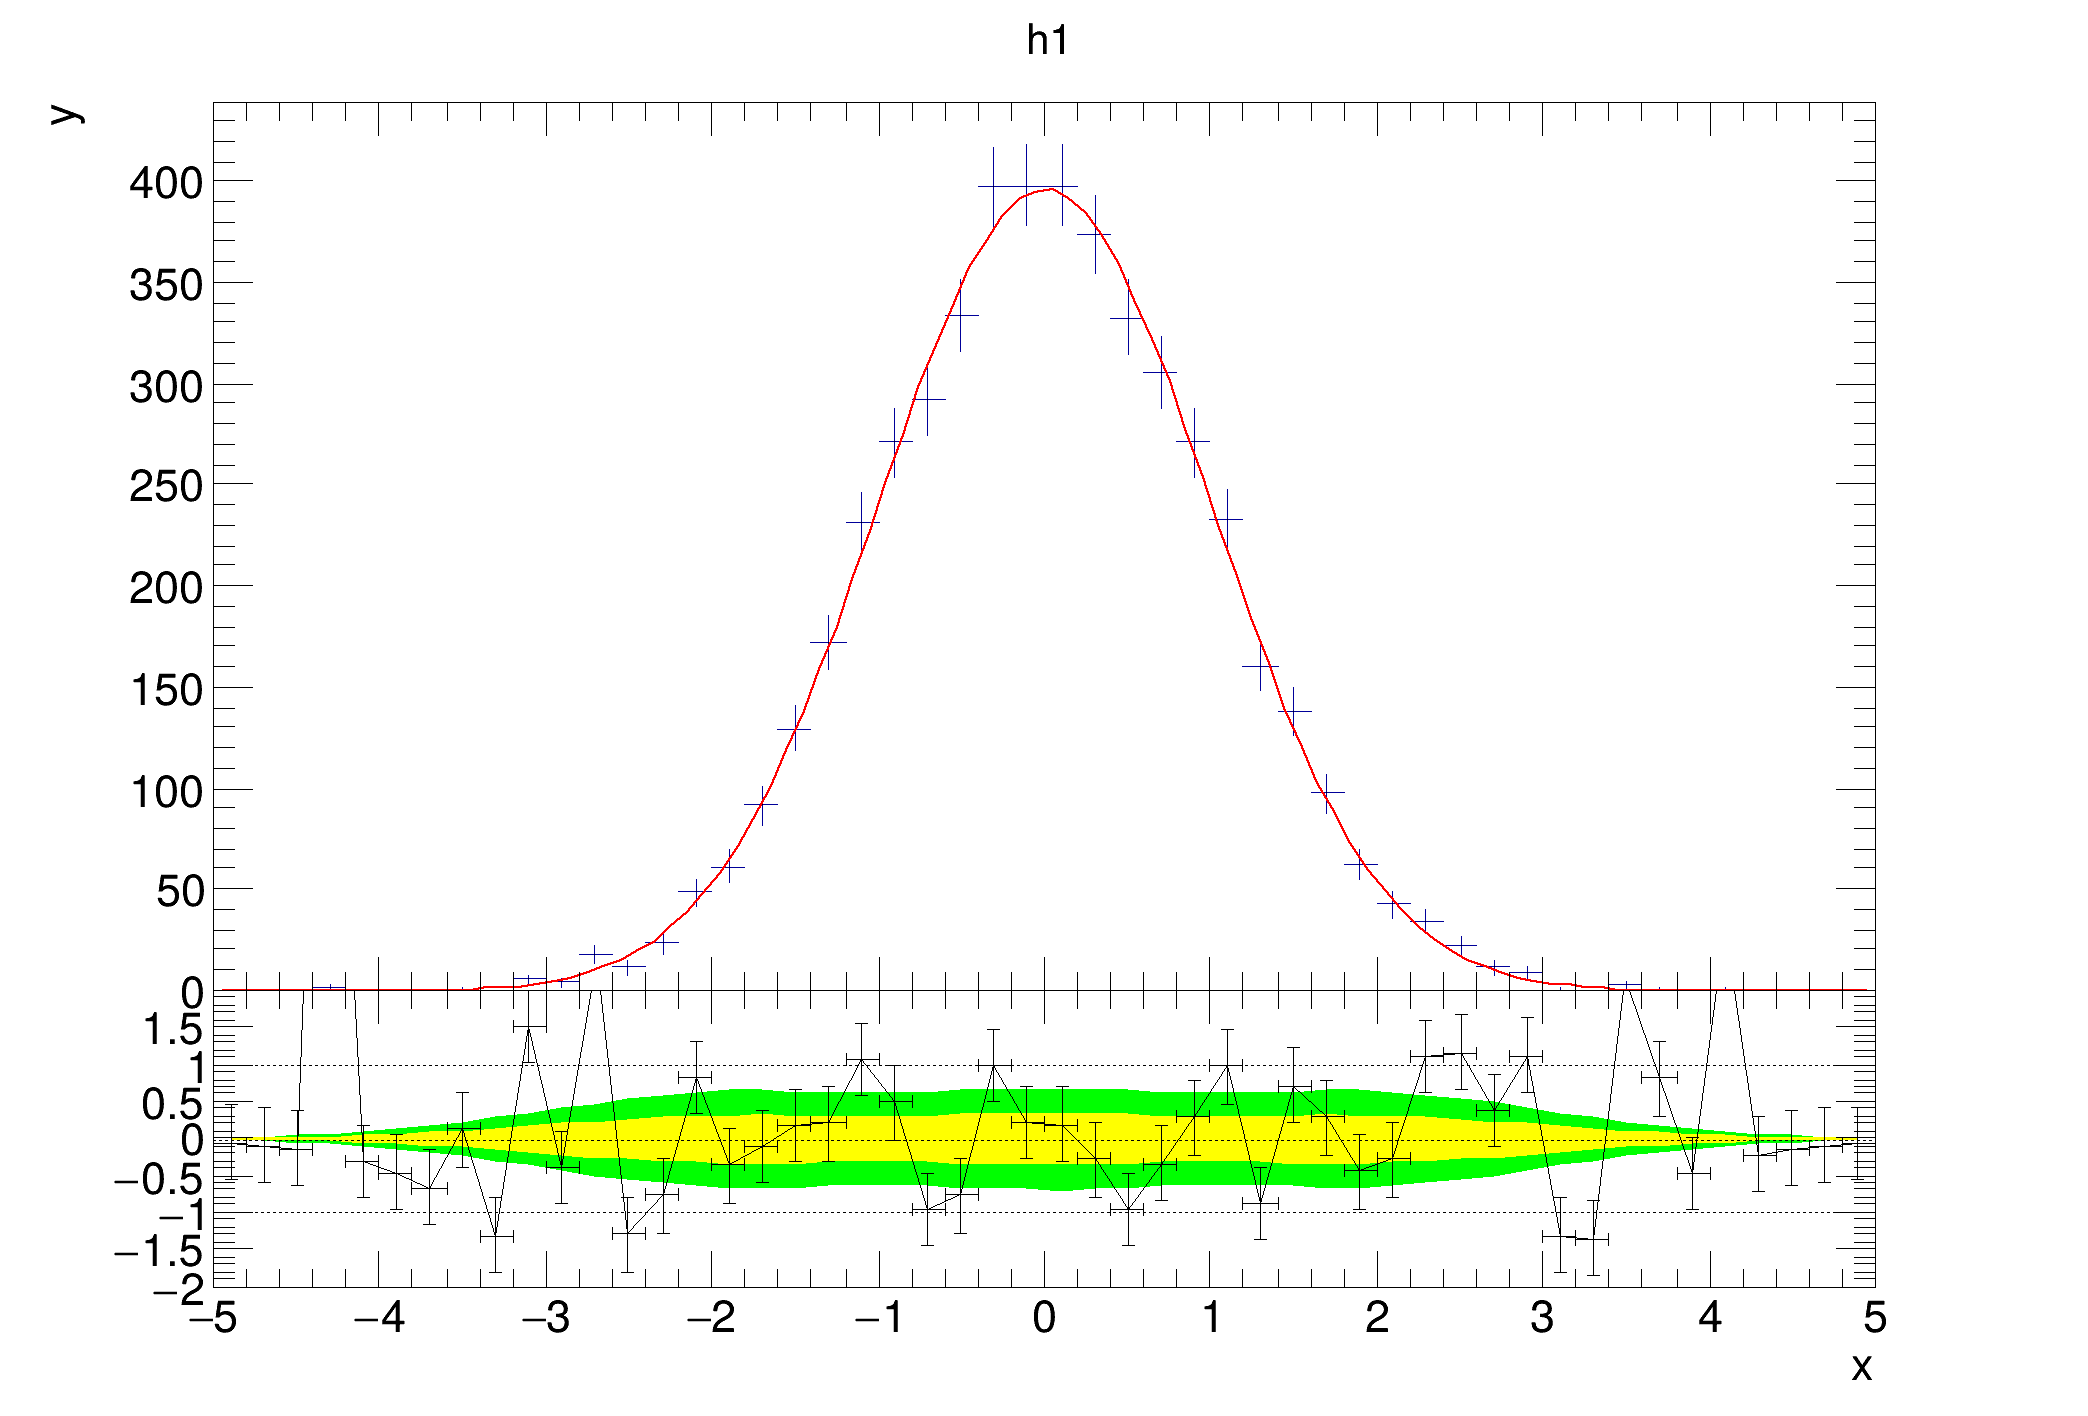
 Example showing a fit residual plot, where the separation margin has been set to 0.
The last label of the lower plot's y axis is hidden automatically.
void hist034_TRatioPlot_fit_margin()
{
auto c1 =
new TCanvas(
"c1",
"fit residual simple");
gPad->SetFrameFillStyle(0);
auto h1 =
new TH1D(
"h1",
"h1", 50, -5, 5);
h1->FillRandom(
"gaus", 5000);
h1->GetXaxis()->SetTitle(
"x");
h1->GetYaxis()->SetTitle(
"y");
rp1->SetGraphDrawOpt("L");
rp1->SetSeparationMargin(0.0);
rp1->Draw();
rp1->GetLowerRefGraph()->SetMinimum(-2);
rp1->GetLowerRefGraph()->SetMaximum(2);
}
Provides an indirection to the TFitResult class and with a semantics identical to a TFitResult pointe...
1-D histogram with a double per channel (see TH1 documentation)
- Date
- January 2020
- Author
- Paul Gessinger
Definition in file hist034_TRatioPlot_fit_margin.C.

