

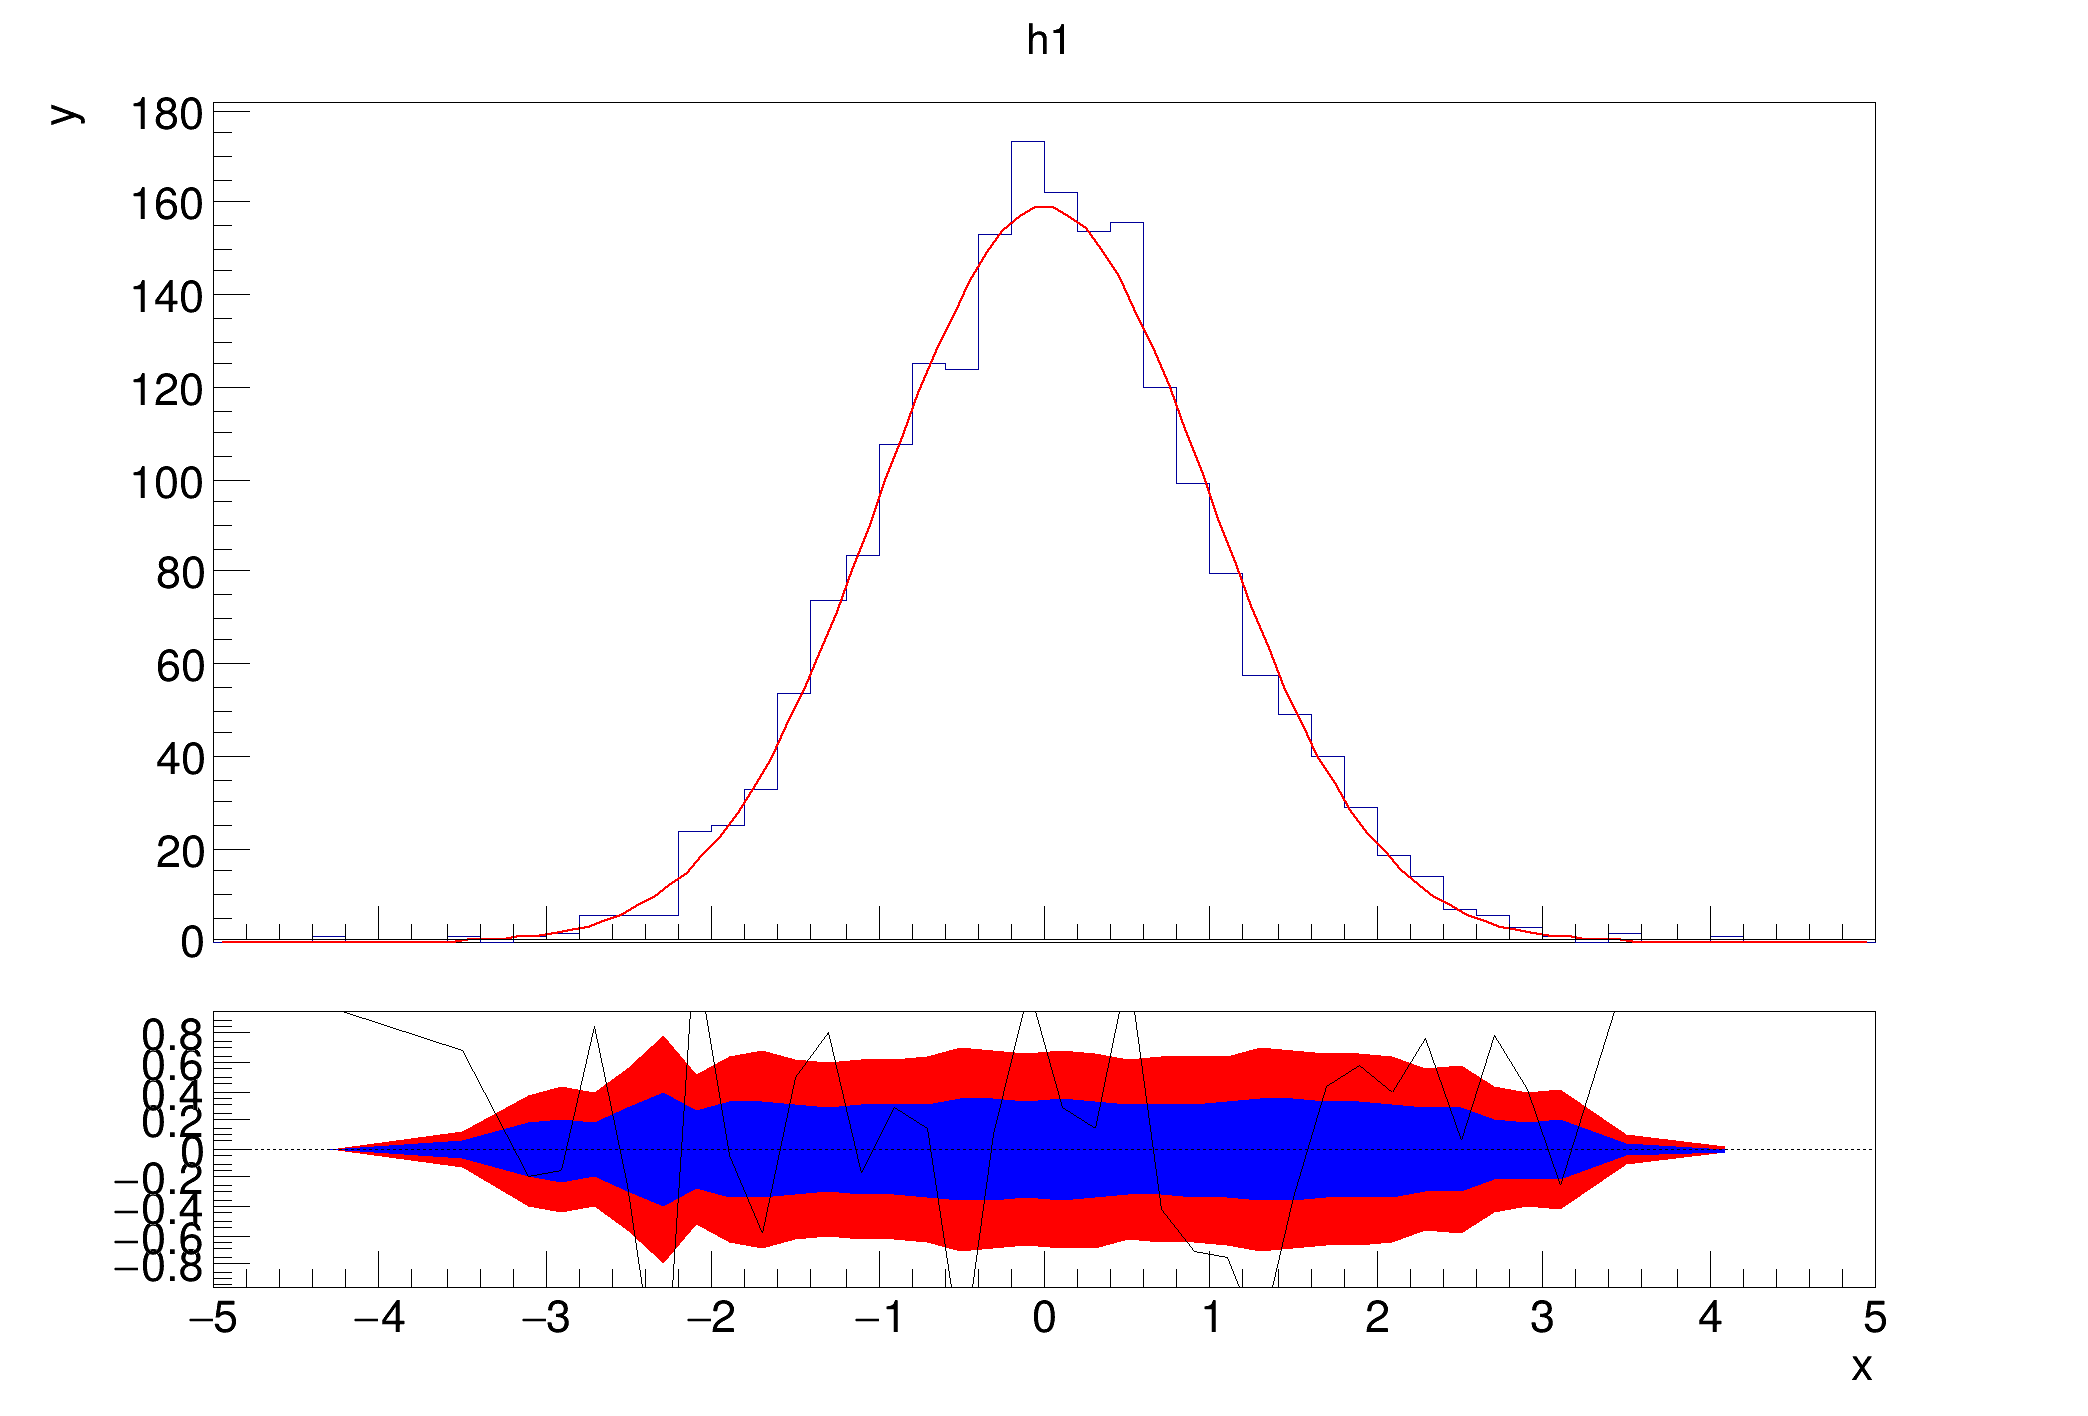
 Example that shows how you can set the colors of the confidence interval bands by using the method TRatioPlot::SetConfidenceIntervalColors.
void hist033_TRatioPlot_fit_confidence()
{
auto c1 =
new TCanvas(
"c1",
"fit residual simple");
auto h1 =
new TH1D(
"h1",
"h1", 50, -5, 5);
h1->FillRandom(
"gaus", 2000);
h1->GetXaxis()->SetTitle(
"x");
h1->GetYaxis()->SetTitle(
"y");
rp1->SetConfidenceIntervalColors(
kBlue,
kRed);
rp1->Draw();
}
1-D histogram with a double per channel (see TH1 documentation)
- Date
- January 2020
- Author
- Paul Gessinger
Definition in file hist033_TRatioPlot_fit_confidence.C.

