

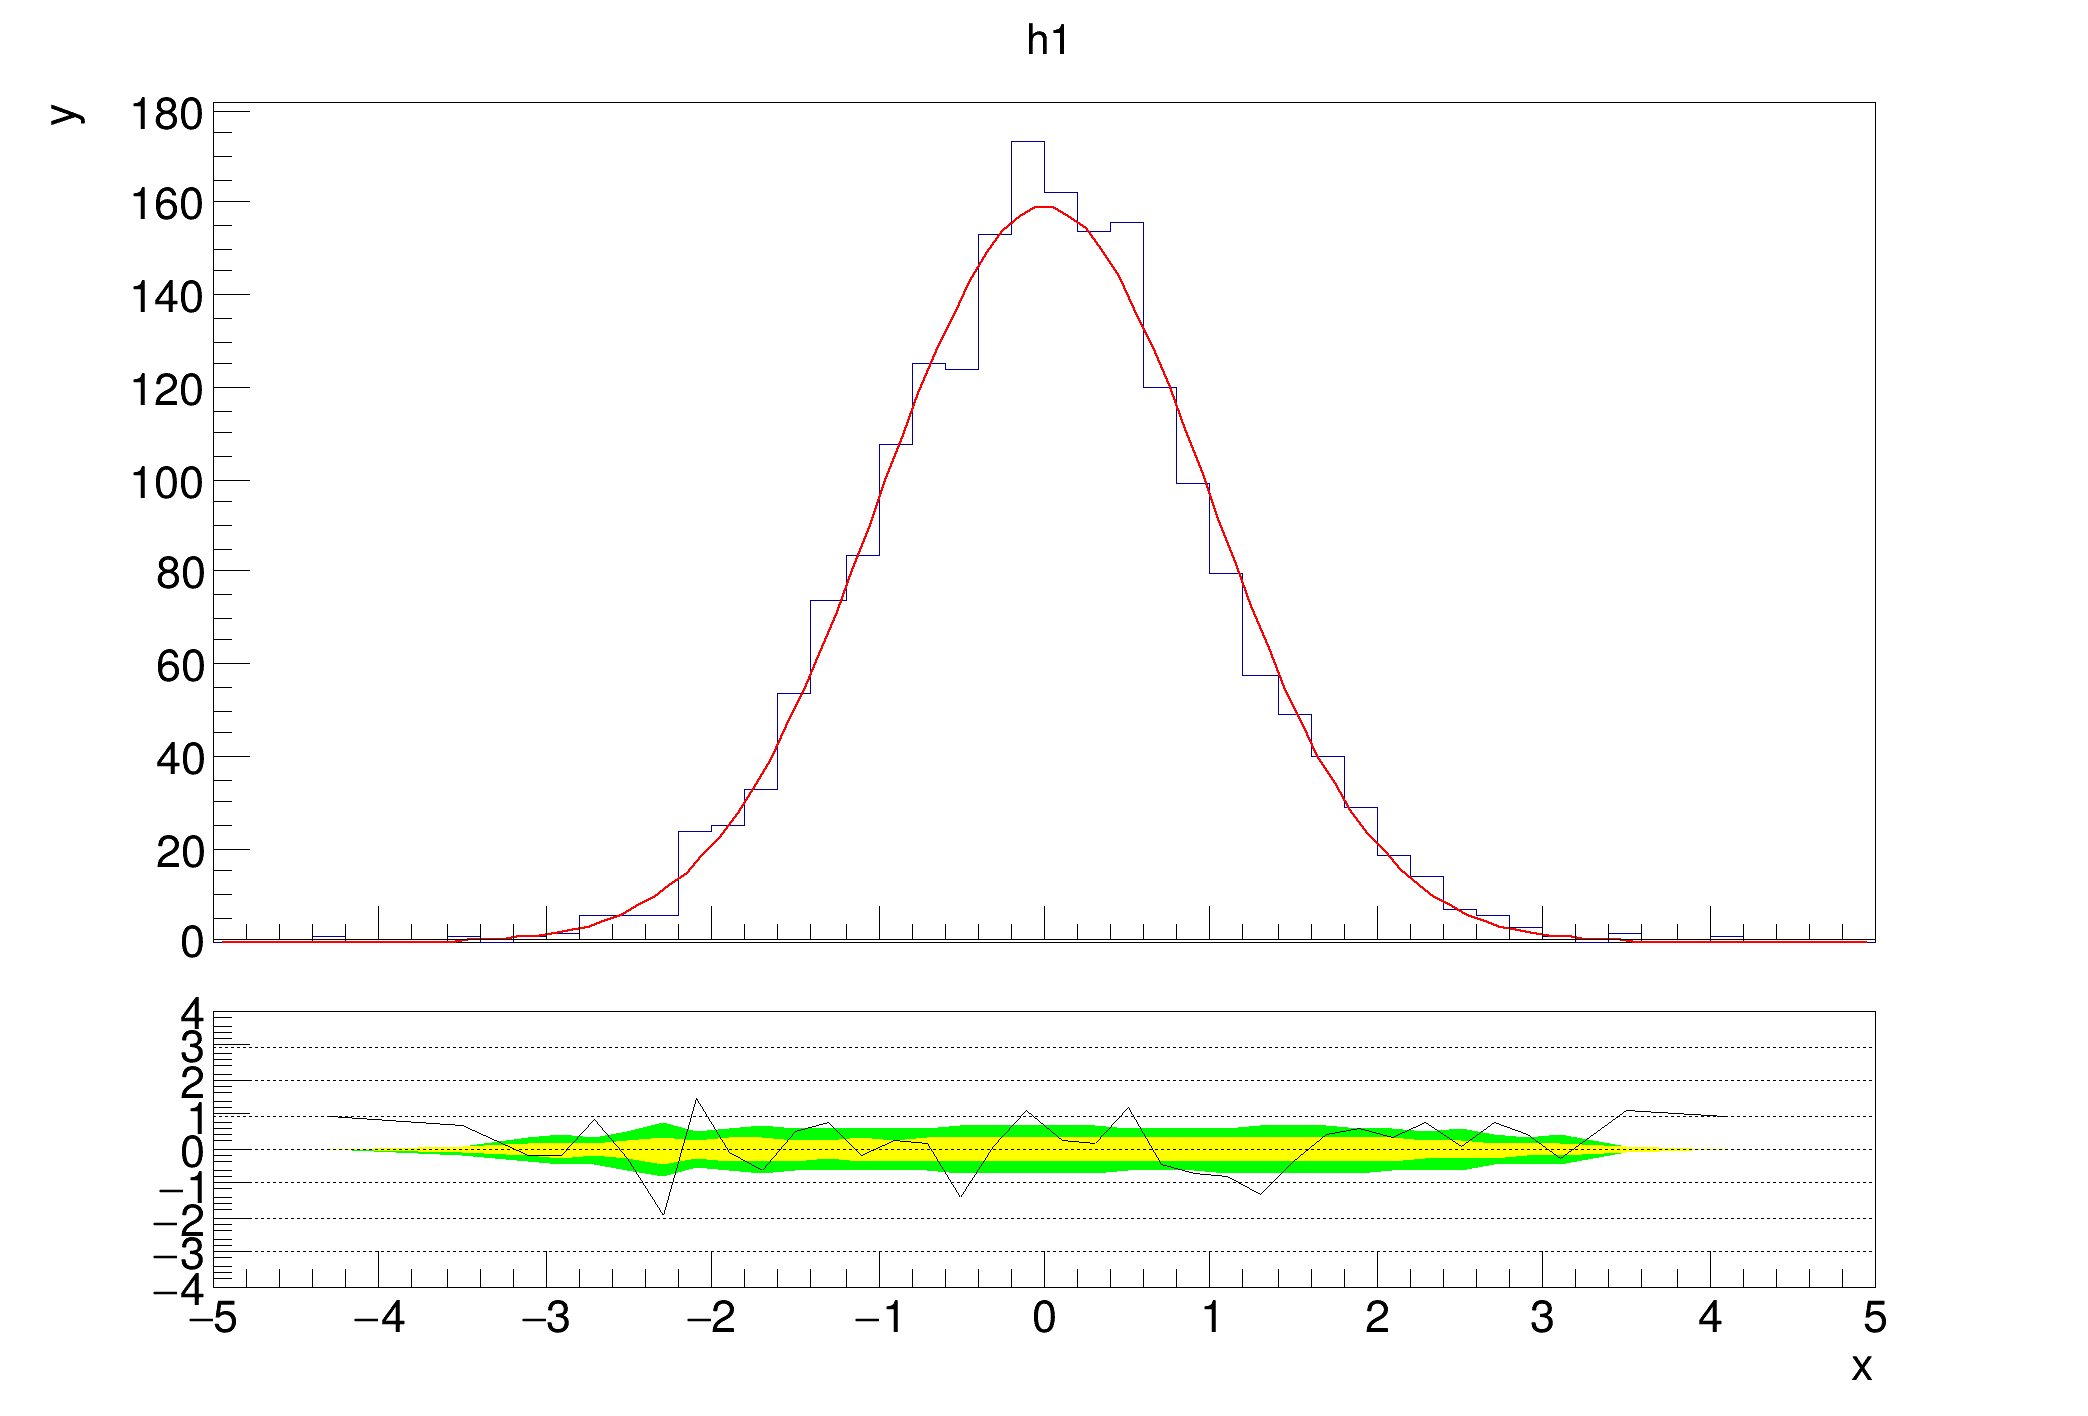
 Example that shows custom dashed lines on the lower plot, specified by a vector of floats.
By default, dashed lines are drawn at certain points. You can either disable them, or specify where you want them to appear.
void hist032_TRatioPlot_fit_lines()
{
auto c1 =
new TCanvas(
"c1",
"fit residual simple");
auto h1 =
new TH1D(
"h1",
"h1", 50, -5, 5);
h1->FillRandom(
"gaus", 2000);
h1->GetXaxis()->SetTitle(
"x");
h1->GetYaxis()->SetTitle(
"y");
std::vector<double> lines = {-3, -2, -1, 0, 1, 2, 3};
rp1->SetGridlines(lines);
rp1->Draw();
rp1->GetLowerRefGraph()->SetMinimum(-4);
rp1->GetLowerRefGraph()->SetMaximum(4);
}
1-D histogram with a double per channel (see TH1 documentation)
- Date
- January 2020
- Author
- Paul Gessinger
Definition in file hist032_TRatioPlot_fit_lines.C.

