

 Example creating a simple ratio plot of two histograms using the "pois" division option.
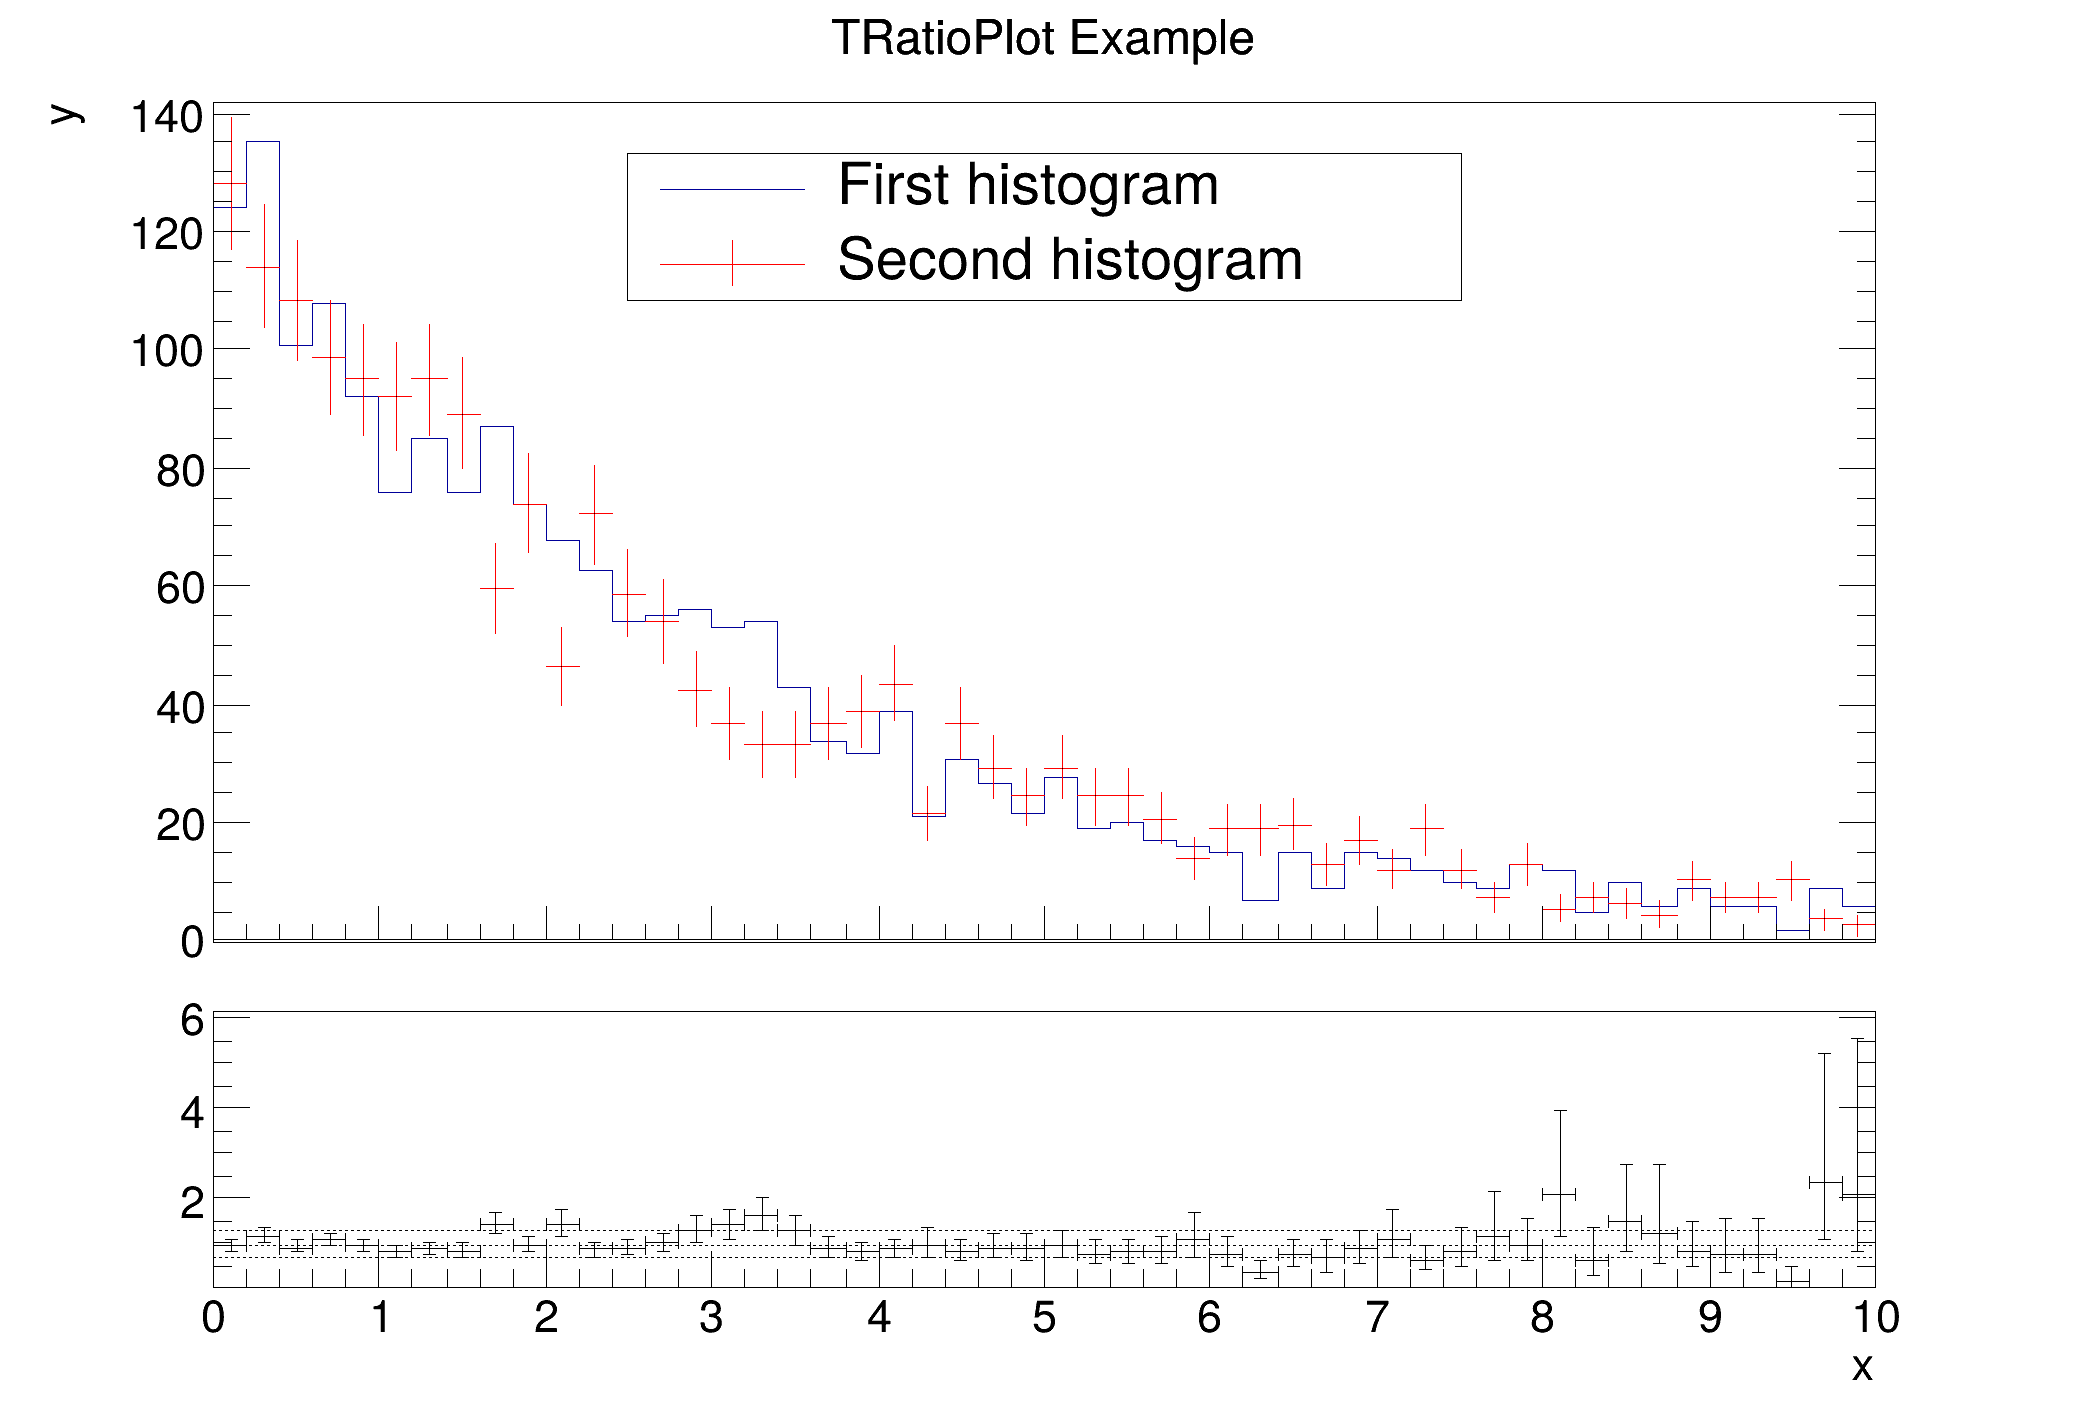
Two histograms are set up and filled with random numbers. The constructor of TRatioPlot takes the two histograms, name and title for the object, drawing options for the histograms (hist and E in this case) and a drawing option for the output graph. The histograms drawing options can be changed with SetH1DrawOpt and SetH2DrawOpt.
void hist029_TRatioPlot_simple()
{
auto C =
new TCanvas(
"C",
"A ratio example");
auto h1 =
new TH1D(
"h1",
"TRatioPlot Example; x; y", 50, 0, 10);
auto h2 =
new TH1D(
"h2",
"h2", 50, 0, 10);
auto f1 =
new TF1(
"f1",
"exp(- x/[0] )");
h1->FillRandom(
"f1", 1900);
h2->FillRandom("f1", 2000);
h2->Scale(1.9 / 2.);
C->SetTicks(0, 1);
rp->Draw();
rp->GetLowYaxis()->SetNdivisions(505);
rp->GetUpperPad()->cd();
legend->
AddEntry(
"h1",
"First histogram",
"l");
legend->
AddEntry(
"h2",
"Second histogram",
"le");
}
1-D histogram with a double per channel (see TH1 documentation)
TLegendEntry * AddEntry(const TObject *obj, const char *label="", Option_t *option="lpf")
void Draw(Option_t *option="") override
Draw this box with its current attributes.
- Date
- February 2023
- Author
- Paul Gessinger
Definition in file hist029_TRatioPlot_simple.C.

