

 When an histogram is drawn with the option COLZ, a palette is automatically drawn vertically on the right side of the plot.
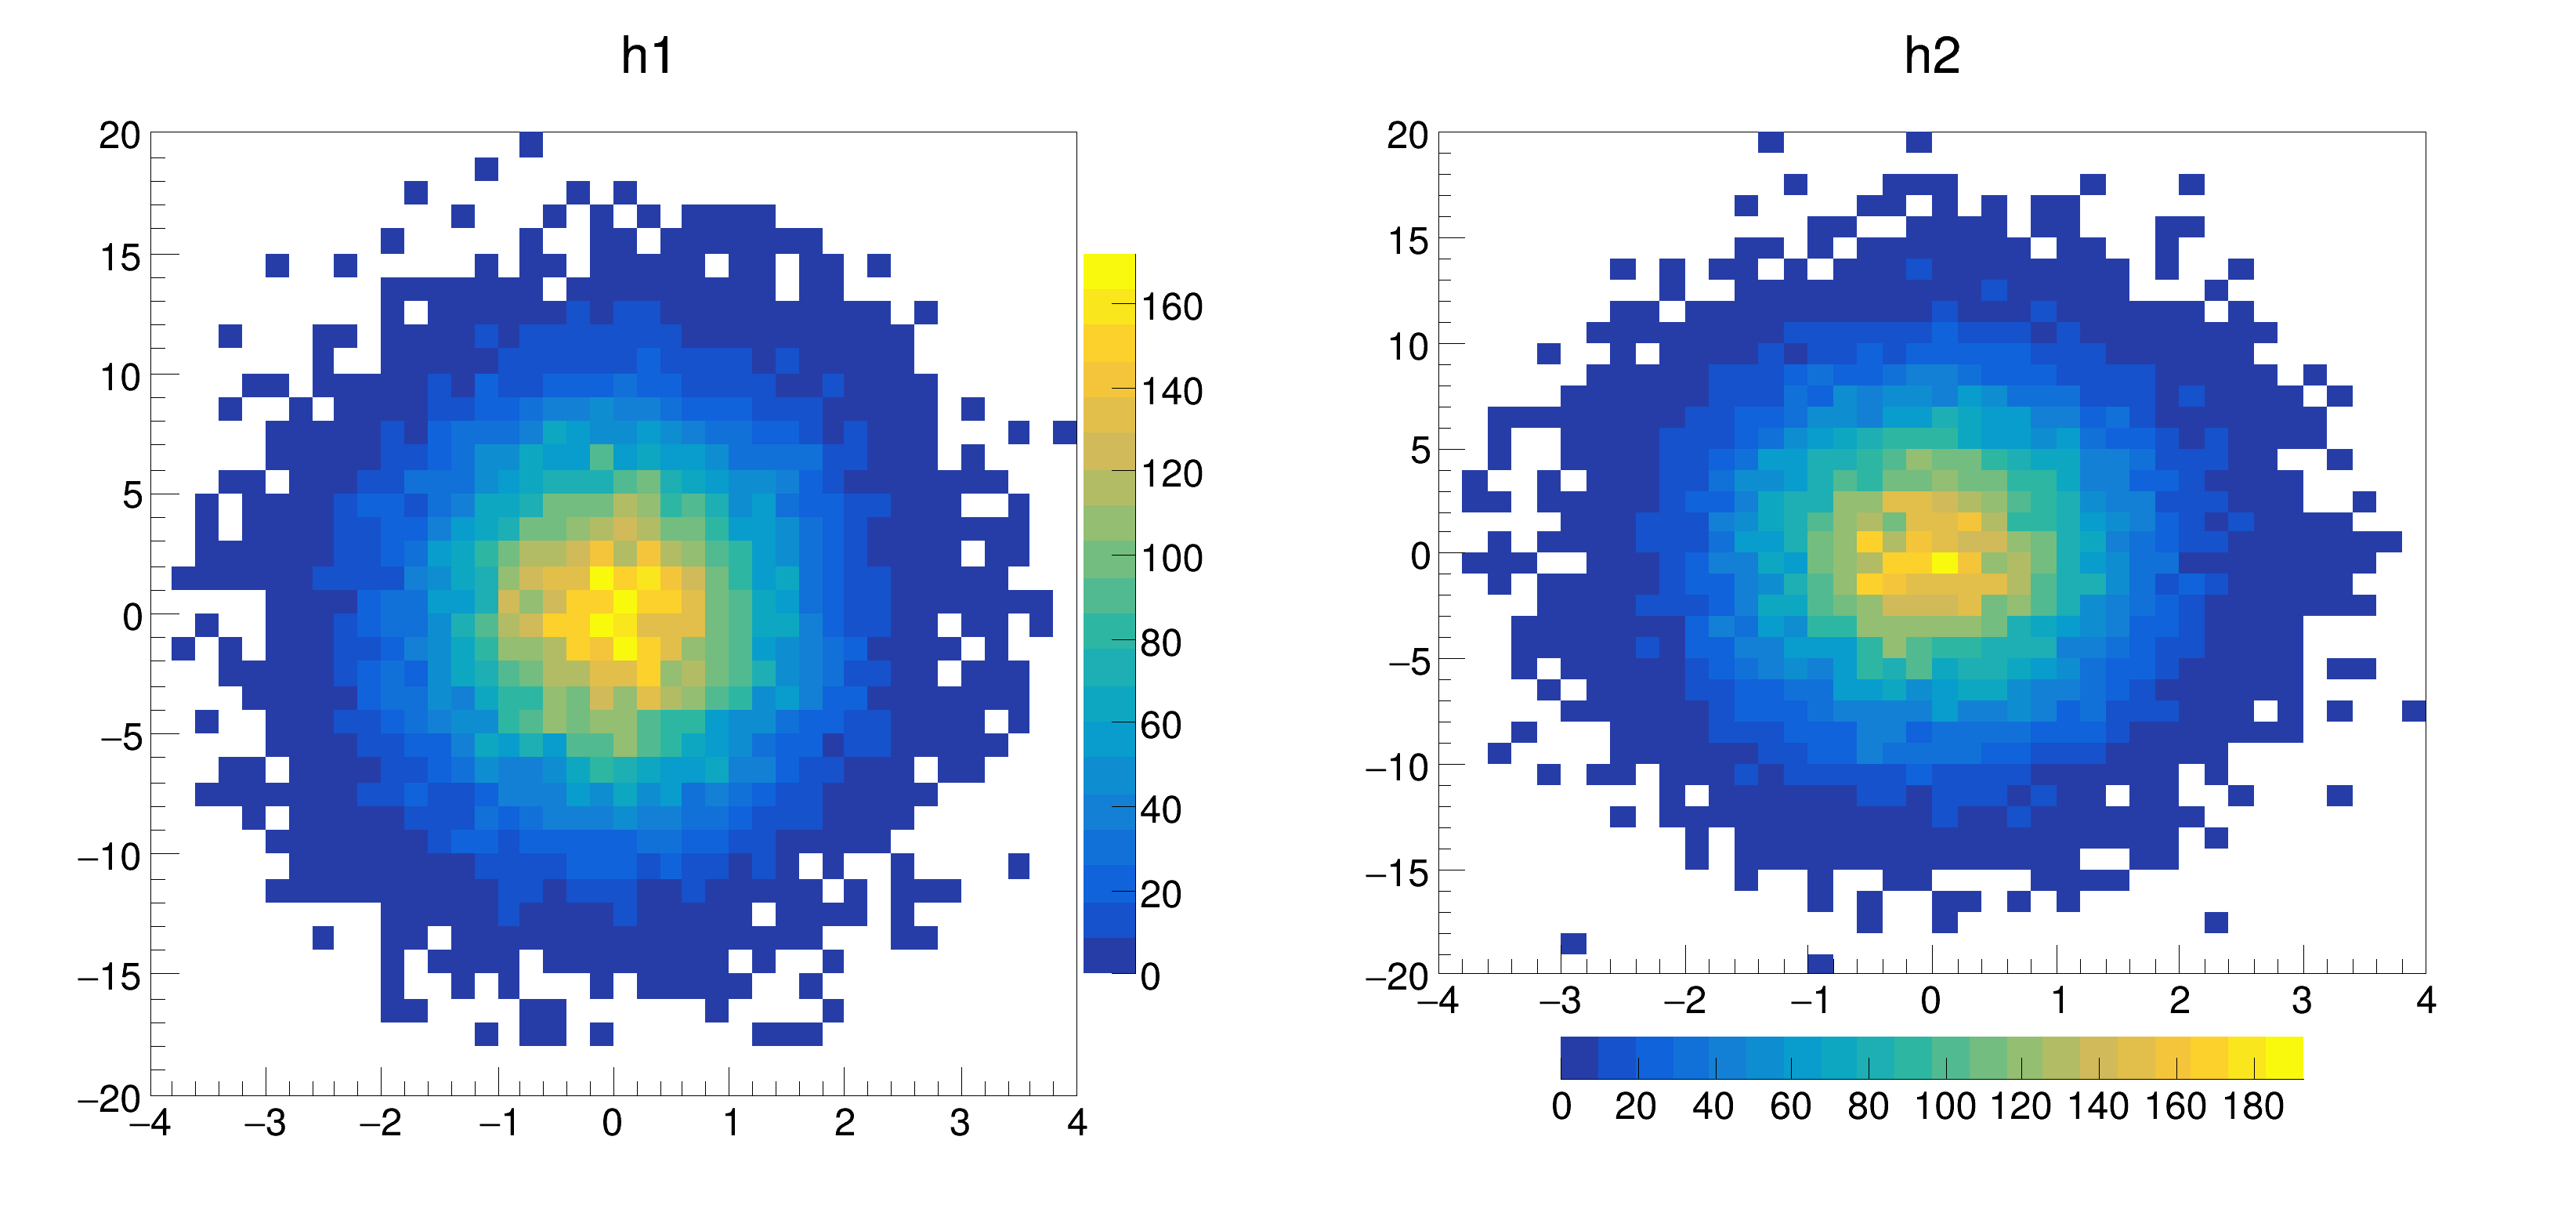
It is possible to move and resize this vertical palette as shown on the left plot. The right plot demonstrates that, when the width of the palette is larger than its height, the palette is automatically drawn horizontally.
void hist022_TH2_palette()
{
auto c =
new TCanvas(
"",
"", 0, 0, 1100, 550);
auto h1 =
new TH2D(
"h1",
"h1", 40, -4, 4, 40, -20, 20);
auto h2 =
new TH2D(
"h2",
"h2", 40, -4, 4, 40, -20, 20);
float px, py;
for (int i = 0; i < 25000; i++) {
h2->Fill(px, 5 * py);
}
h1->GetListOfFunctions()->Add(palette1);
h2->GetListOfFunctions()->Add(palette2);
}
virtual void SetBottomMargin(Float_t bottommargin)
Set Pad bottom margin in fraction of the pad height.
virtual void SetRightMargin(Float_t rightmargin)
Set Pad right margin in fraction of the pad width.
2-D histogram with a double per channel (see TH1 documentation)
The most important graphics class in the ROOT system.
TVirtualPad * cd(Int_t subpadnumber=0) override
Set Current pad.
void Draw(Option_t *option="") override=0
Default Draw method for all objects.
- Date
- October 2024
- Author
- Olivier Couet
Definition in file hist022_TH2_palette.C.

