

 This tutorial demonstrates how to set a logarithmic scale for the axes of a graph using the SetLogScale() method.
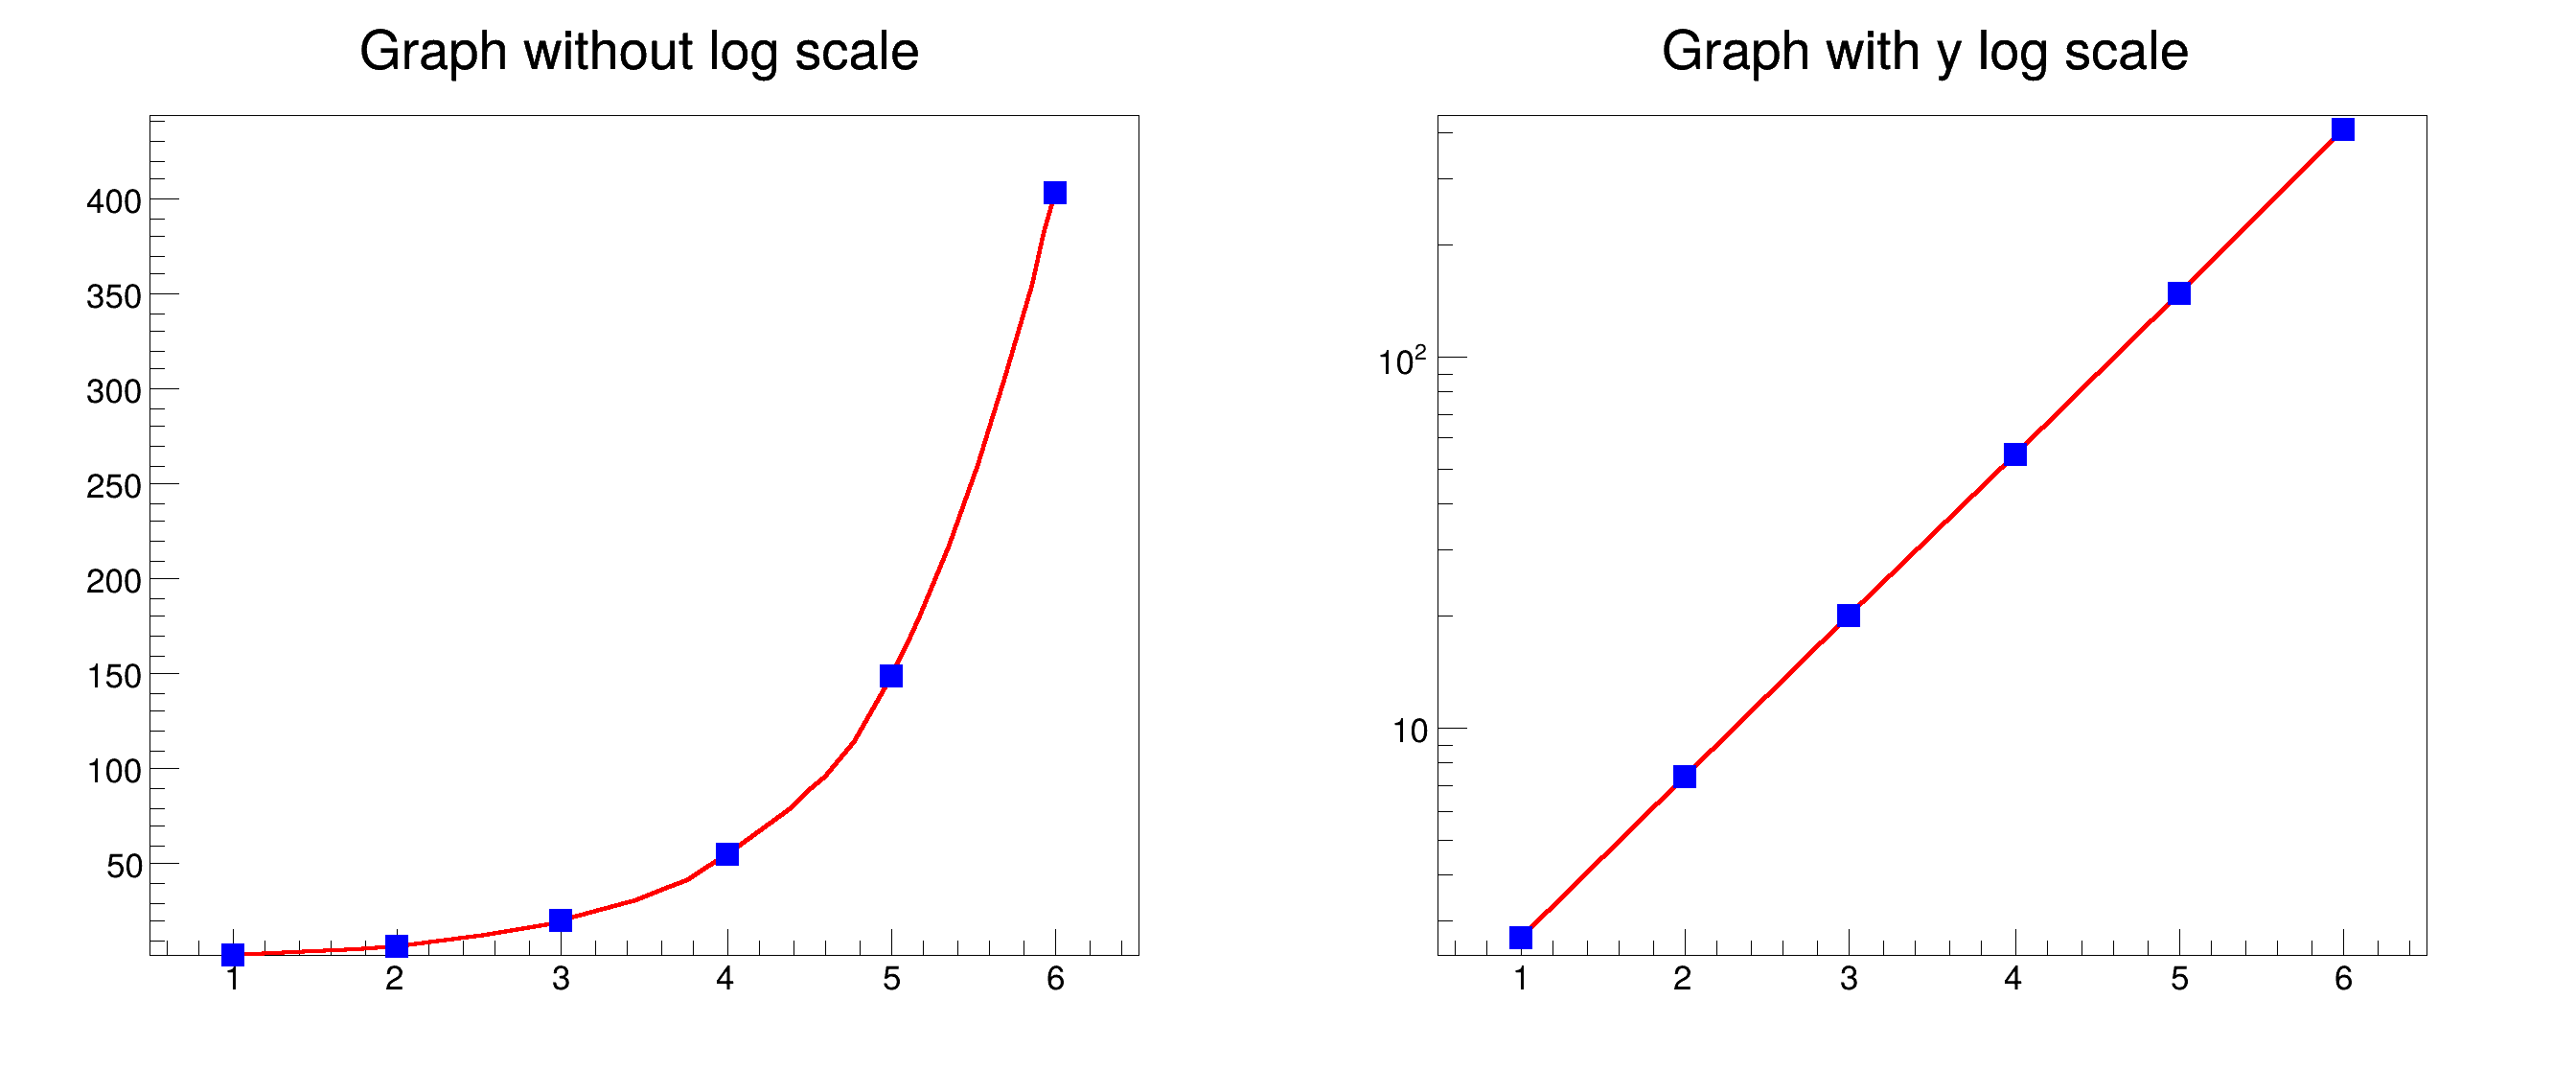
The logarithmic scale can be applied to either the x-axis, the y-axis, or both axes at the same time. When using a logarithmic scale, the data must be positive since the logarithm is undefined for non-positive values and zero.
void gr110_logscale() {
auto c =
new TCanvas(
"c",
"Reversed graphs",0,0,900,400);
}
gr1->
SetTitle(
"Graph without log scale");
gr1->
SetTitle(
"Graph with y log scale");
}
int Int_t
Signed integer 4 bytes (int).
double Double_t
Double 8 bytes.
virtual void SetLineWidth(Width_t lwidth)
Set the line width.
virtual void SetLineColor(Color_t lcolor)
Set the line color.
virtual void SetMarkerColor(Color_t mcolor=1)
Set the marker color.
virtual void SetMarkerStyle(Style_t mstyle=1)
Set the marker style.
void Draw(Option_t *chopt="") override
Default Draw method for all objects.
void SetTitle(const char *title="") override
Set the title of the TNamed.
virtual TObject * DrawClone(Option_t *option="") const
Draw a clone of this object in the current selected pad with: gROOT->SetSelectedPad(c1).
- Date
- 25/11/2024
- Author
- Emanuele Chiamulera
Definition in file gr110_logscale.C.

