

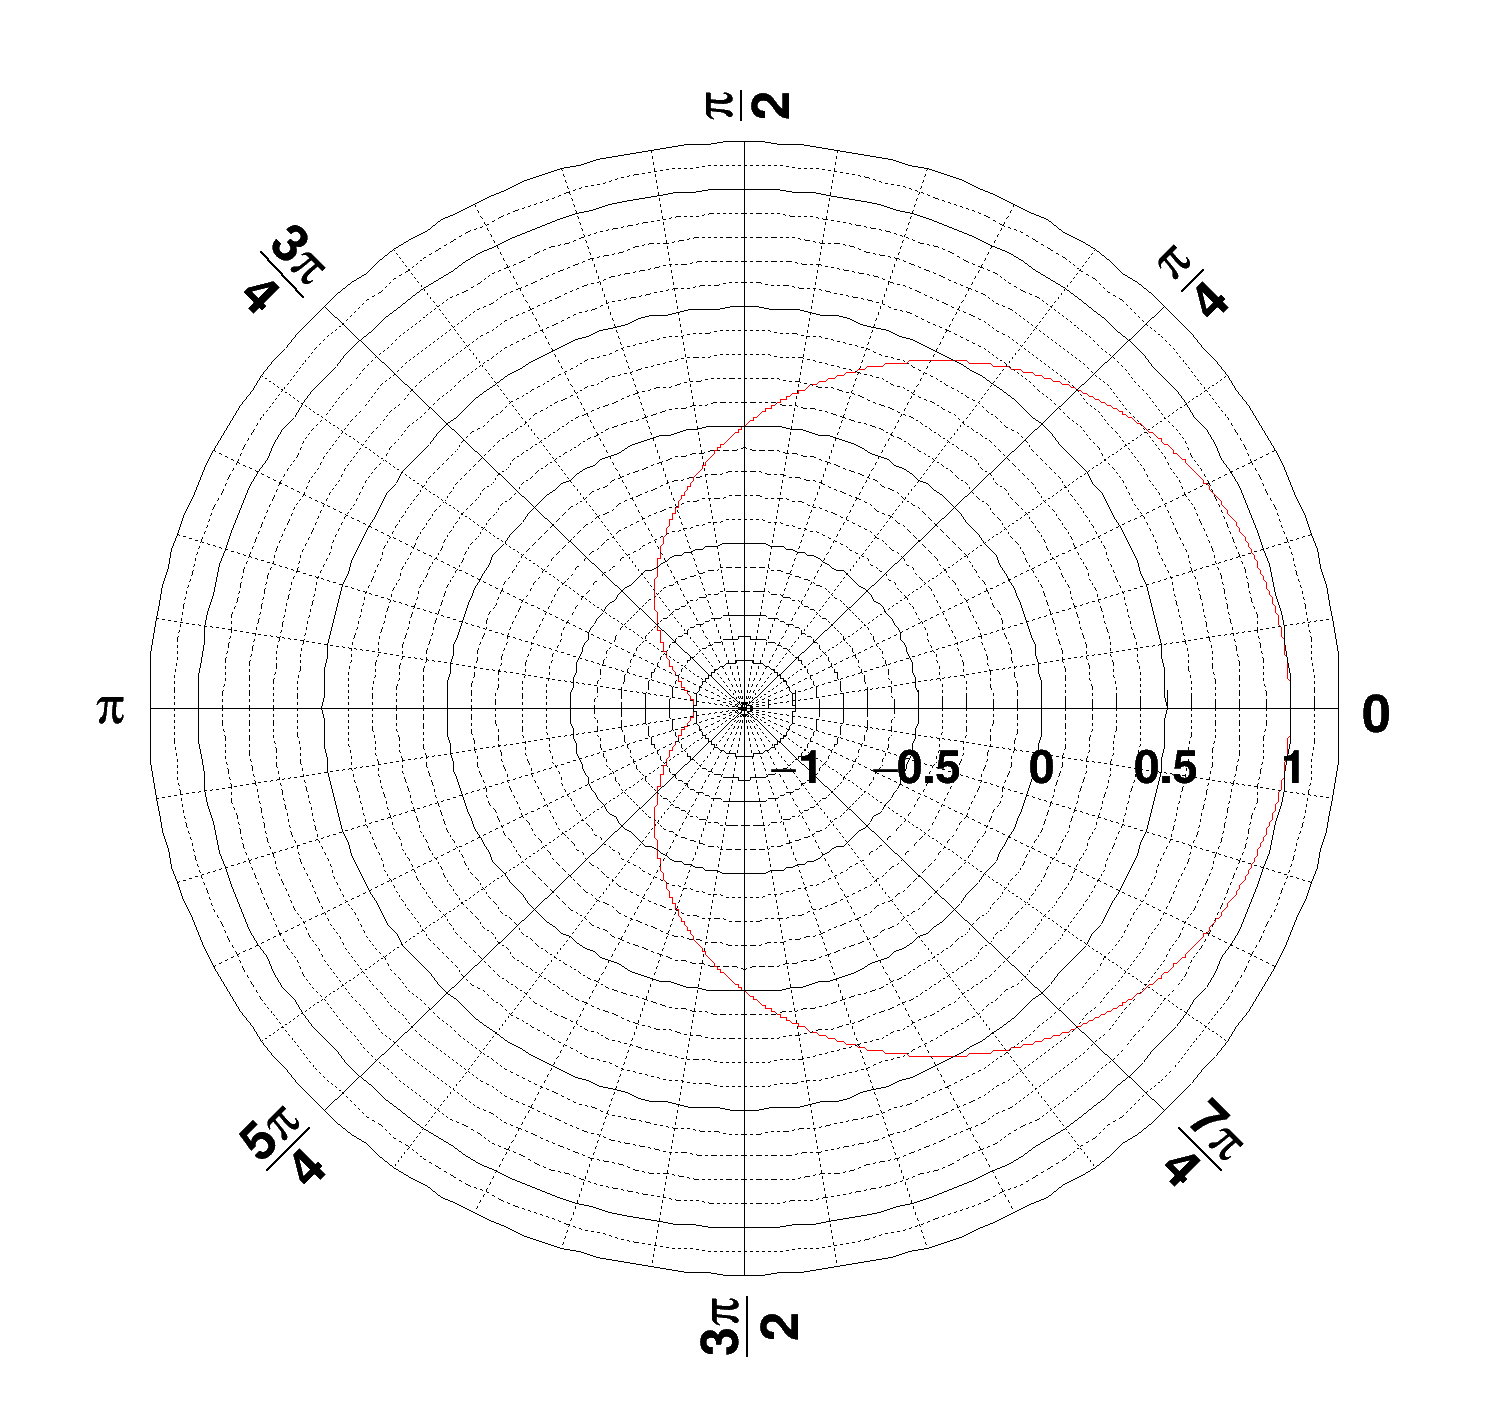
 Create a polar graph using a TF1 and draw it with PI axis.
See the TGraphPolar documentation
Since TGraphPolar is a TGraphErrors, it is painted with TGraphPainter options.
␈Çç\␅
import math
import numpy as np
import ROOT
CPol = ROOT.TCanvas("CPol", "TGraphPolar Examples", 500, 500)
rmin = 0
rmax = math.pi * 2
r = np.array([])
theta = np.array([])
fp1 = ROOT.TF1("fplot", "cos(x)", rmin, rmax)
for ipt in range(1000):
r = np.append(r, ipt * (rmax - rmin) / 1000 + rmin)
theta = np.append(theta, fp1.Eval(r[ipt]))
grP1 = ROOT.TGraphPolar(1000, r, theta)
grP1.SetTitle("")
grP1.SetLineColor(2)
grP1.Draw("AOL")
- Author
- Olivier Couet, Jamie Gooding
Definition in file gr014_polar3.py.

