

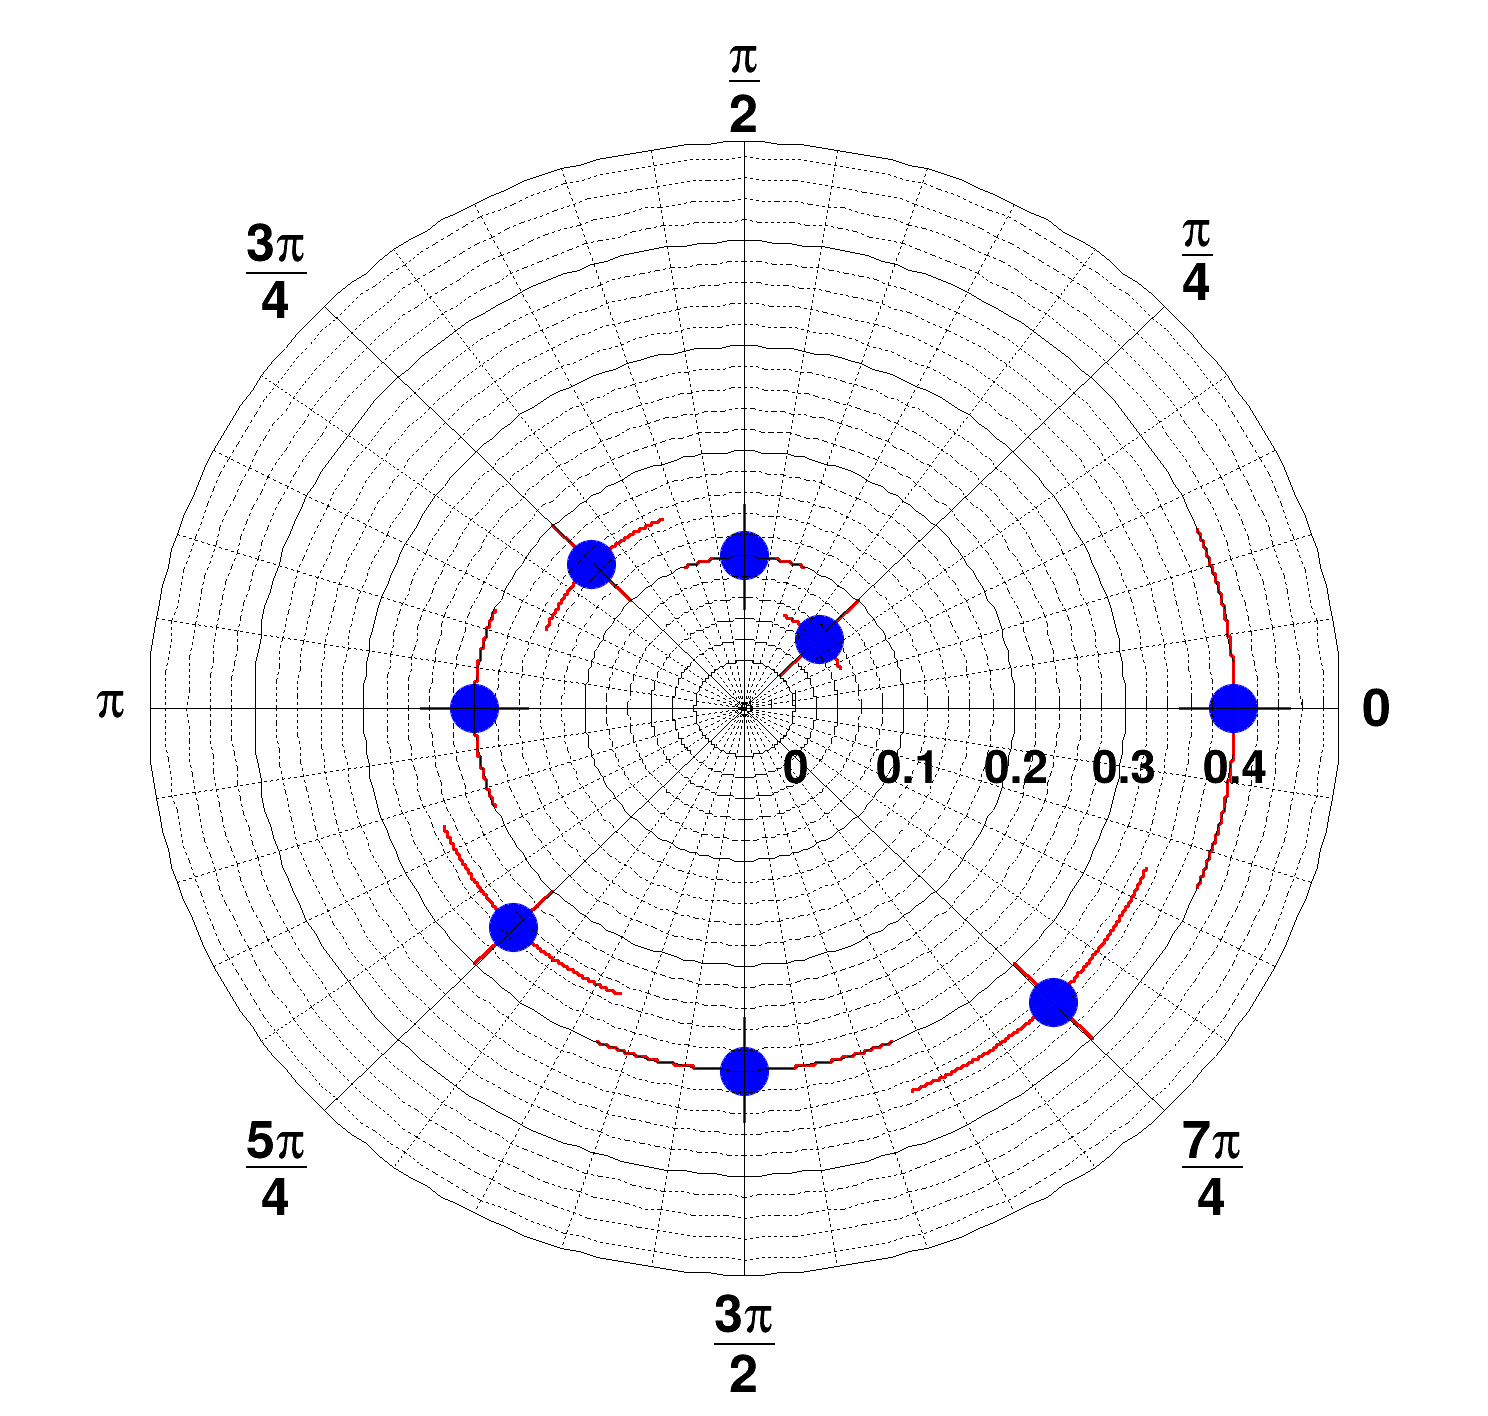
 Create and draw a polar graph with errors and polar axis in radians (PI fractions).
See the TGraphPolar documentation
Since TGraphPolar is a TGraphErrors, it is painted with TGraphPainter options.
With GetPolargram we retrieve the polar axis to format it see the TGraphPolargram documentation
import numpy as np
import ROOT
CPol = ROOT.TCanvas("CPol", "TGraphPolar Example", 500, 500)
theta = np.array([])
radius = np.array([])
etheta = np.array([])
eradius = np.array([])
for i in range(8):
theta = np.append(theta, (i + 1) * (np.pi / 4.0))
radius = np.append(radius, (i + 1) * 0.05)
etheta = np.append(etheta, np.pi / 8.0)
eradius = np.append(eradius, 0.05)
grP1 = ROOT.TGraphPolar(8, theta, radius, etheta, eradius)
grP1.SetTitle("")
grP1.SetMarkerStyle(20)
grP1.SetMarkerSize(2.0)
grP1.SetMarkerColor(4)
grP1.SetLineColor(2)
grP1.SetLineWidth(3)
grP1.Draw("PE")
CPol.Update()
if grP1.GetPolargram():
grP1.GetPolargram().SetToRadian()
- Author
- Olivier Couet, Jamie Gooding
Definition in file gr013_polar2.py.

