

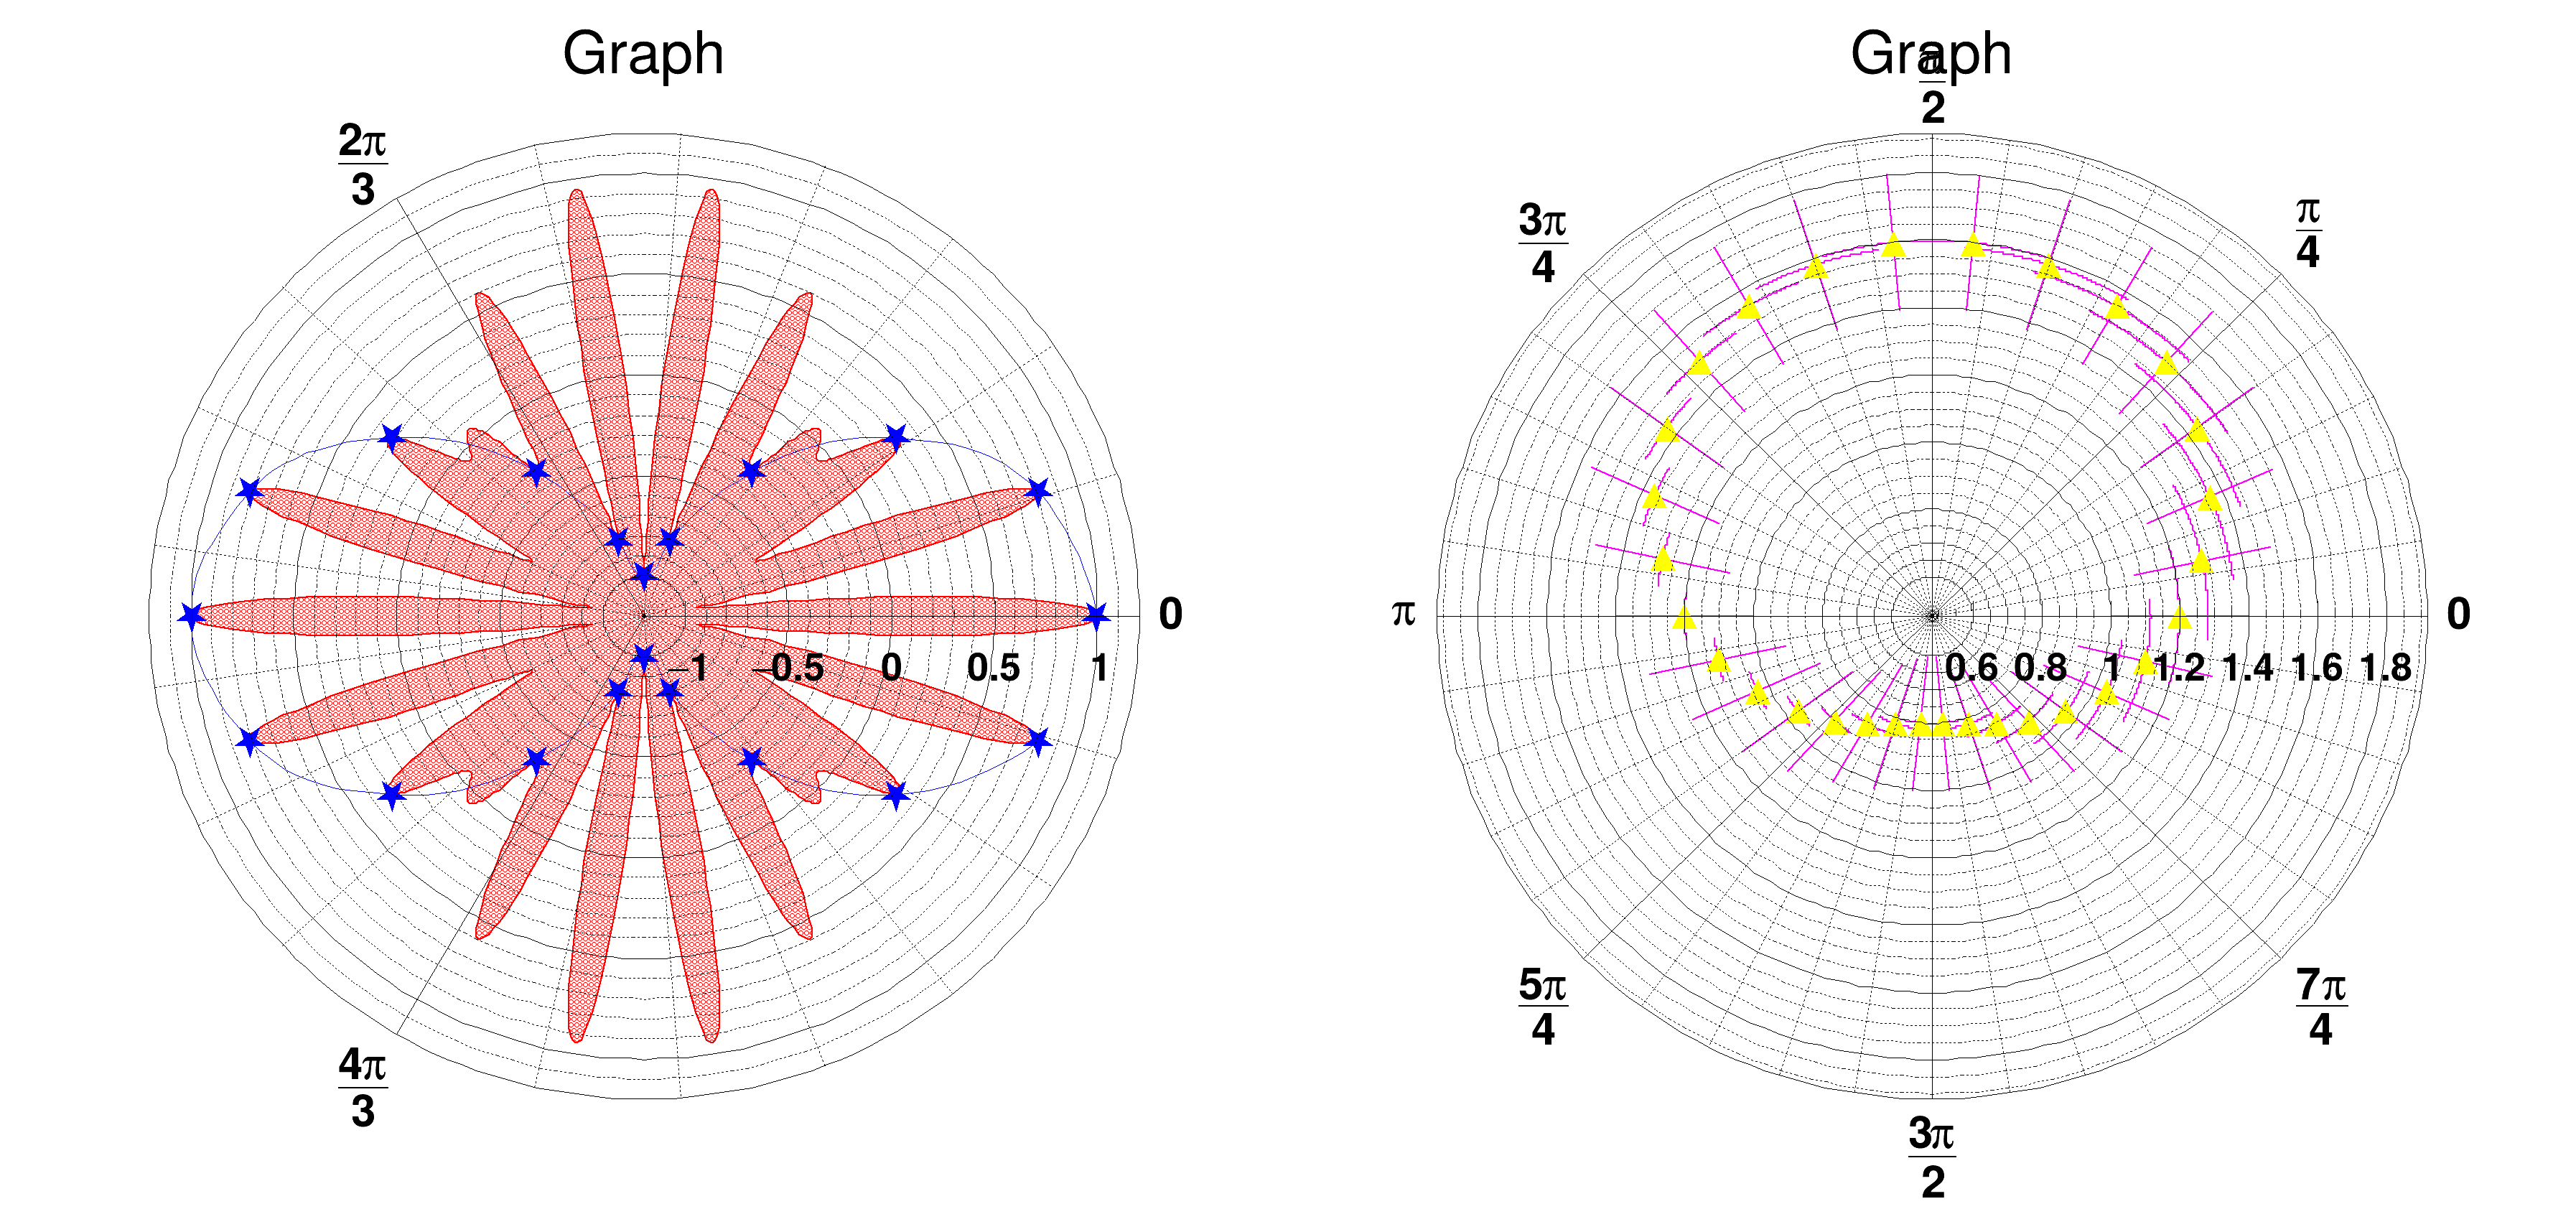
 Create and draw a polar graph.
See the TGraphPolar documentation
Since TGraphPolar is a TGraphErrors, it is painted with TGraphPainter options.
With GetPolargram we retrieve the polar axis to format it; see the TGraphPolargram documentation
h��I
import math
import numpy as np
import ROOT
CPol = ROOT.TCanvas("CPol", "TGraphPolar Examples", 1200, 600)
CPol.Divide(2, 1)
CPol.cd(1)
xmin = 0
xmax = math.pi * 2
x = np.array([])
y = np.array([])
xval1 = np.array([])
yval1 = np.array([])
fplot = ROOT.TF1("fplot", "cos(2*x)*cos(20*x)", xmin, xmax)
for ipt in range(1000):
x = np.append(x, ipt * (xmax - xmin) / 1000 + xmin)
y = np.append(y, fplot.Eval(x[ipt]))
grP = ROOT.TGraphPolar(1000, x, y)
grP.SetLineColor(2)
grP.SetLineWidth(2)
grP.SetFillStyle(3012)
grP.SetFillColor(2)
grP.Draw("AFL")
for ipt in range(20):
xval1 = np.append(xval1, x[math.floor(1000 / 20 * ipt)])
yval1 = np.append(yval1, y[math.floor(1000 / 20 * ipt)])
grP1 = ROOT.TGraphPolar(20, xval1, yval1)
grP1.SetMarkerStyle(29)
grP1.SetMarkerSize(2)
grP1.SetMarkerColor(4)
grP1.SetLineColor(4)
grP1.Draw("CP")
CPol.Update()
if grP1.GetPolargram():
grP1.GetPolargram().SetRangePolar(-math.pi, math.pi)
grP1.GetPolargram().SetNdivPolar(703)
grP1.GetPolargram().SetToRadian()
CPol.cd(2)
x2 = np.array([])
y2 = np.array([])
ex = np.array([])
ey = np.array([])
for ipt in range(30):
x2 = np.append(x2, x[math.floor(1000 / 30 * ipt)])
y2 = np.append(y2, 1.2 + 0.4 * math.sin(math.pi * 2 * ipt / 30))
ex = np.append(ex, 0.2 + 0.1 * math.cos(2 * math.pi / 30 * ipt))
ey = np.append(ey, 0.2)
grPE = ROOT.TGraphPolar(30, x2, y2, ex, ey)
grPE.SetMarkerStyle(22)
grPE.SetMarkerSize(1.5)
grPE.SetMarkerColor(5)
grPE.SetLineColor(6)
grPE.SetLineWidth(2)
grPE.Draw("EP")
CPol.Update()
if grPE.GetPolargram():
grPE.GetPolargram().SetTwoPi()
grPE.GetPolargram().SetToRadian()
Option_t Option_t SetTextSize
- Author
- Olivier Couet, Jamie Gooding
Definition in file gr012_polar.py.

