Allowing to overlay different graphs can be useful for comparing different datasets or for plotting multiple related graphs on the same canvas.
import numpy as np
import ROOT
ROOT.gStyle.SetOptFit()
c1 = ROOT.TCanvas("c1", "multigraph", 700, 500)
c1.SetGrid()
mg = ROOT.TMultiGraph()
n1 = 10
px1 = np.array([-0.1, 0.05, 0.25, 0.35, 0.5, 0.61, 0.7, 0.85, 0.89, 0.95])
py1 = np.array([-1, 2.9, 5.6, 7.4, 9, 9.6, 8.7, 6.3, 4.5, 1])
ex1 = np.array([0.05, 0.1, 0.07, 0.07, 0.04, 0.05, 0.06, 0.07, 0.08, 0.05])
ey1 = np.array([0.8, 0.7, 0.6, 0.5, 0.4, 0.4, 0.5, 0.6, 0.7, 0.8])
gr1 = ROOT.TGraphErrors(n1, px1, py1, ex1, ey1)
gr1.SetMarkerColor(ROOT.kBlue)
gr1.SetMarkerStyle(21)
gr1.Fit("gaus", "q")
func1 = gr1.GetListOfFunctions().FindObject("gaus")
func1.SetLineColor(ROOT.kBlue)
mg.Add(gr1)
n2 = 10
x2 = np.array([-0.28, 0.005, 0.19, 0.29, 0.45, 0.56, 0.65, 0.80, 0.90, 1.01])
y2 = np.array([2.1, 3.86, 7, 9, 10, 10.55, 9.64, 7.26, 5.42, 2])
ex2 = np.array([0.04, 0.12, 0.08, 0.06, 0.05, 0.04, 0.07, 0.06, 0.08, 0.04])
ey2 = np.array([0.6, 0.8, 0.7, 0.4, 0.3, 0.3, 0.4, 0.5, 0.6, 0.7])
gr2 = ROOT.TGraphErrors(n2, x2, y2, ex2, ey2)
gr2.SetMarkerColor(ROOT.kRed)
gr2.SetMarkerStyle(20)
gr2.Fit("pol5", "q")
func2 = gr2.GetListOfFunctions().FindObject("pol5")
func2.SetLineColor(ROOT.kRed)
func2.SetLineStyle(2)
mg.Add(gr2)
mg.Draw("ap")
c1.Update()
stats1 = gr1.GetListOfFunctions().FindObject("stats")
stats2 = gr2.GetListOfFunctions().FindObject("stats")
if stats1 and stats2:
stats1.SetTextColor(ROOT.kBlue)
stats2.SetTextColor(ROOT.kRed)
stats1.SetX1NDC(0.12)
stats1.SetX2NDC(0.32)
stats1.SetY1NDC(0.82)
stats2.SetX1NDC(0.72)
stats2.SetX2NDC(0.92)
stats2.SetY1NDC(0.75)
c1.Modified()

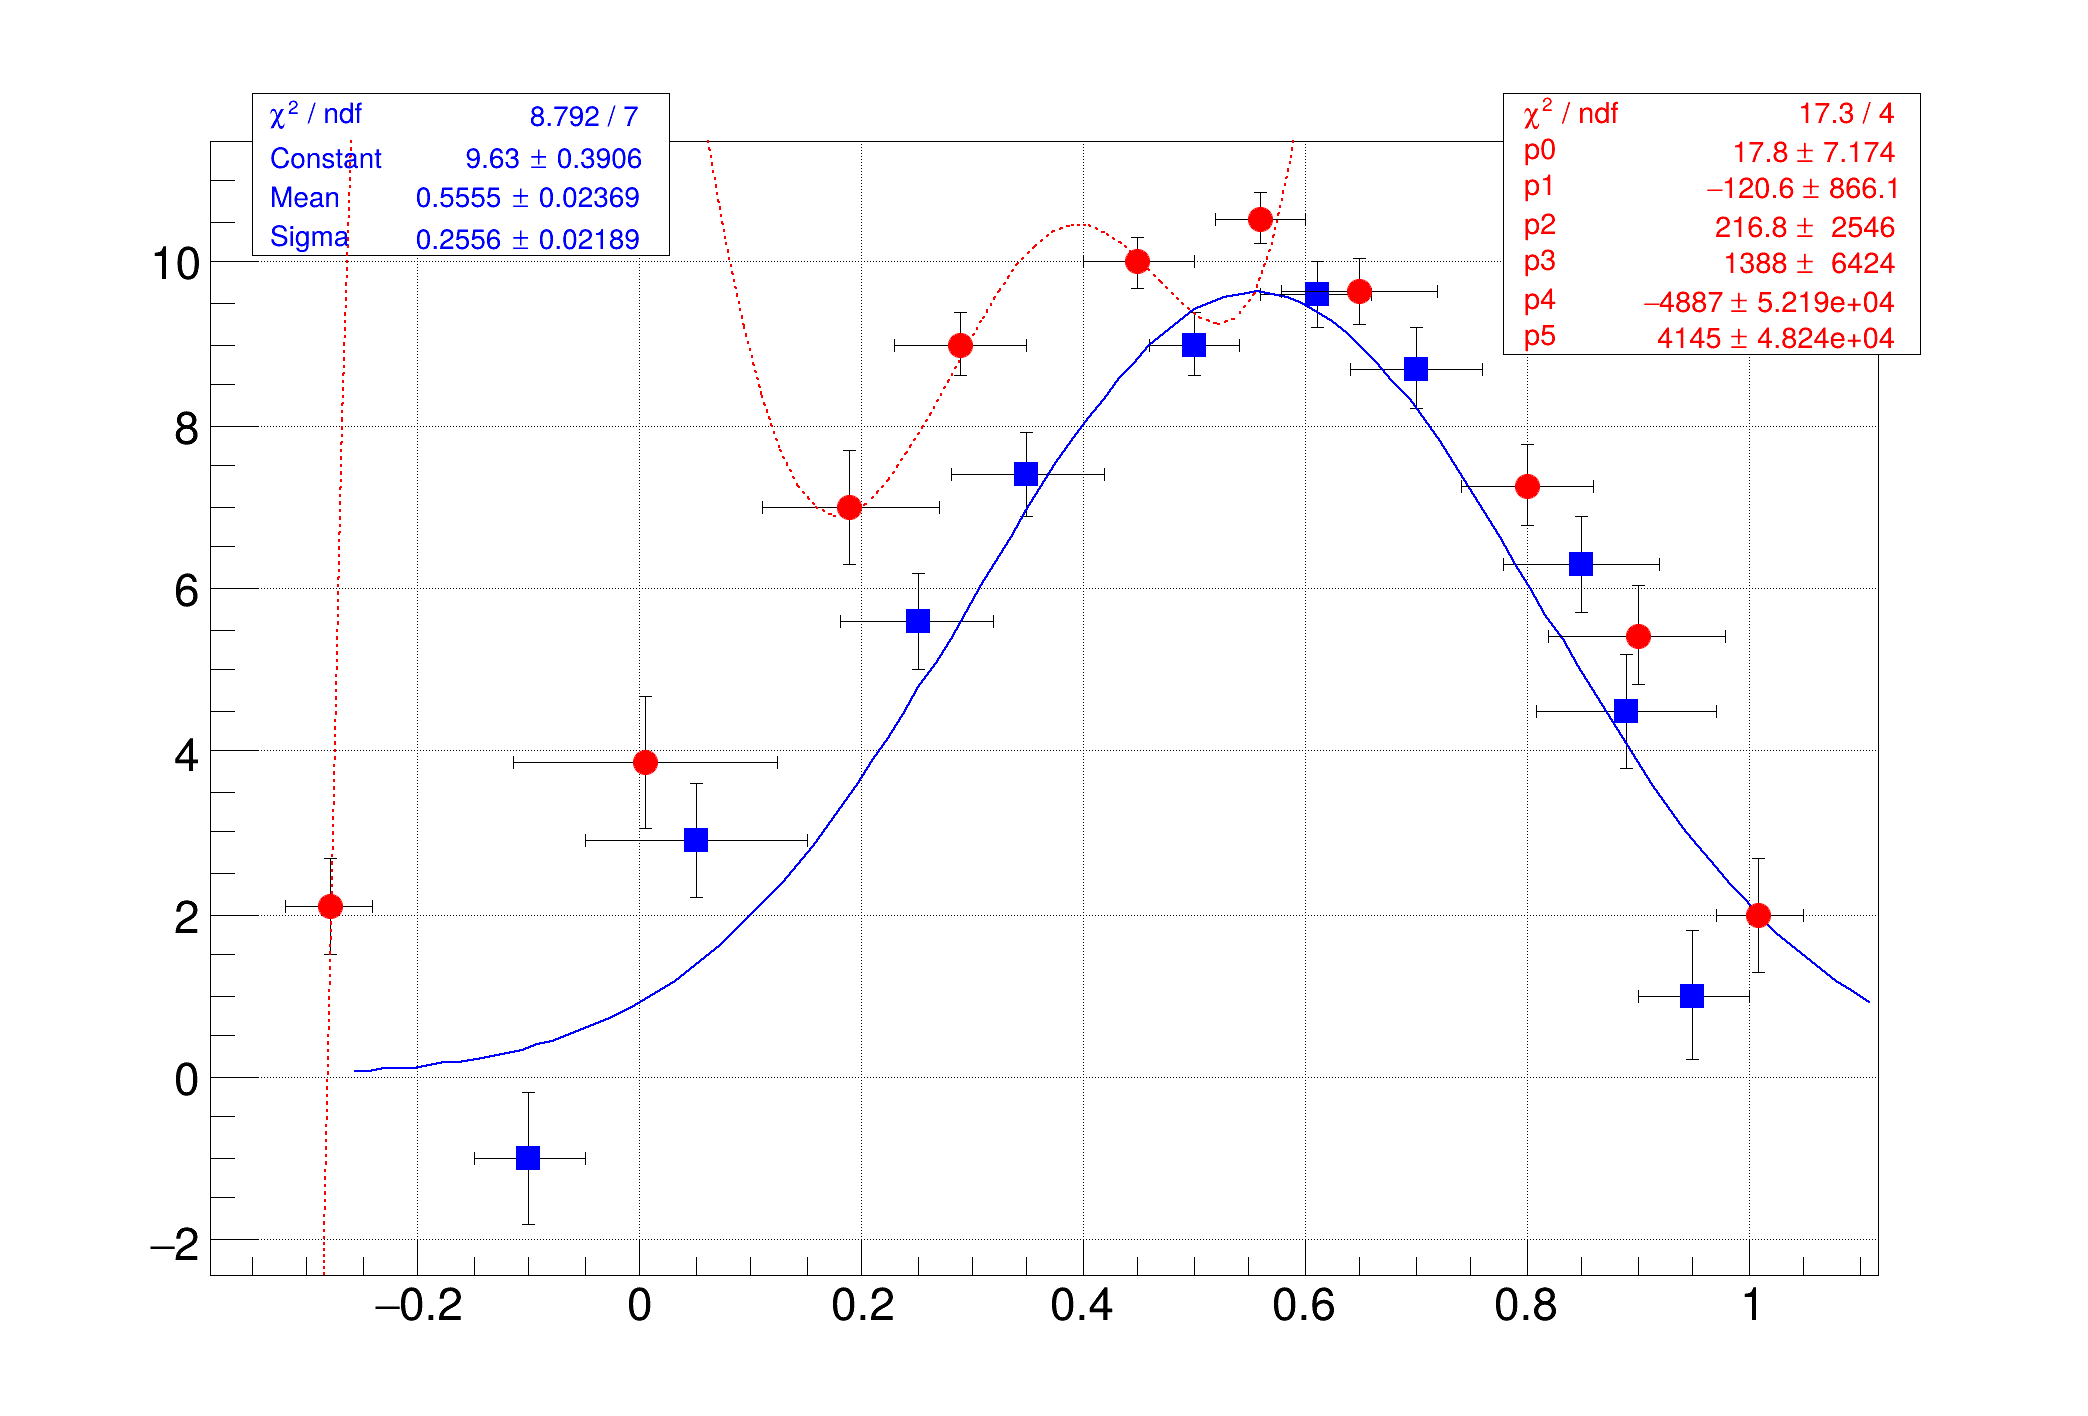 TMultiGraph is used to combine multiple graphs into one plot.
