

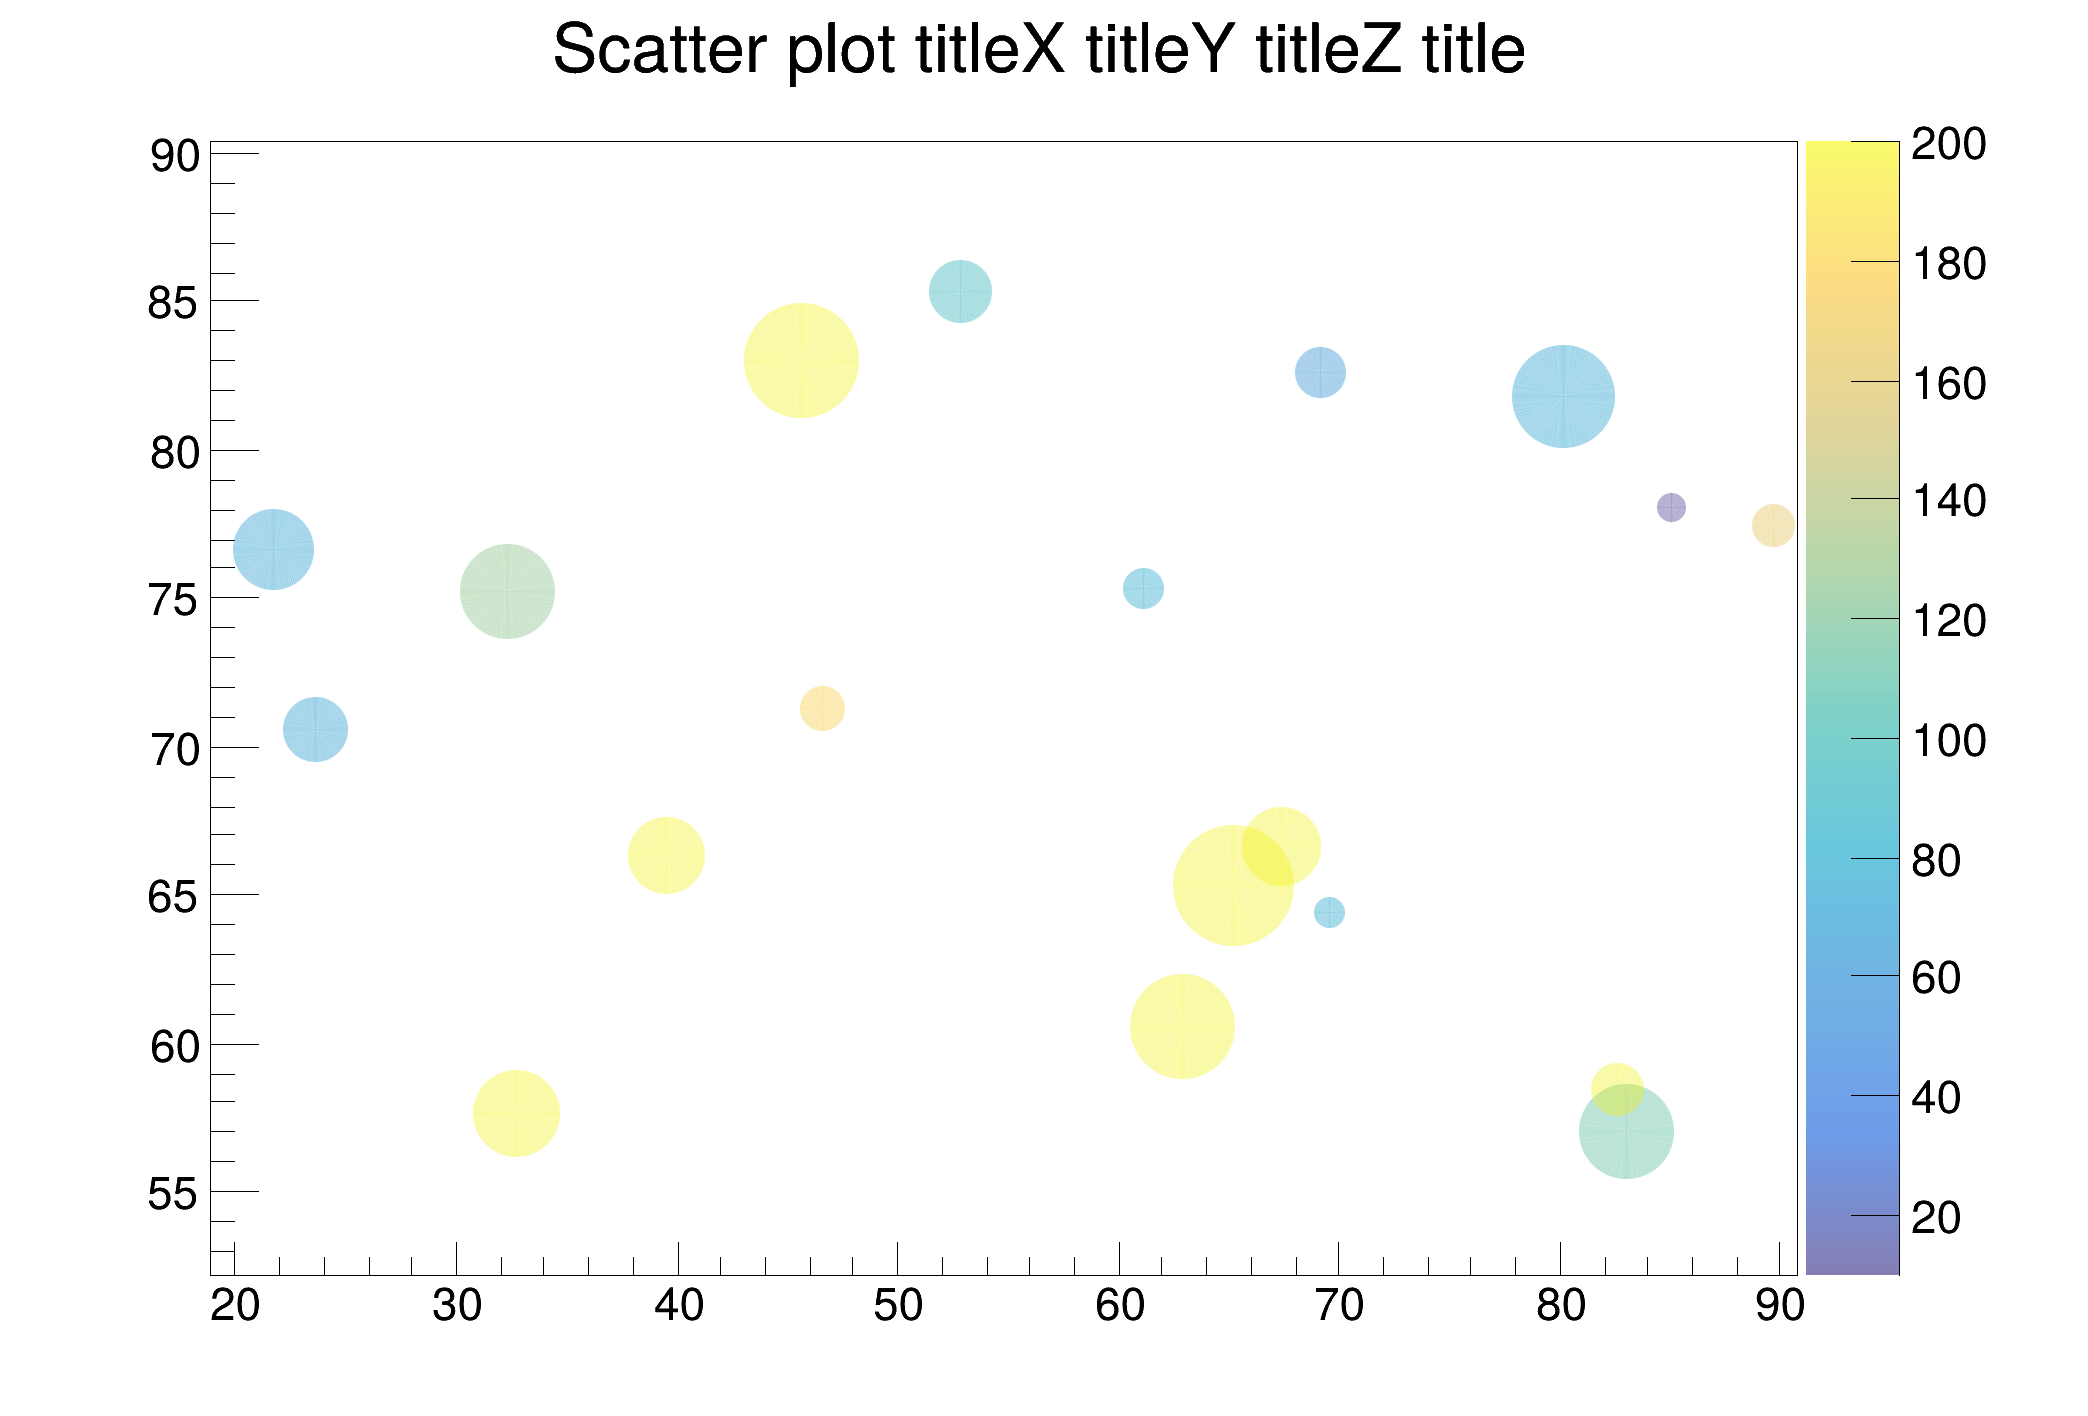
 Draw a scatter plot for 4 variables, mapped to: x, y, marker colour and marker size.
TScatter is available since ROOT v.6.30. See the TScatter documentation
import numpy as np
import ROOT
canvas = ROOT.TCanvas()
canvas.SetRightMargin(0.14)
ROOT.gStyle.SetPalette(ROOT.kBird, 0, 0.6)
n = 175
x = np.array([])
y = np.array([])
c = np.array([])
s = np.array([])
r = ROOT.TRandom()
for i in range(n):
x = np.append(x, 100 * r.Rndm(i))
y = np.append(y, 200 * r.Rndm(i))
c = np.append(c, 300 * r.Rndm(i))
s = np.append(s, 400 * r.Rndm(i))
scatter = ROOT.TScatter(n, x, y, c, s)
scatter.SetMarkerStyle(20)
scatter.SetTitle("Scatter plot titleX titleY titleZ title")
scatter.GetXaxis().SetRangeUser(20.0, 90.0)
scatter.GetYaxis().SetRangeUser(55.0, 90.0)
scatter.GetZaxis().SetRangeUser(10.0, 200.0)
scatter.Draw("A")
- Author
- Olivier Couet, Jamie Gooding
Definition in file gr006_scatter.py.

