

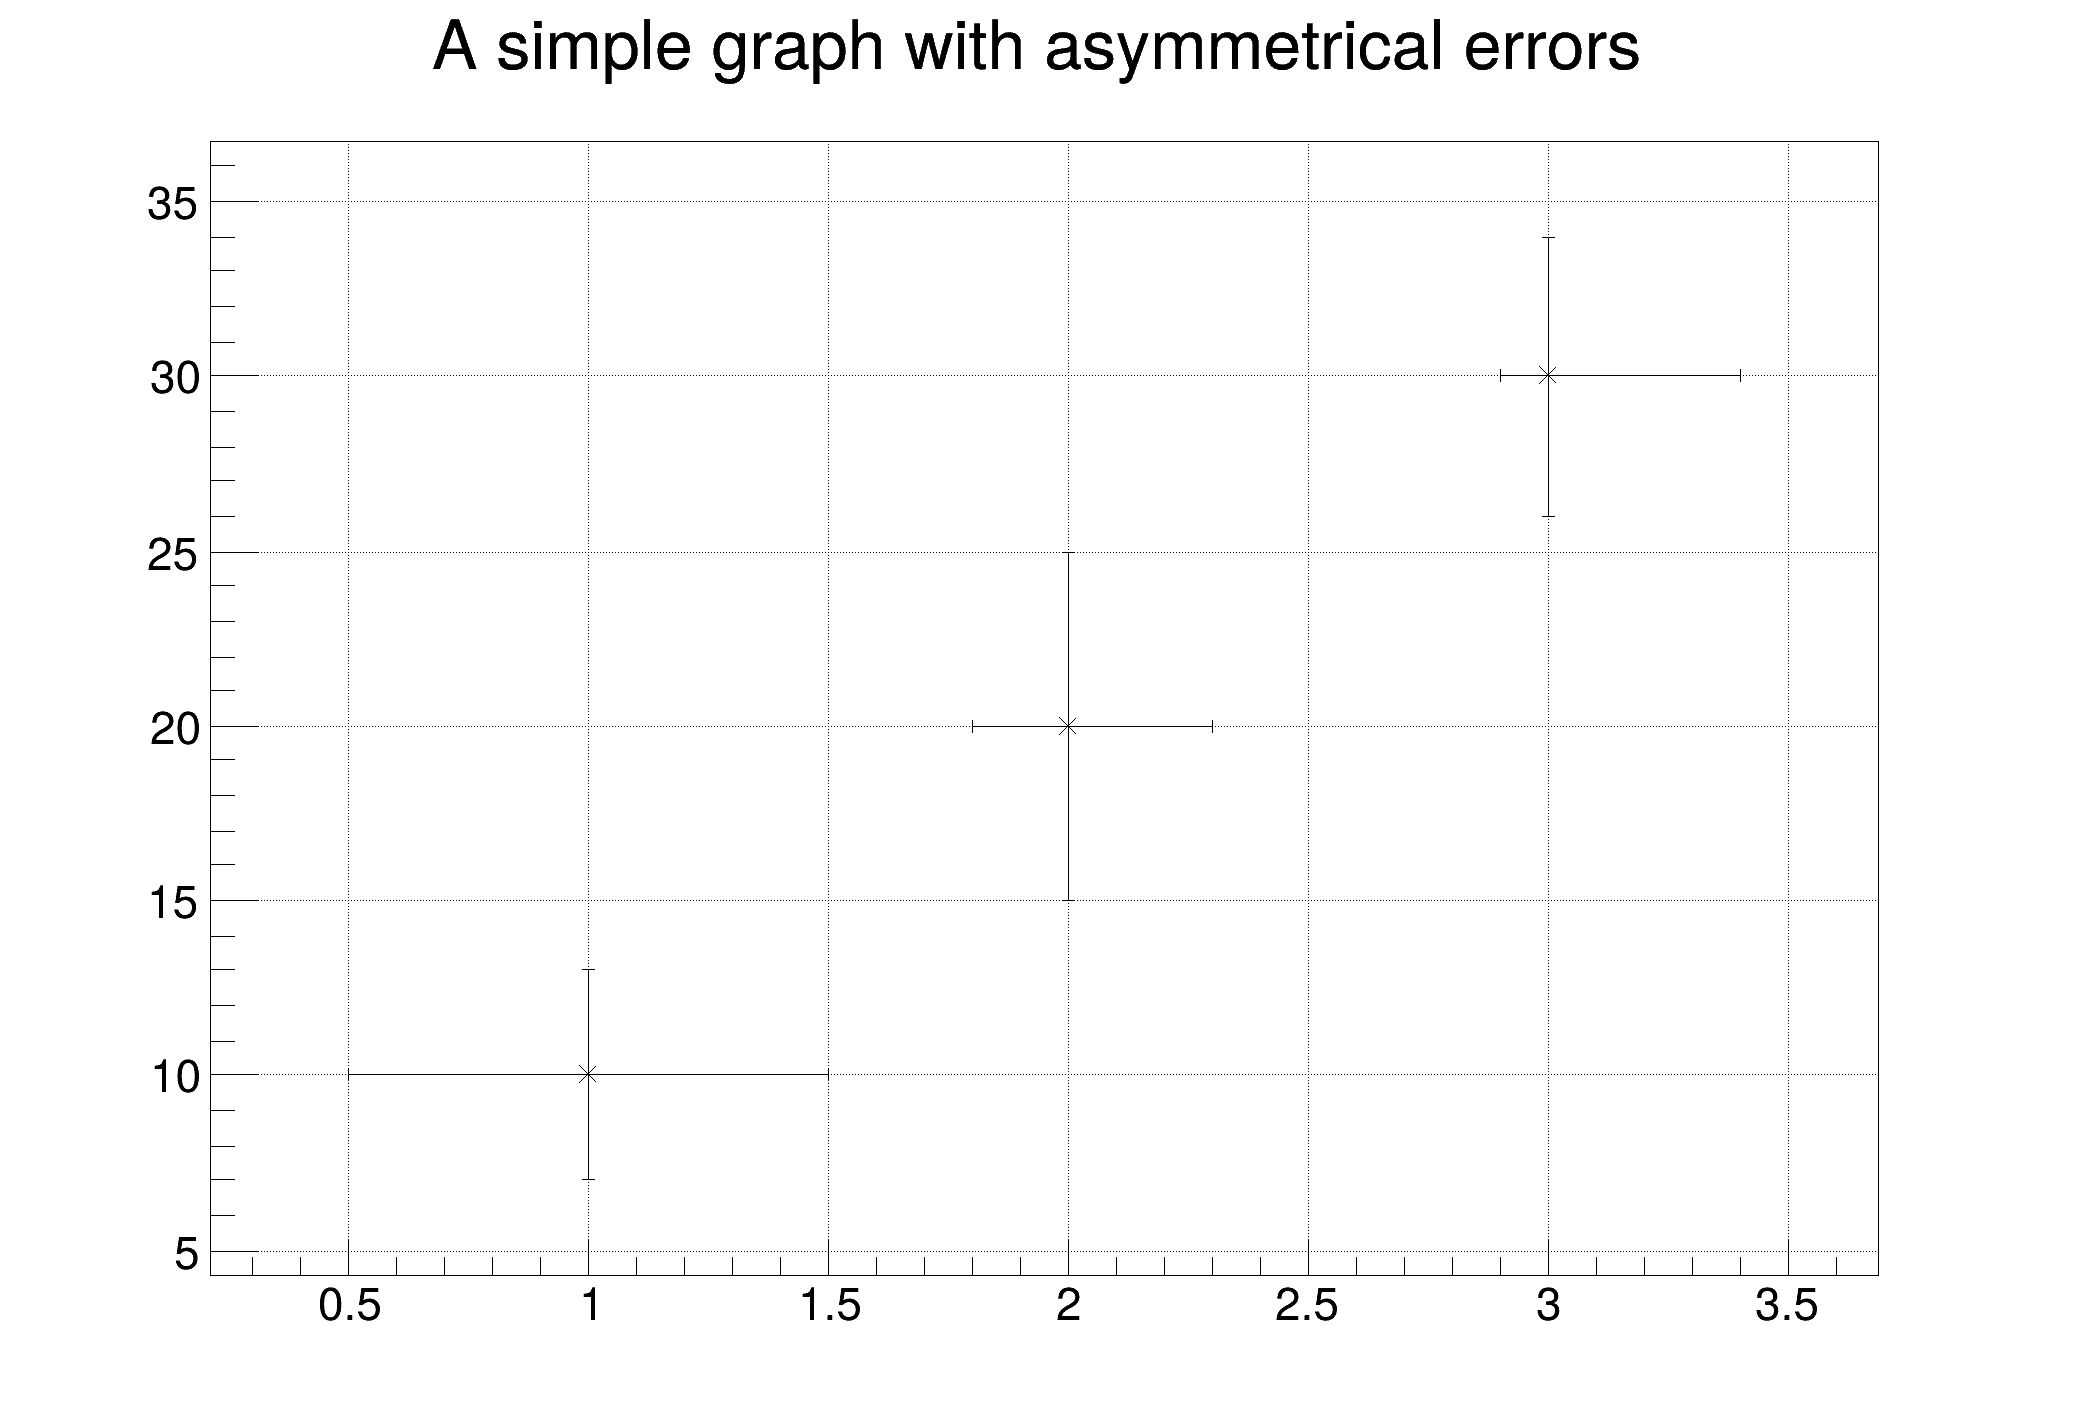
 This tutorial demonstrates the use of TGraphAsymmErrors to plot a graph with asymmetrical errors on both the x and y axes.
The errors for the x values are divided into low (left side of the marker) and high (right side of the marker) errors. Similarly, for the y values, there are low (lower side of the marker) and high (upper side of the marker) errors.
import numpy as np
import ROOT
c2 = ROOT.TCanvas("c2", "", 700, 500)
c2.SetGrid()
npoints = 3
xaxis = np.array([1.0, 2.0, 3.0])
yaxis = np.array([10.0, 20.0, 30.0])
exl = np.array([0.5, 0.2, 0.1])
exh = np.array([0.5, 0.3, 0.4])
eyl = np.array([3.0, 5.0, 4.0])
eyh = np.array([3.0, 5.0, 4.0])
gr = ROOT.TGraphAsymmErrors(
npoints, xaxis, yaxis, exl, exh, eyl, eyh
)
gr.SetTitle("A simple graph with asymmetrical errors")
gr.Draw("A*")
- Author
- Miro Helbich, Jamie Gooding
Definition in file gr004_errors_asym.py.

