We first draw an empty frame with the axes, then draw the graphs on top of it Note that the graphs should have the same or very close ranges (in both axis), otherwise they may not be visible in the frame.
void gr003_errors2() {
TH1F *hr =
c1->DrawFrame(-0.4,0,1.2,12);
c1->GetFrame()->SetBorderSize(12);
Double_t xval1[] = {-0.22, 0.05, 0.25, 0.35, 0.5, 0.61,0.7,0.85,0.89,0.95};
Double_t yval1[] = {1,2.9,5.6,7.4,9,9.6,8.7,6.3,4.5,1};
Double_t ex1[] = {.05,.1,.07,.07,.04,.05,.06,.07,.08,.05};
Double_t ey1[] = {.8,.7,.6,.5,.4,.4,.5,.6,.7,.8};
Float_t xval2[] = {-0.28, 0.005, 0.19, 0.29, 0.45, 0.56,0.65,0.80,0.90,1.01};
Float_t yval2[] = {0.82,3.86,7,9,10,10.55,9.64,7.26,5.42,2};
Float_t ex2[] = {.04,.12,.08,.06,.05,.04,.07,.06,.08,.04};
Float_t ey2[] = {.6,.8,.7,.4,.3,.3,.4,.5,.6,.7};
}
int Int_t
Signed integer 4 bytes (int).
float Float_t
Float 4 bytes (float).
double Double_t
Double 8 bytes.
virtual void SetMarkerColor(Color_t mcolor=1)
Set the marker color.
virtual void SetMarkerStyle(Style_t mstyle=1)
Set the marker style.
A TGraphErrors is a TGraph with error bars.
void Draw(Option_t *chopt="") override
Default Draw method for all objects.
1-D histogram with a float per channel (see TH1 documentation)
virtual void SetXTitle(const char *title)
virtual void SetYTitle(const char *title)

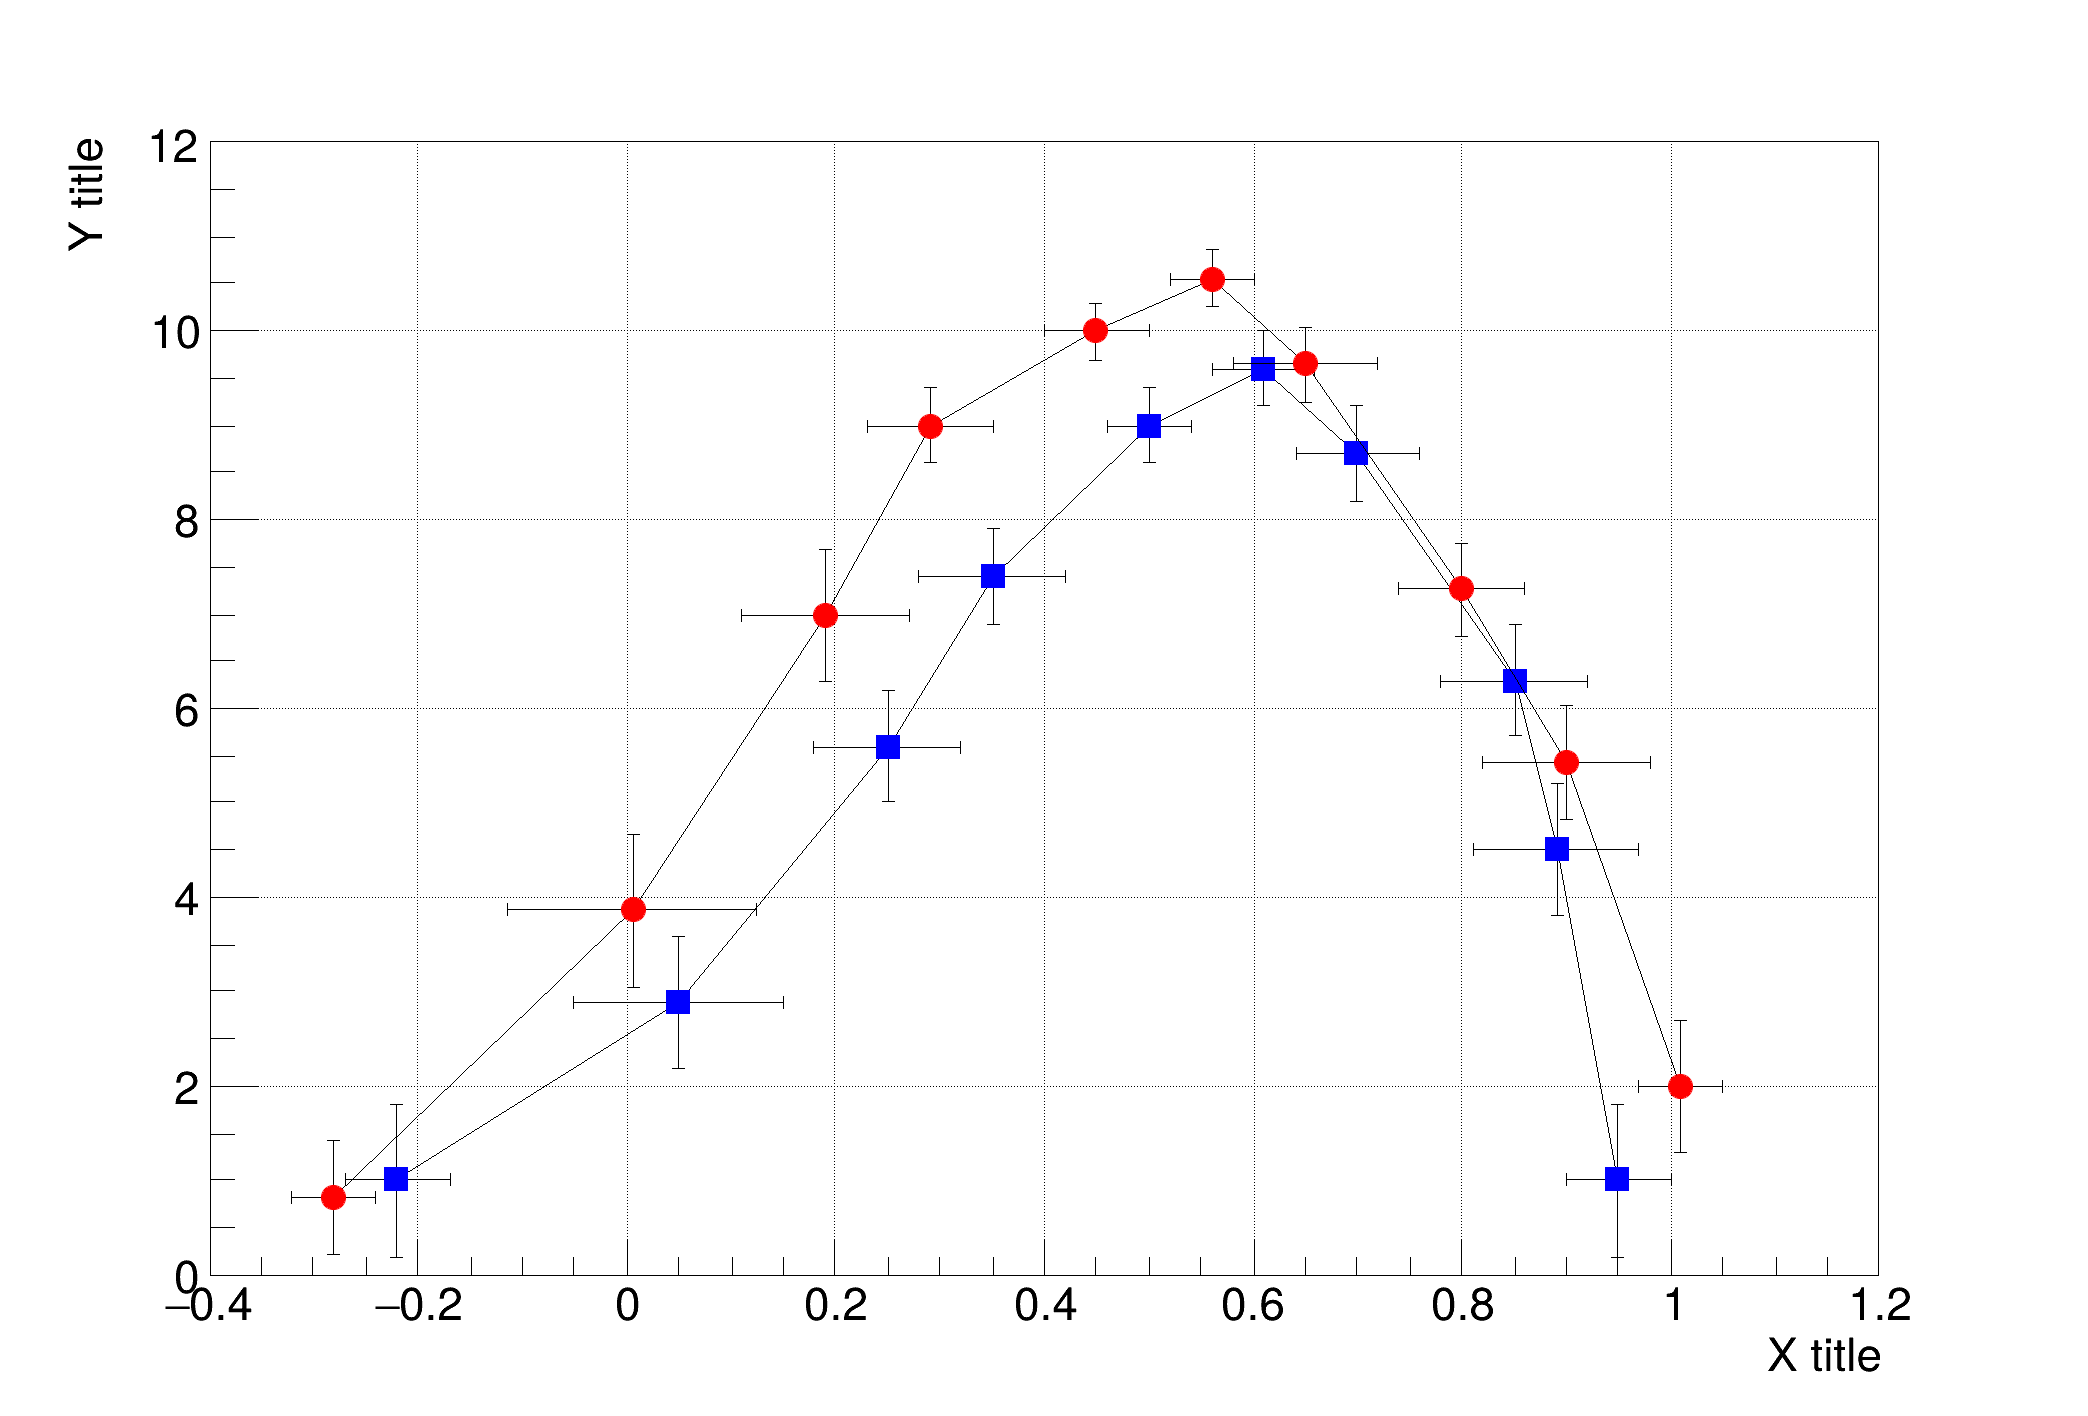 Create and draw two graphs with error bars, superposed on the same canvas
