import numpy as np
import ROOT
c1 = ROOT.TCanvas("c1", "A Simple Graph with error bars", 200, 10, 700, 500)
c1.SetGrid()
n = 10
x = np.array([-0.22, 0.05, 0.25, 0.35, 0.5, 0.61, 0.7, 0.85, 0.89, 0.95])
y = np.array([1, 2.9, 5.6, 7.4, 9, 9.6, 8.7, 6.3, 4.5, 1])
ex = np.array([0.05, 0.1, 0.07, 0.07, 0.04, 0.05, 0.06, 0.07, 0.08, 0.05])
ey = np.array([0.8, 0.7, 0.6, 0.5, 0.4, 0.4, 0.5, 0.6, 0.7, 0.8])
gr = ROOT.TGraphErrors(n, x, y, ex, ey)
gr.SetTitle("TGraphErrors Example")
gr.SetMarkerColor(4)
gr.SetMarkerStyle(21)
gr.Draw("ALP")
c1.Update()

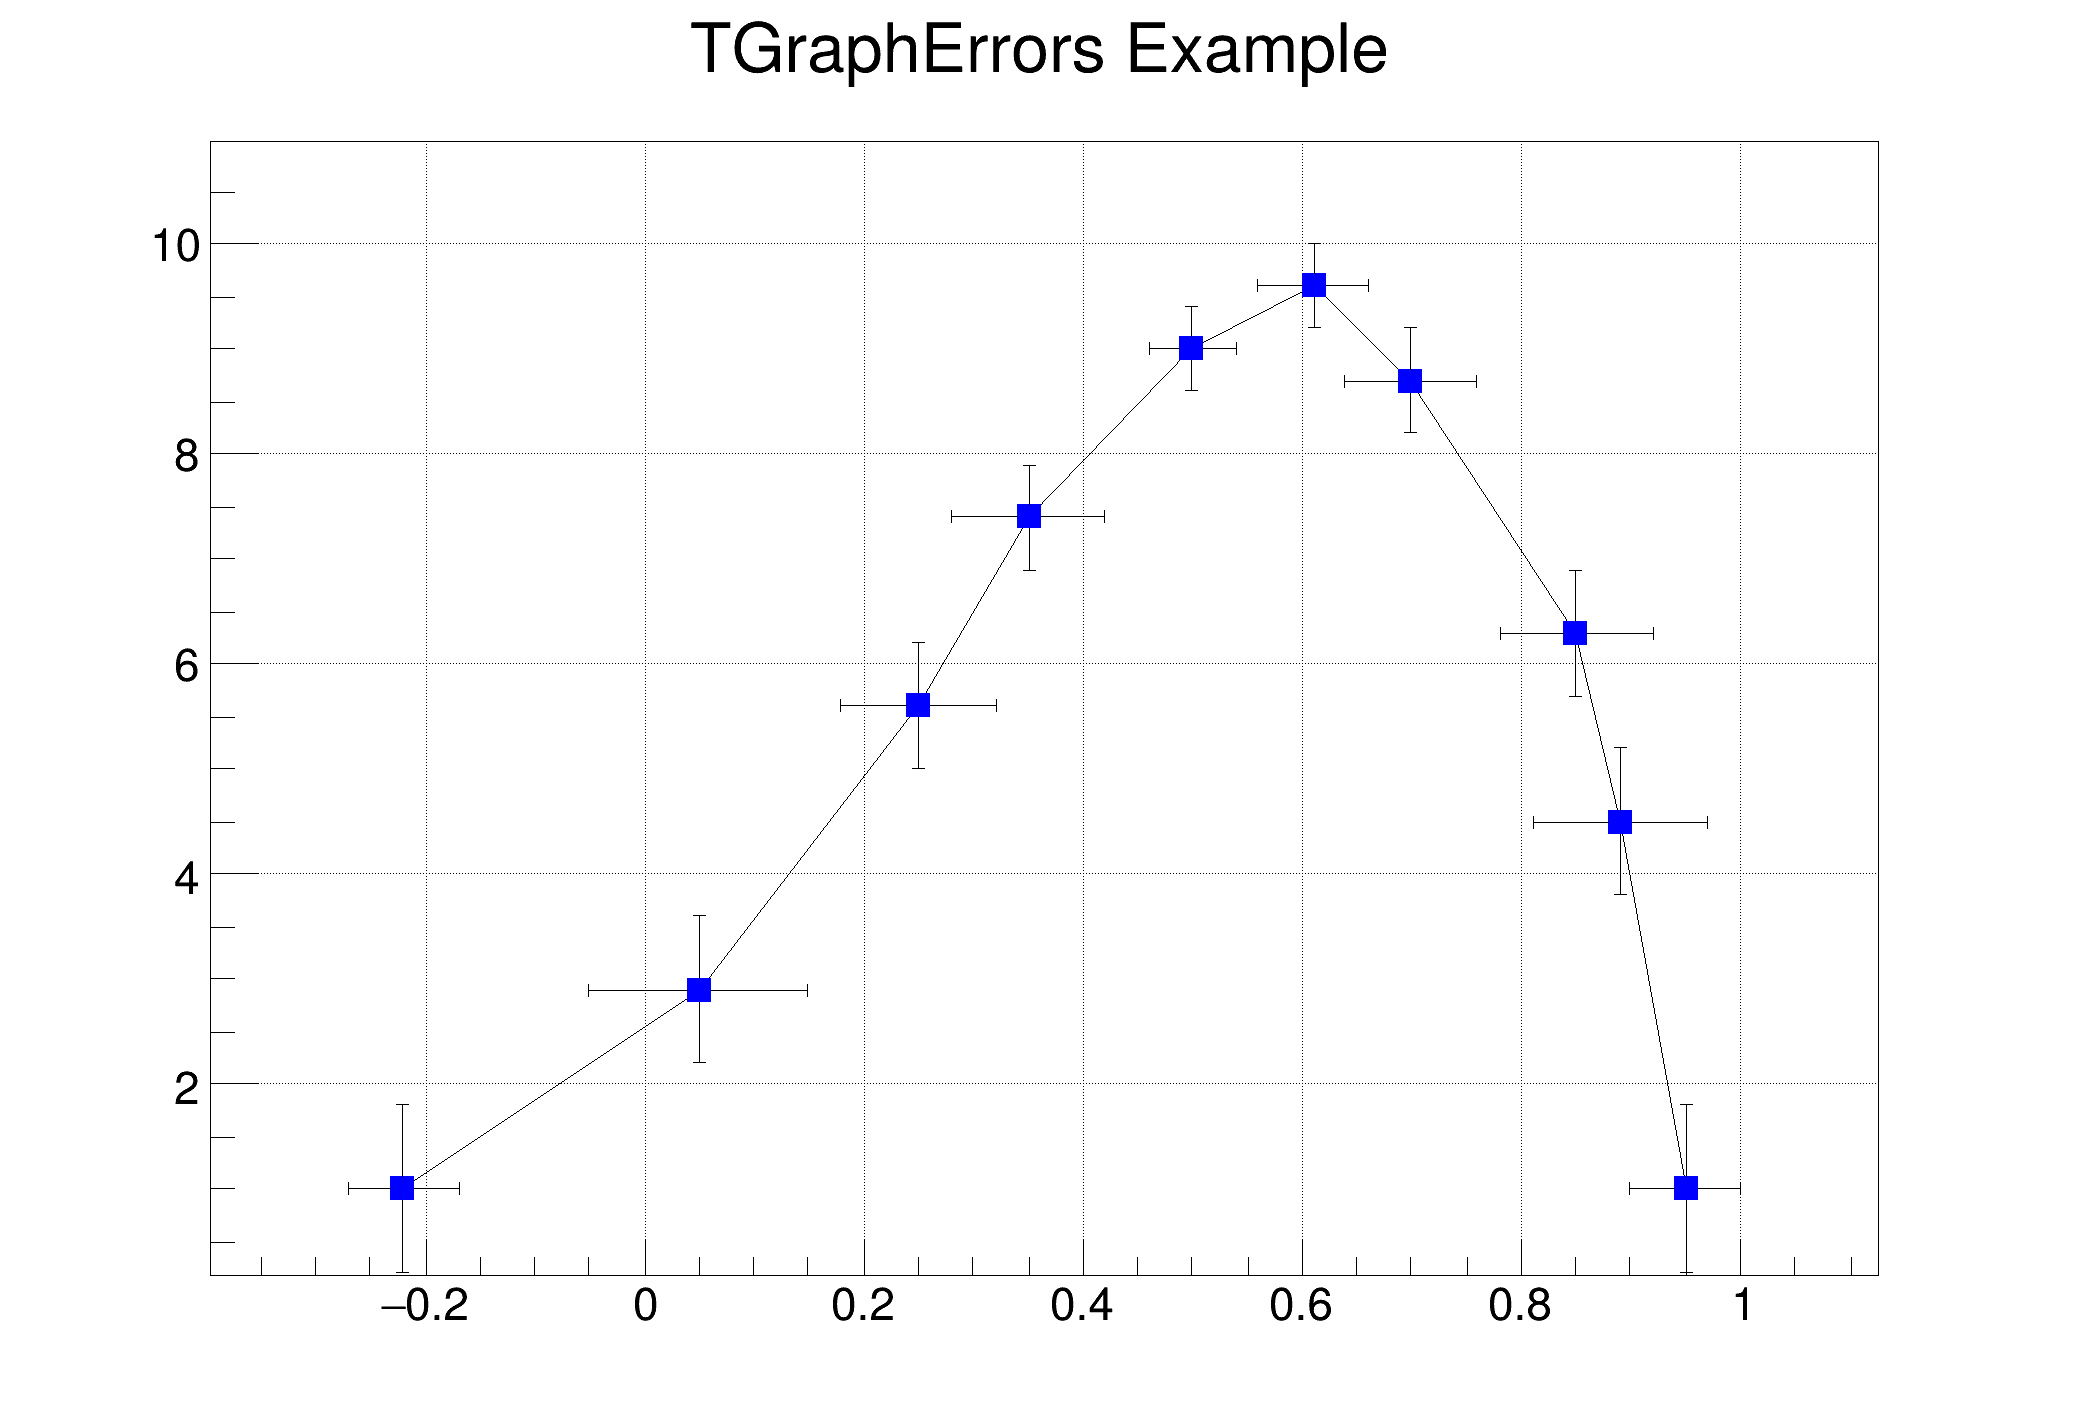 Create and draw a graph with error bars.
